

Premature mortality projections in the USA through 2030: a modelling study
- PMID: 30037721
- PMCID: PMC6233712
- DOI: 10.1016/S2468-2667(18)30114-2
Premature mortality projections in the USA through 2030: a modelling study
Erratum in
-
Correction to Lancet Public Health 2018; 3: 374-84.Lancet Public Health. 2018 Aug;3(8):e364. doi: 10.1016/S2468-2667(18)30147-6. Epub 2018 Jul 25. Lancet Public Health. 2018. PMID: 30055997 Free PMC article. No abstract available.
Abstract
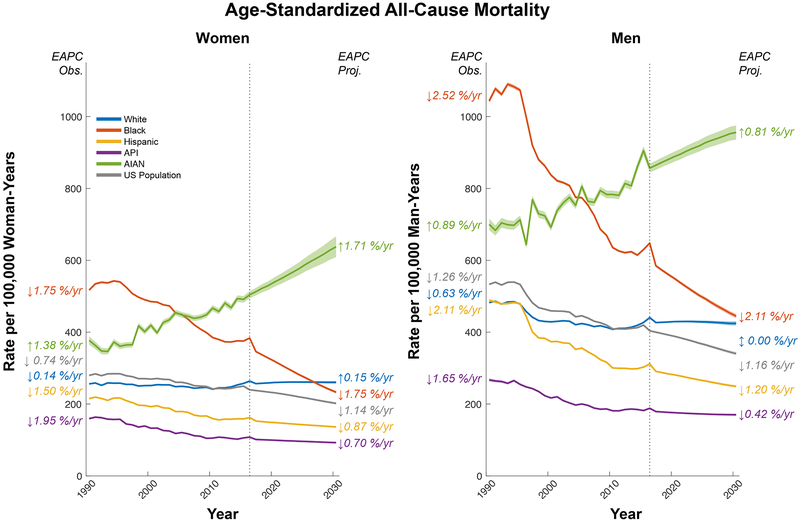
Background: Although life expectancy has been projected to increase across high-income countries, gains for the USA are anticipated to be among the smallest, and overall US death rates actually increased from 2014 to 2015, with divergence for specific US populations. Therefore, projecting future premature mortality is essential for clinical and public health service planning, curbing rapidly increasing causes of death, and sustaining progress in declining causes of death. We aimed to project premature mortality (here defined as deaths of individuals aged 25-64 years) trends through 2030, and to estimate the total number of projected deaths, the projected number of potential years of life lost due to premature mortality, and the effect of reducing projected accidental death rates by 2% per year.
Methods: We obtained death certificate data for the US population aged 25-64 years for 1990-2015 from the US Centers for Disease Control and Prevention (CDC) National Center for Health Statistics. We obtained US mortality data for 2016 for non-American Indian or Alaska native groups from CDC WONDER; data for 2016 were not available for American Indians or Alaska natives. Our analysis focused on all-cause premature mortality and the commonest causes of premature death (cancer, heart disease, accidents, suicide, and chronic liver disease or cirrhosis) among white, black, Hispanic, Asian or Pacific islanders, and American Indian or Alaska native men and women. We estimated age-standardised premature mortality and corresponding annual percentage changes for 2017-30 by sex and race or ethnic origin by use of age-period-cohort forecasting models. We also did a sensitivity analysis projecting future mortality from cross-sectional mortality and a JoinPoint of the (log) period rate ratio curve. We calculated absolute death counts by use of corresponding age-specific and year-specific US census population projections, and estimated years of potential life lost.
Findings: During 2017-30, all-cause deaths are projected to increase among white women and American Indians or Alaska natives, resulting in 239 700 excess premature deaths relative to 2017 rates (a 10% increase). Mortality declines in white men and black, Hispanic, and Asian or Pacific islander men and women will result in 945 900 fewer deaths (a 14% reduction). Cancer mortality rates are projected to decline among white, black, Hispanic, and Asian or Pacific islander women and men, with the largest declines among black women (age-standardised premature mortality rate 2016: 104·5 deaths per 100 000 woman-years; 2030: 77·1 per 100 000 woman-years) and men (2016: 116·8 per 100 000 man-years; 2030: 81·6 per 100 000 man-years). Heart disease death rates are projected to increase in American Indian or Alaska native men (2015: 150·9 per 100 000 man-years; 2030: 175·9 per 100 000 man-years) and decline in other groups, albeit only slightly in white (2016: 35·6 per 100 000 woman-years; 2030: 31·1 per 100 000 woman-years) and American Indian or Alaska native women (2015: 64·4 per 100 000 woman-years; 2030: 62·8 per 100 000 woman-years). Accidental death rates are projected to increase in all US populations except Asian or Pacific islander women, and will increase most rapidly among white women (2030: 60·5 per 100 000 woman-years) and men (2030: 101·9 per 100 000 man-years) and American Indian or Alaska native women (2030: 97·5 per 100 000 woman-years) and men (2030: 298·7 per 100 000 man-years). Suicide rates are projected to increase for all groups, and chronic liver disease and cirrhosis deaths are projected to increase for all groups except black men. A 2% per year reduction in projected accidental deaths would eliminate an estimated 178 700 deaths during 2017-30.
Interpretation: To reduce future premature mortality, effective interventions are needed to address rapidly rising mortality rates due to accidents, suicides, and chronic liver disease and cirrhosis.
Funding: National Cancer Institute Intramural Research Program.
Copyright © 2018 The Author(s). Published by Elsevier Ltd. This is an Open Access article under the CC BY 4.0 license. Published by Elsevier Ltd.. All rights reserved.
Conflict of interest statement
Declaration of Interest
We declare no competing interests.
Figures


Comment in
-
The fatal outcomes of failed prevention.Lancet Public Health. 2018 Aug;3(8):e354-e355. doi: 10.1016/S2468-2667(18)30140-3. Epub 2018 Jul 21. Lancet Public Health. 2018. PMID: 30037722 No abstract available.
References
-
- Xu J, Murphy SL, Kochanek KD, Arias E. Mortality in the United States, 2015. NCHS Data Brief 2016; (267): 1–8. - PubMed
Publication types
MeSH terms
Grants and funding
LinkOut - more resources
Full Text Sources
Other Literature Sources
