

Integrated Analysis of RNA and DNA from the Phase III Trial CALGB 40601 Identifies Predictors of Response to Trastuzumab-Based Neoadjuvant Chemotherapy in HER2-Positive Breast Cancer
- PMID: 30037817
- PMCID: PMC6214737
- DOI: 10.1158/1078-0432.CCR-17-3431
Integrated Analysis of RNA and DNA from the Phase III Trial CALGB 40601 Identifies Predictors of Response to Trastuzumab-Based Neoadjuvant Chemotherapy in HER2-Positive Breast Cancer
Abstract
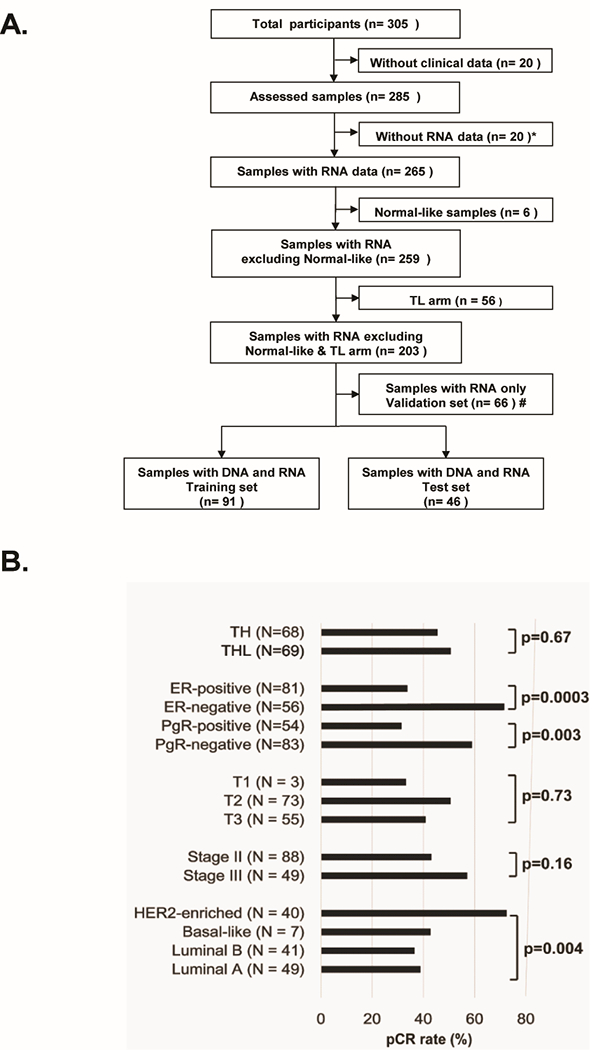
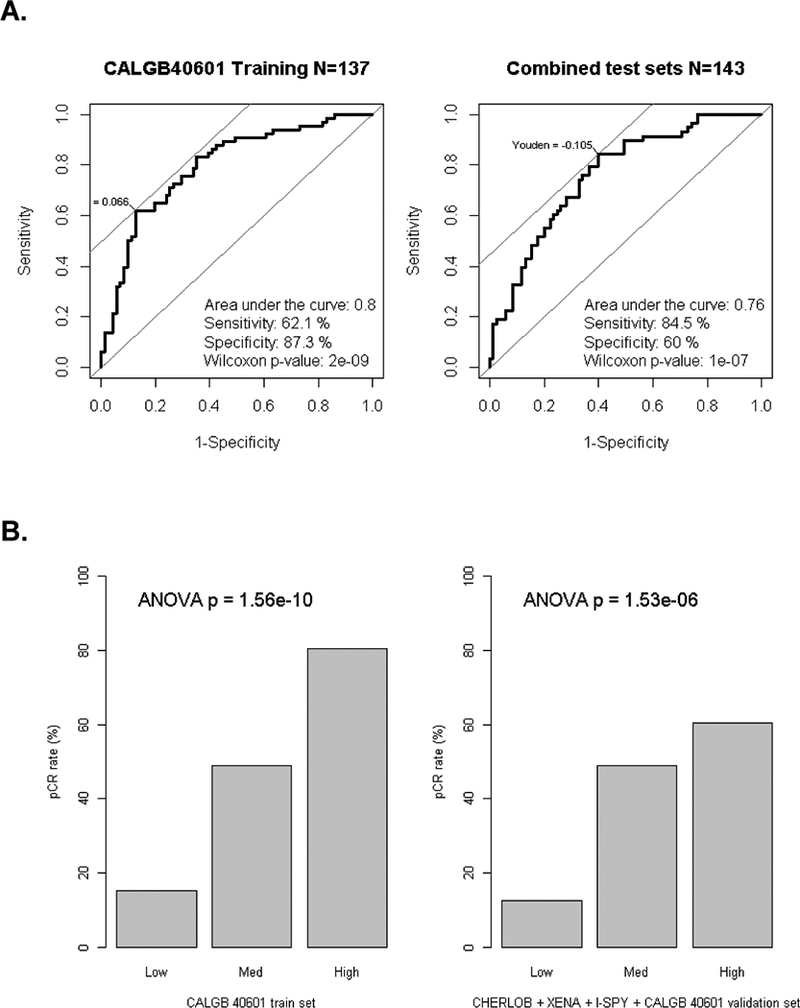
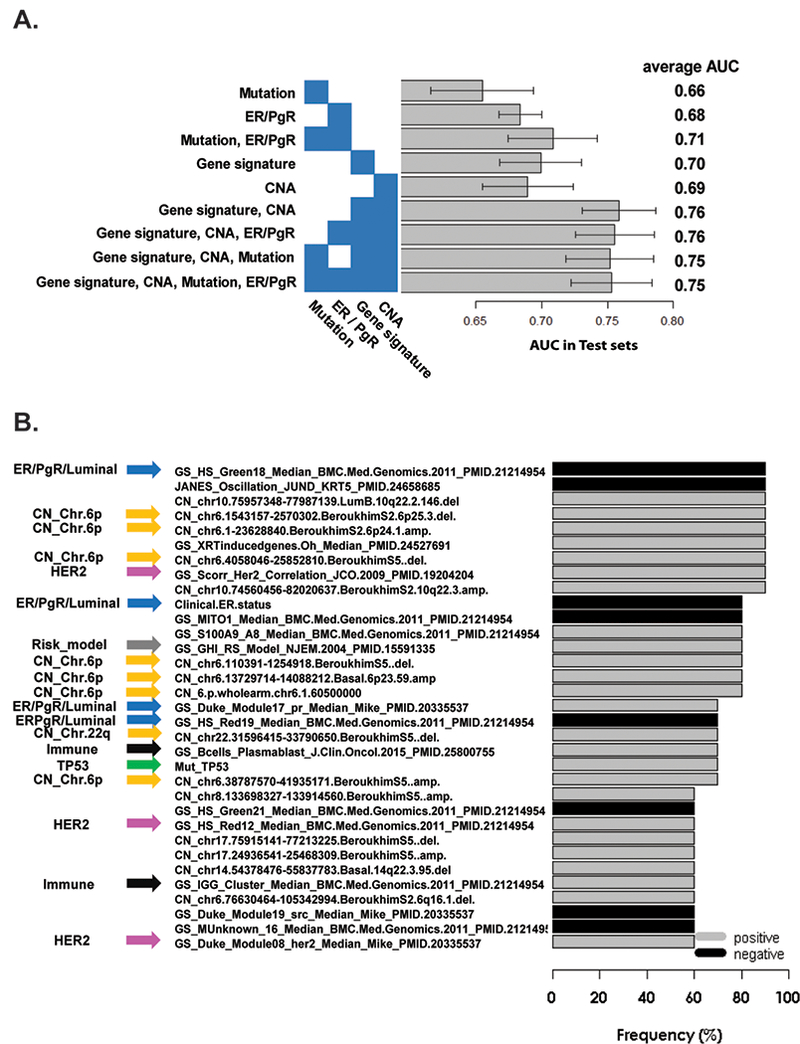
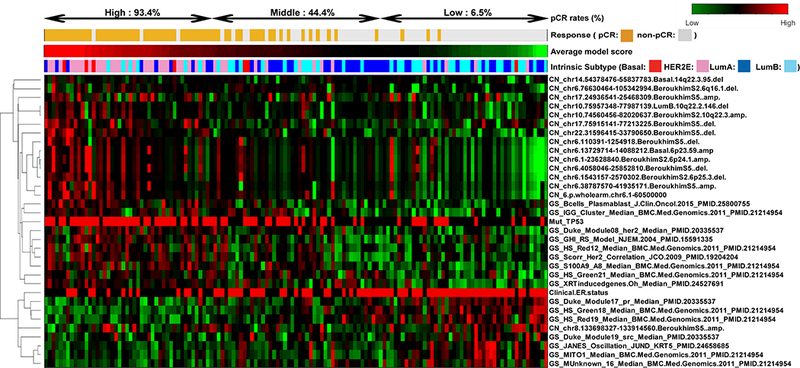
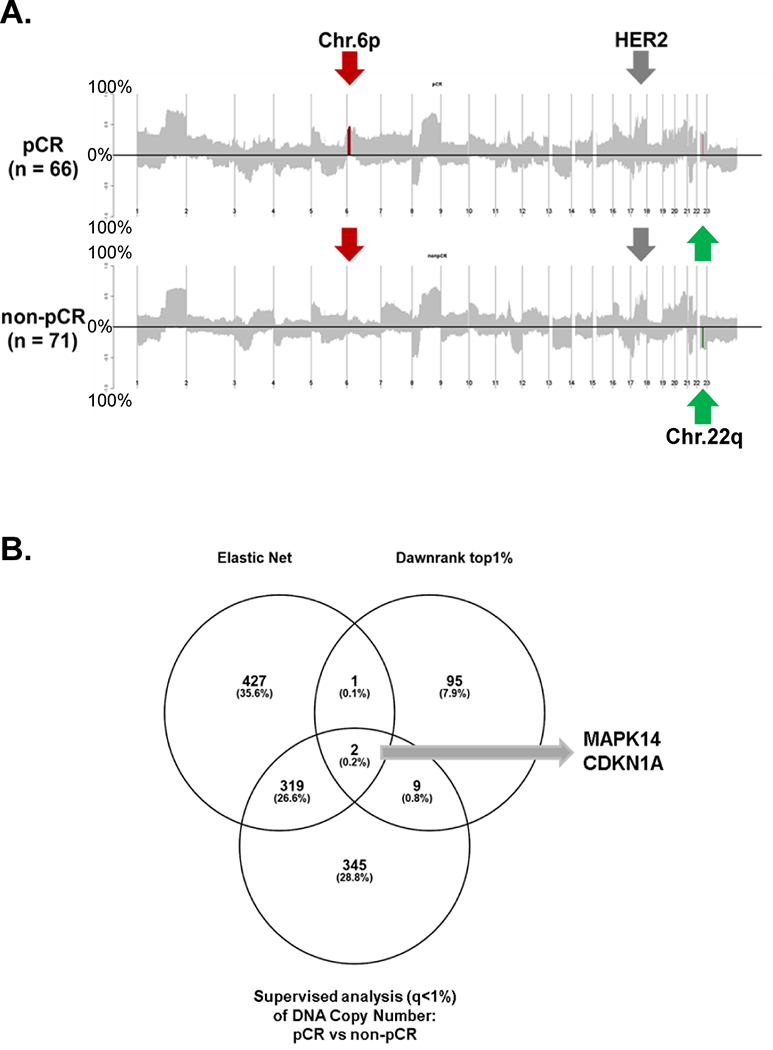
Purpose: Response to a complex trastuzumab-based regimen is affected by multiple features of the tumor and its microenvironment. Developing a predictive algorithm is key to optimizing HER2-targeting therapy.Experimental Design: We analyzed 137 pretreatment tumors with mRNA-seq and DNA exome sequencing from CALGB 40601, a neoadjuvant phase III trial of paclitaxel plus trastuzumab with or without lapatinib in stage II to III HER2-positive breast cancer. We adopted an Elastic Net regularized regression approach that controls for covarying features within high-dimensional data. First, we applied 517 known gene expression signatures to develop an Elastic Net model to predict pCR, which we validated on 143 samples from four independent trials. Next, we performed integrative analyses incorporating clinicopathologic information with somatic mutation status, DNA copy number alterations (CNA), and gene signatures.Results: The Elastic Net model using only gene signatures predicted pCR in the validation sets (AUC = 0.76). Integrative analyses showed that models containing gene signatures, clinical features, and DNA information were better pCR predictors than models containing a single data type. Frequently selected variables from the multiplatform models included amplifications of chromosome 6p, TP53 mutation, HER2-enriched subtype, and immune signatures. Variables predicting resistance included Luminal/ER+ features.Conclusions: Models using RNA only, as well as integrated RNA and DNA models, can predict pCR with improved accuracy over clinical variables. Somatic DNA alterations (mutation, CNAs), tumor molecular subtype (HER2E, Luminal), and the microenvironment (immune cells) were independent predictors of response to trastuzumab and paclitaxel-based regimens. This highlights the complexity of predicting response in HER2-positive breast cancer. Clin Cancer Res; 24(21); 5292-304. ©2018 AACR.
©2018 American Association for Cancer Research.
Conflict of interest statement
Conflict of interest
The following authors or their immediate family members indicated a financial interest.
Ownership: Donald A Berry, Berry Consultants LLC; Charles M Perou, Bioclassifier, GeneCentric Diagnostics;
Income: Donald A Berry, Berry Consultants LLC; Charles M Perou, royalties from PAM50 breast cancer gene patent application; Terry Hyslop, Abbie;
Intellectual Property : Charles M Perou and Joel S Parker, PAM50 breast cancer gene patent(s)
The other authors have no conflict of interest.
Figures
References
-
- Perez EA, Romond EH, Suman VJ, Jeong JH, Sledge G, Geyer CE Jr., et al. Trastuzumab plus adjuvant chemotherapy for human epidermal growth factor receptor 2-positive breast cancer: planned joint analysis of overall survival from NSABP B-31 and NCCTG N9831. J Clin Oncol 2014;32(33):3744–52 doi 10.1200/JCO.2014.55.5730. - DOI - PMC - PubMed
-
- Martine J Piccart-Gebhart APH, Jose Baselga, Evandro De Azambuja, Amylou C. Dueck, Giuseppe Viale, et al. First results from the phase III ALTTO trial (BIG 2–06; NCCTG [Alliance] N063D) comparing one year of anti-HER2 therapy with lapatinib alone (L), trastuzumab alone (T), their sequence (T→L), or their combination (T+L) in the adjuvant treatment of HER2-positive early breast cancer (EBC). J Clin Oncol 32:5s, 2014. (suppl; abstr LBA4) 2014.
-
- Chan A, Delaloge S, Holmes FA, Moy B, Iwata H, Harvey VJ, et al. Neratinib after trastuzumab-based adjuvant therapy in patients with HER2-positive breast cancer (ExteNET): a multicentre, randomised, double-blind, placebo-controlled, phase 3 trial. Lancet Oncol 2016;17(3):367–77 doi 10.1016/S1470-2045(15)00551-3. - DOI - PubMed
Publication types
MeSH terms
Substances
Grants and funding
- P30 ES010126/ES/NIEHS NIH HHS/United States
- U10 CA181009/CA/NCI NIH HHS/United States
- UG1 CA233329/CA/NCI NIH HHS/United States
- UG1 CA233178/CA/NCI NIH HHS/United States
- U10 CA180821/CA/NCI NIH HHS/United States
- U10 CA180801/CA/NCI NIH HHS/United States
- U10 CA180858/CA/NCI NIH HHS/United States
- P50 CA058223/CA/NCI NIH HHS/United States
- P30 CA008748/CA/NCI NIH HHS/United States
- R01 CA195740/CA/NCI NIH HHS/United States
- U10 CA180818/CA/NCI NIH HHS/United States
- U10 CA180882/CA/NCI NIH HHS/United States
- U10 CA180867/CA/NCI NIH HHS/United States
- U10 CA180838/CA/NCI NIH HHS/United States
- U10 CA180888/CA/NCI NIH HHS/United States
- UL1 TR000371/TR/NCATS NIH HHS/United States
LinkOut - more resources
Full Text Sources
Other Literature Sources
Medical
Molecular Biology Databases
Research Materials
Miscellaneous
