

Luteinizing hormone signaling restricts hematopoietic stem cell expansion during puberty
- PMID: 30037826
- PMCID: PMC6120660
- DOI: 10.15252/embj.201898984
Luteinizing hormone signaling restricts hematopoietic stem cell expansion during puberty
Abstract
The number and self-renewal capacity of hematopoietic stem cells (HSCs) are tightly regulated at different developmental stages. Many pathways have been implicated in regulating HSC development in cell autonomous manners; however, it remains unclear how HSCs sense and integrate developmental cues. In this study, we identified an extrinsic mechanism by which HSC number and functions are regulated during mouse puberty. We found that the HSC number in postnatal bone marrow reached homeostasis at 4 weeks after birth. Luteinizing hormone, but not downstream sex hormones, was involved in regulating HSC homeostasis during this period. Expression of luteinizing hormone receptor (Lhcgr) is highly restricted in HSCs and multipotent progenitor cells in the hematopoietic hierarchy. When Lhcgr was deleted, HSCs continued to expand even after 4 weeks after birth, leading to abnormally elevated hematopoiesis and leukocytosis. In a murine acute myeloid leukemia model, leukemia development was significantly accelerated upon Lhcgr deletion. Together, our work reveals an extrinsic counting mechanism that restricts HSC expansion during development and is physiologically important for maintaining normal hematopoiesis and inhibiting leukemogenesis.
Keywords: hematopoiesis; hematopoietic stem cell; luteinizing hormone; luteinizing hormone receptor; puberty.
© 2018 The Authors.
Figures
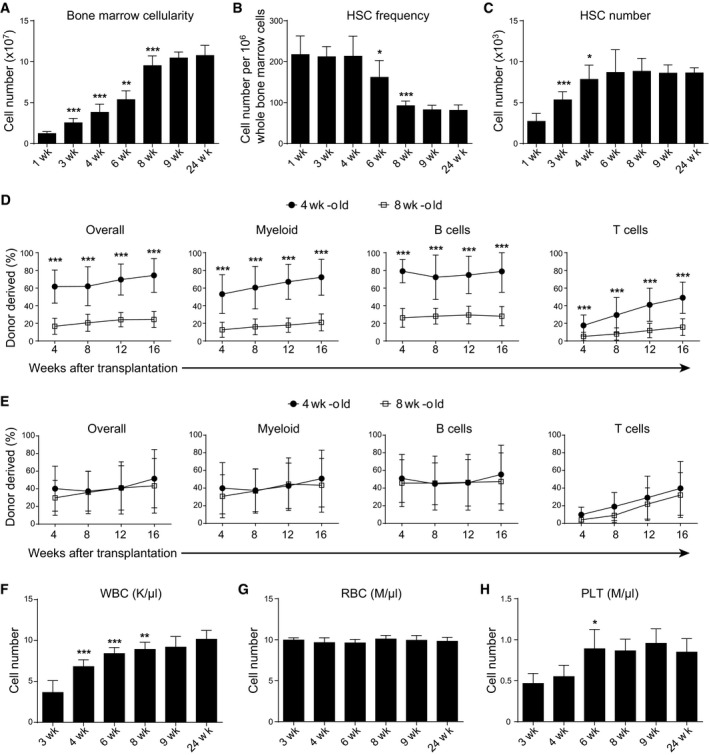
- A–C
The bone marrow cellularity (A), CD150+CD48−Lineage−Sca‐1+c‐kit+ HSC frequency (B), and number (C) in the bone marrow of wild‐type mice at indicated weeks after birth. All data reflected mean ± SD of two tibias plus two femurs (n = 6 mice/age from three independent experiments). Two‐tailed Student's t‐tests were used to assess the statistical significance of differences between consecutive ages (*P < 0.05, **P < 0.01, ***P < 0.001).
- D, E
Competitive reconstitution assay in which 300,000 of donor‐derived bone marrow cells (D) or 0.5% of donor‐derived bone marrow cells (E) from 4‐ or 8‐week‐old mice were transplanted along with 500,000 recipient‐type competitor cells into irradiated recipient mice (n = 11–12 recipient mice/genotype from three independent experiments). Data represented mean ± SD. The statistical significance of differences was assessed using two‐way ANOVAs (***P < 0.001).
- F–H
Peripheral white blood cell count (WBC, F), red blood cell count (RBC, G), and platelet count (PLT, H) of wild‐type mice at indicated weeks after birth. All data reflect mean ± SD (n = 5 mice/time point from three independent experiments). Two‐tailed Student's t‐tests were used to assess the statistical significance of differences between consecutive ages (*P < 0.05, **P < 0.01, ***P < 0.001).
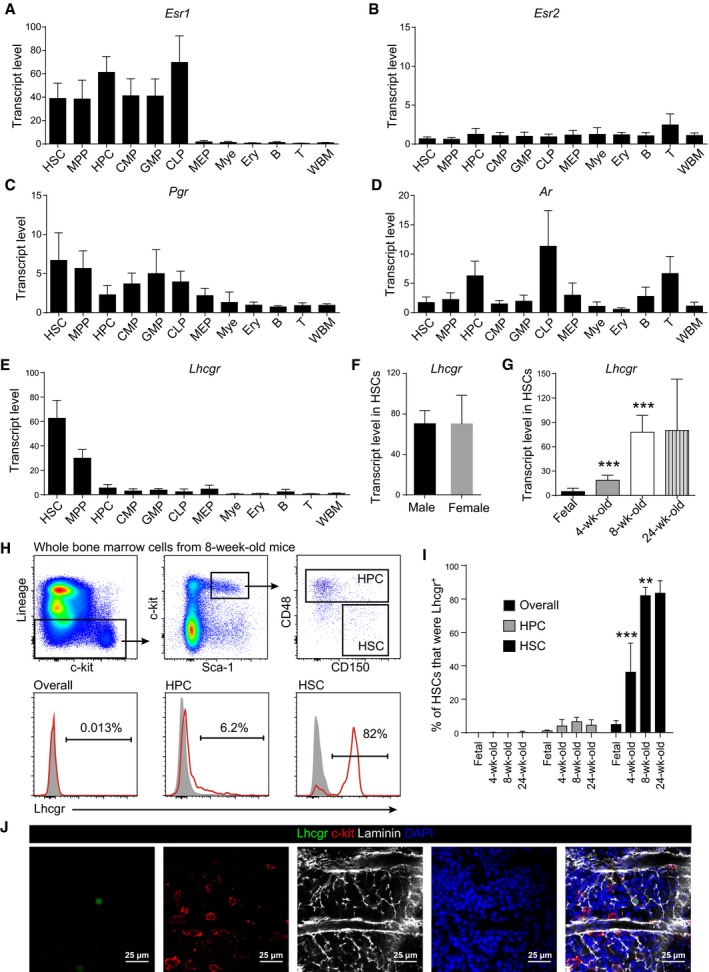
- A–D
Quantitative real‐time PCR analyses of the transcript levels (normalized to β‐actin) of Esr1 (A), Esr2 (B), Pgr (C), and Ar (D) in indicated cell populations relative to unfractionated whole bone marrow cells (WBM) in 8‐ to 12‐week‐old mice. The relative transcript level in WBM was set as 1. Data represent mean ± SD (n = 3 mice from three independent experiments).
- E–G
Quantitative real‐time PCR analysis of Lhcgr transcript level (normalized to β‐actin) relative to unfractionated whole bone marrow cells (WBM). Panel (E): different hematopoietic cell populations; panel (F): different sexes; panel (G): different ages. The relative transcript level in WBM was set as 1. Data represented mean ± SD (n = 6 mice from three independent experiments). Two‐tailed Student's t‐tests were used to assess the statistical significance of differences between consecutive ages (***P < 0.001).
- H, I
Flow cytometric analysis of Lhcgr expression in pre‐fixed and permeabilized bone marrow cells. Panel (H) shows the gating strategy for quantifying the percentages of Lhcgr+ cells in different cell populations. The gray peaks in the histograms in (H) were isotype controls. Panel (I) shows the quantification and statistical analysis results (n = 6 mice/age from three independent experiments). Data represented mean ± SD. Two‐tailed Student's t‐tests were used to assess the statistical significance of differences between consecutive ages (**P < 0.01, ***P < 0.001).
- J
Confocal imaging of femur sections stained with anti‐Lhcgr, anti‐c‐kit, and anti‐laminin antibodies (n = 3 mice from three independent experiments).
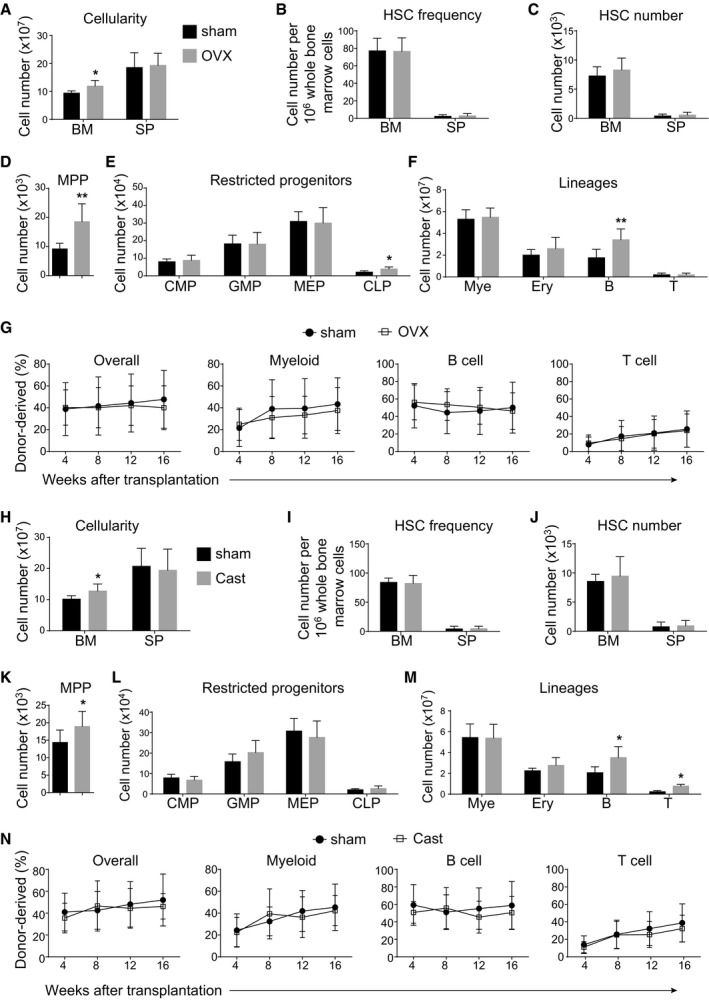
- A–F
Bone marrow cellularity (A), HSC frequency (B), and numbers of HSCs (C), MPPs (D), restricted progenitors (E) and hematopoietic lineages (F) in the bone marrow (BM, two tibias + two femurs) and spleen (SP) from female mice at 8 weeks after sham or ovariectomy surgery (OVX). All data reflected mean ± SD (n = 6 mice/treatment from three independent experiments). Two‐tailed Student's t‐tests were used to assess the statistical significance between ovariectomized and shammed groups (*P < 0.05, **P < 0.01).
- G
Competitive reconstitution assay in which 300,000 of donor‐derived bone marrow cells from female mice at 8 weeks after sham or ovariectomy surgery were transplanted along with 300,000 recipient‐type competitor cells into irradiated recipient mice (n = 12 recipient mice/genotype from three independent experiments). Data represented mean ± SD. The statistical significance of differences was assessed using two‐way ANOVAs.
- H–M
Bone marrow cellularity (H), HSC frequency (I), and numbers of HSCs (J), MPPs (K), restricted progenitors (L), and hematopoietic lineages (M) in the bone marrow (two tibias + two femurs) from male mice at 8 weeks after sham or castration surgery (Cast). All data reflected mean ± SD (n = 6 mice/treatment from three independent experiments). Two‐tailed Student's t‐tests were used to assess the statistical significance between castrated and shammed groups (*P < 0.05).
- N
Competitive reconstitution assay in which 300,000 of donor‐derived bone marrow cells from male mice at 8 weeks after sham or castration surgery were transplanted along with 300,000 recipient‐type competitor cells into irradiated recipient mice (n = 12 recipient mice/genotype from three independent experiments). Data represented mean ± SD. The statistical significance of differences was assessed using two‐way ANOVAs.
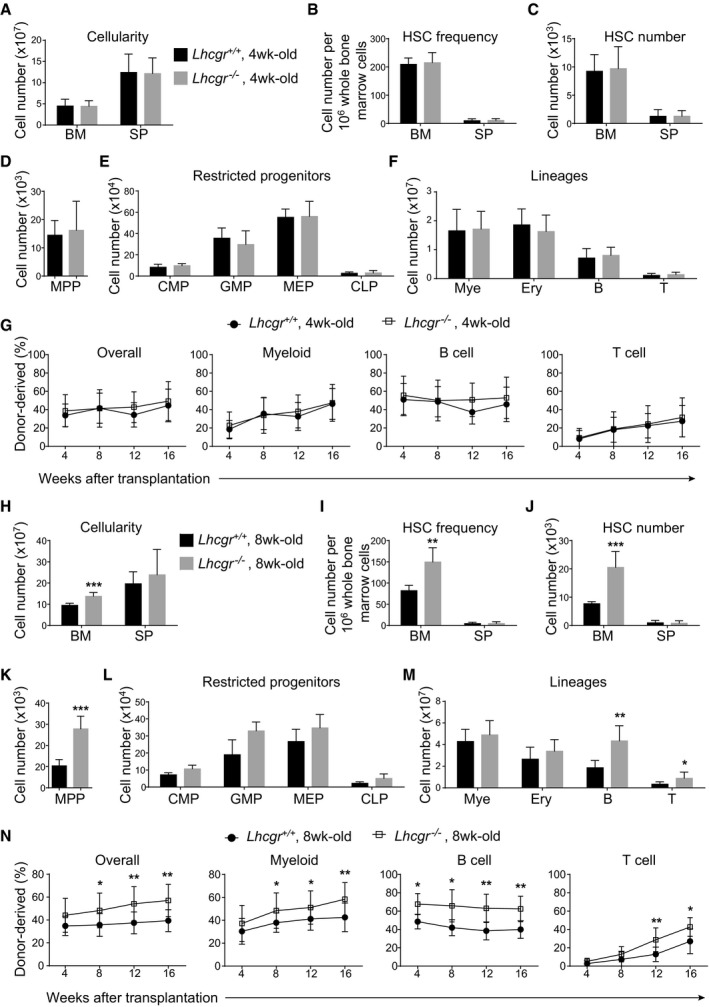
- A–F
Bone marrow cellularity (A), HSC frequency (B) and numbers of HSCs (C), MPPs (D), restricted progenitors (E), and hematopoietic lineages (F) in the bone marrow (two tibias + two femurs) from paired 4‐week‐old Lhcgr −/− and control mice. All data reflect mean ± SD (n = 6 mice/genotype from three independent experiments). Two‐tailed Student's t‐tests were used to assess the statistical significance between Lhcgr −/− and control mice.
- G
Competitive reconstitution assay in which 300,000 of donor‐derived bone marrow cells from 4‐week‐old Lhcgr −/− or control mice were transplanted along with 300,000 recipient‐type competitor cells into irradiated recipient mice (n = 12 recipient mice/genotype from three independent experiments). Data represented mean ± SD. The statistical significance of differences between Lhcgr −/− and control mice was assessed using two‐way ANOVAs.
- H–M
Bone marrow cellularity (H), HSC frequency (I) and numbers of HSCs (J), MPPs (K), restricted progenitors (L), and hematopoietic lineages (M) in the bone marrow (two tibias + two femurs) from paired 8‐week‐old Lhcgr −/− and control mice. Data from male and female mice did not significantly differ from each other and were therefore pooled together. All data reflected mean ± SD (n = 6 mice/genotype from three independent experiments). Two‐tailed Student's t‐tests were used to assess the statistical significance between Lhcgr −/− and control mice (*P < 0.05, **P < 0.01, ***P < 0.001).
- N
Competitive reconstitution assay in which 300,000 of donor bone marrow cells from 8‐week‐old Lhcgr −/− or control mice were transplanted along with 300,000 recipient‐type competitor cells into irradiated recipient mice (n = 12 recipient mice/genotype from three independent experiments). Data represented mean ± SD. The statistical significance of differences between Lhcgr −/− and control mice was assessed using two‐way ANOVAs (*P < 0.05, **P < 0.01).
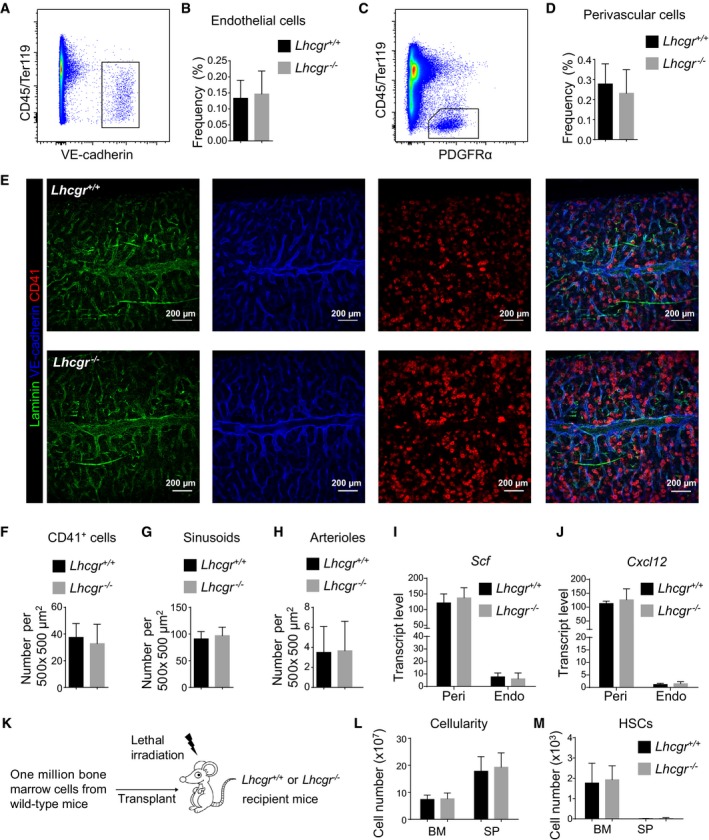
- A–D
Flow cytometric analyses showed that Lhcgr deletion did not alter the frequency of CD45/Ter119−VE‐cadherin+ endothelial cells (A,B) or CD45/Ter119−PDGFRα+ perivascular cells (C,D) in the bone marrow. Panels (A) and (C) show the gating strategies for analyzing endothelial cells and perivascular cells, respectively, by flow cytometry. Panels (B) and (D) show the quantification results for endothelial cells and perivascular cells, respectively (n = 6 mice from three independent experiments). Data represented mean ± SD. Two‐tailed Student's t‐tests were used to assess the statistical significance between Lhcgr −/− and control mice.
- E–H
Confocal imaging of thick bone marrow sections (50 μm) showed no significant changes to the frequencies of CD41+ megakaryocytes (F), VE‐cadherinbrightLaminindim sinusoids (G) or VE‐cadherindimLamininbright arterioles (H). Representative confocal images are shown in (E) (n = 6 mice/genotype from three independent experiments). Data represented mean ± SD. Two‐tailed Student's t‐tests were used to assess the statistical significance between Lhcgr −/− and control mice.
- I, J
Quantitative real‐time PCR analyses of the transcript levels (normalized to β‐actin) of Scf (I) and Cxcl12 (J) in perivascular cells (Peri) and endothelial cells (Endo). Data represented mean ± SD (n = 3 mice from three independent experiments). Two‐tailed Student's t‐tests were used to assess the statistical significance between Lhcgr −/− and control mice.
- K–M
Bone marrow and spleen cellularity (L) and HSC numbers in the bone marrow and spleen (M) from 12‐week‐old Lhcgr −/− and control mice at 4 weeks after lethal irradiation and transplantation with one million bone marrow cells from wild‐type mice. Transplantation was performed as depicted in (K) (n = 6 mice/genotype from three independent experiments). Data represented mean ± SD. Two‐tailed Student's t‐tests were used to assess the statistical significance between Lhcgr −/− and control mice.
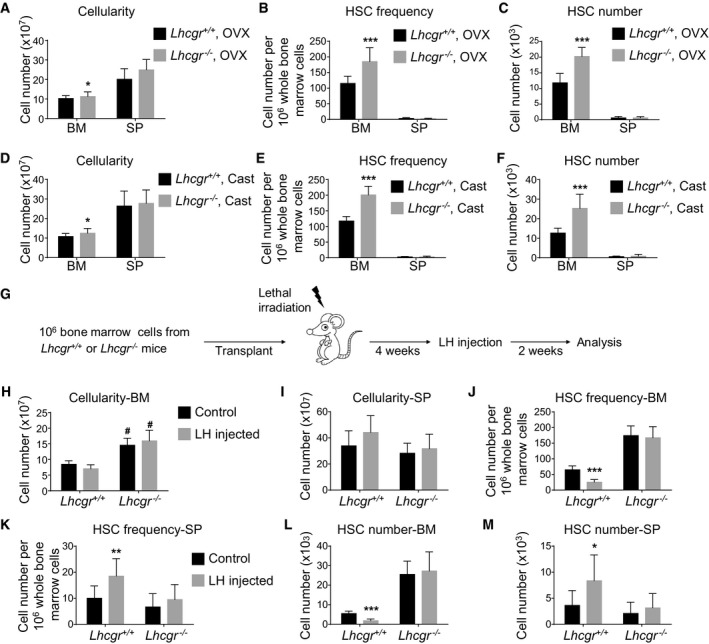
- A–C
Bone marrow cellularity (A), HSC frequency (B), and number (C) in the bone marrow from Lhcgr −/− and control mice at 8 weeks after ovariectomy (OVX) (n = 6 mice/genotype from three independent experiments). Data represented mean ± SD. Two‐tailed Student's t‐tests were used to assess the statistical significance between Lhcgr −/− and control mice (*P < 0.05, ***P < 0.001).
- D–F
Bone marrow cellularity (D), HSC frequency (E), and number (F) in the bone marrow from Lhcgr −/− and control mice at 8 weeks after castration (Cast) (n = 6 mice/genotype from three independent experiments). Data represented mean ± SD. Two‐tailed Student's t‐tests were used to assess the statistical significance between Lhcgr −/− and control mice (*P < 0.05, ***P < 0.001).
- G–M
Cellularity of bone marrow (H) and spleen (I), HSC frequencies in the bone marrow (J) and spleen (K), and HSC numbers in the bone marrow (L) and spleen (M) of wild‐type mice that had been lethally irradiated and transplanted with donor bone marrow cells from Lhcgr −/− or control mice. Transplantation and LH injection were performed as depicted in (G) (n = 6 mice/condition/genotype from three independent experiments). Data represented mean ± SD. Two‐tailed Student's t‐tests were used to assess the statistical significance. * represents difference between groups with and without LH injection; # represents difference between Lhcgr −/− and control mice (*P < 0.05, #P < 0.05, **P < 0.01, ***P < 0.001).
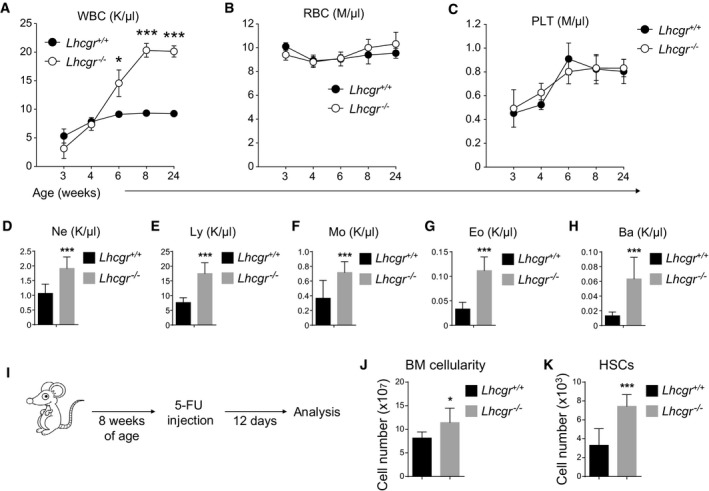
- A–C
Peripheral white blood cell count (WBC, A), red blood cell count (RBC, B), and platelet count (PLT, C) of Lhcgr −/− and control mice at indicated ages. All data reflected mean ± SD (n = 6 mice/age/genotype from three independent experiments). Two‐tailed Student's t‐tests were used to assess the statistical significance of differences between Lhcgr −/− and control mice (*P < 0.05, ***P < 0.001).
- D–H
Peripheral neutrophil (Ne, D), lymphocyte (Ly, E), monocyte (Mo, F), eosinophil (Eo, G), and basophil (Ba, H) counts of 8‐week‐old Lhcgr −/− and control mice. All data reflected mean ± SD (n = 6 mice/genotype from three independent experiments). Two‐tailed Student's t‐tests were used to assess the statistical significance of differences between Lhcgr −/− and control mice (***P < 0.001).
- I–K
Cellularity of bone marrow (J) and HSC numbers in the bone marrow (K) of Lhcgr −/− and control mice that had been treated with one dose of 5‐FU 12 days before. 5‐FU treatment was performed as described in (I) (n = 6 mice/genotype from three independent experiments). Data represented mean ± SD. Two‐tailed Student's t‐tests were used to assess the statistical significance between Lhcgr −/− and control mice (*P < 0.05, ***P < 0.001).
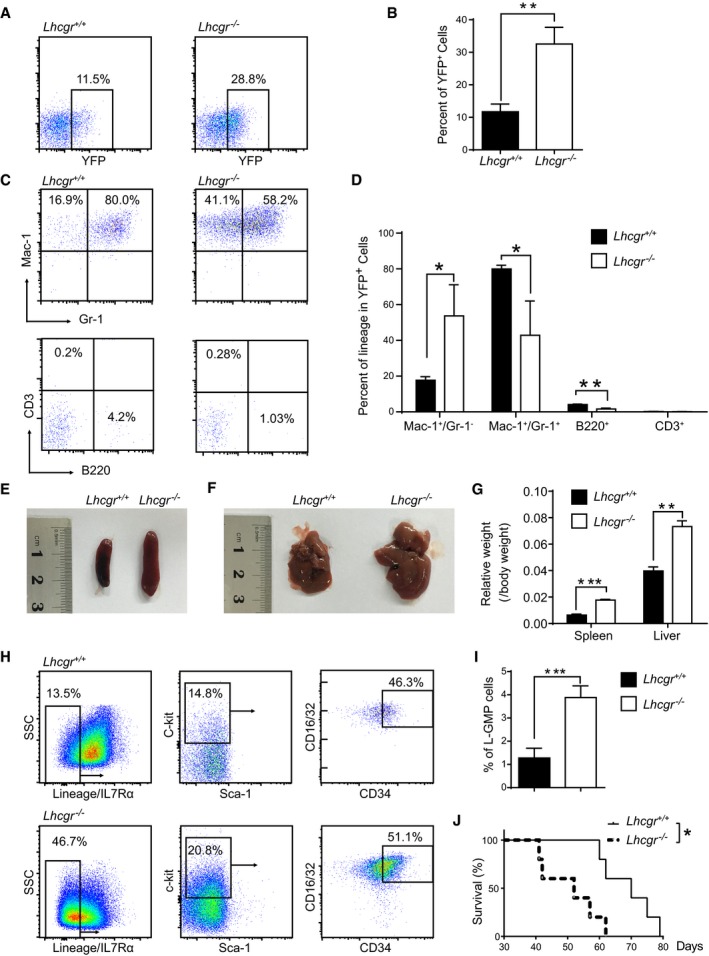
- A
Representative plots of YFP+ leukemia cells in peripheral blood of primary recipients transplanted with MLL‐AF9‐induced Lineage− hematopoietic stem/progenitor cells from Lhcgr −/− and control mice.
- B
Quantification data in panel (A) (n = 5 mice from three independent experiments).
- C
Representative plots of Mac‐1/Gr‐1 (marker of myeloid cells) and CD3/B220 (marker of lymphoid cells) in the peripheral blood of primary leukemic recipients.
- D
Quantification results in panel (C) (n = 5 mice from three independent experiments).
- E, F
Representative images of spleens (E) and livers (F) of the primary leukemic recipients.
- G
Quantification results of relative weight of spleens and livers in panels (E, F) (n = 5 mice from three independent experiments).
- H
Representative plots of Lineage−IL7Rα−Sca‐1−c‐kit+ CD34+ CD16/32+L‐GMP cells in the bone marrow of primary leukemic recipients.
- I
Quantification of the percentages of L‐GMP cells in panel (G) (n = 5 mice from three independent experiments).
- J
Survival data for recipient mice receiving MLL‐AF9‐induced control and Lhcgr‐null hematopoietic stem/progenitor cells upon primary transplantation (n = 5 Lhcgr −/− and control).
References
-
- Akashi K, Traver D, Miyamoto T, Weissman IL (2000) A clonogenic common myeloid progenitor that gives rise to all myeloid lineages. Nature 404: 193–197 - PubMed
Publication types
MeSH terms
Substances
LinkOut - more resources
Full Text Sources
Other Literature Sources
Medical
