. 2018 Aug 29;38(35):7622-7634.
doi: 10.1523/JNEUROSCI.0586-18.2018. Epub 2018 Jul 23.

A Closely Associated Phospholipase C Regulates Cation Channel Function through Phosphoinositide Hydrolysis

Affiliations

A Closely Associated Phospholipase C Regulates Cation Channel Function through Phosphoinositide Hydrolysis

Raymond M Sturgeon et al. J Neurosci. .

Abstract

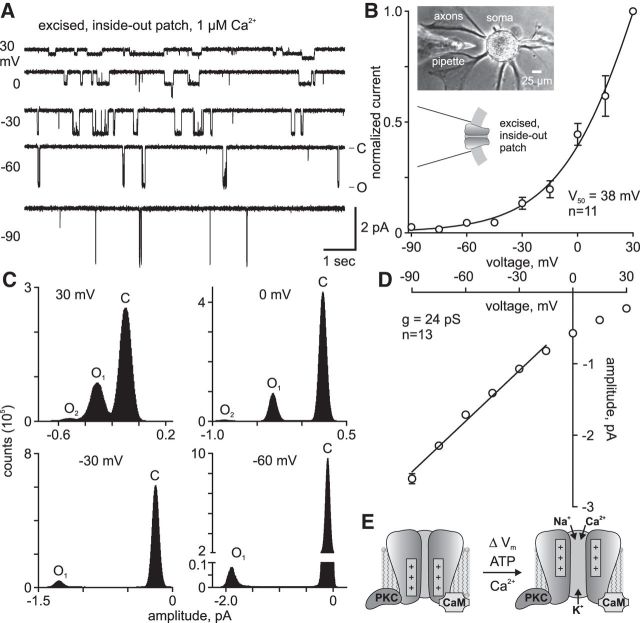
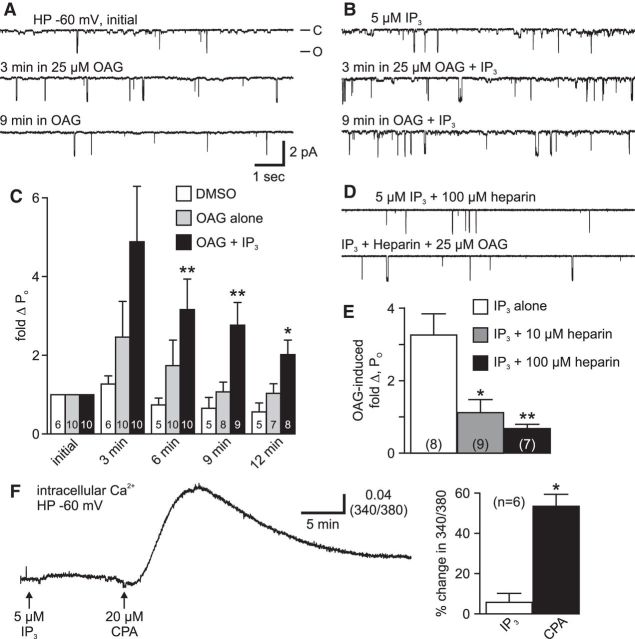
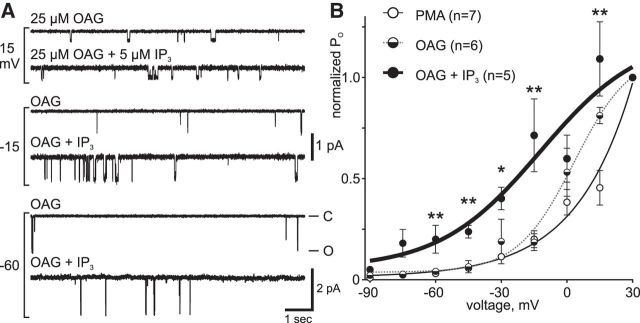
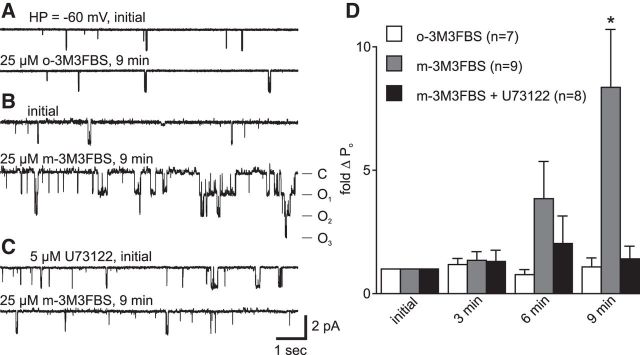
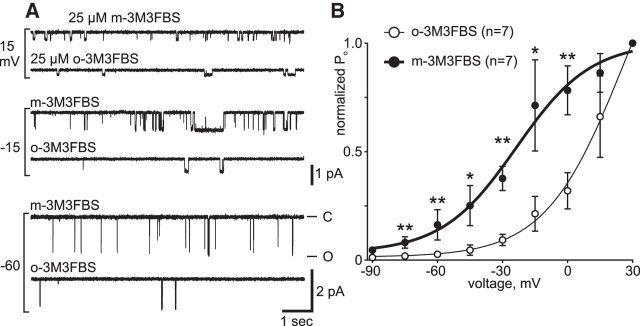
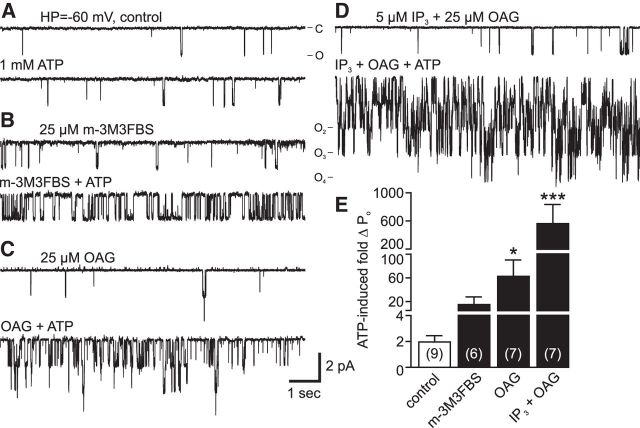
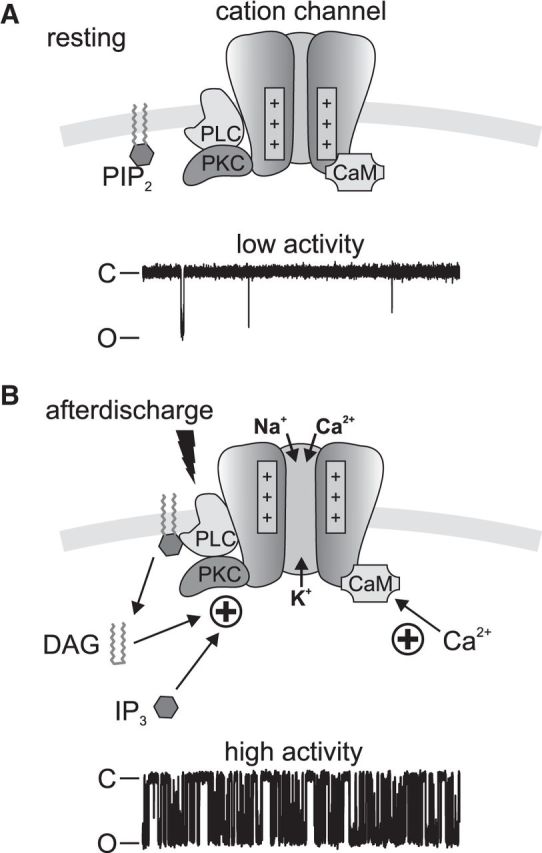
In the hemaphroditic sea snail, Aplysia californica, reproduction is initiated when the bag cell neurons secrete egg-laying hormone during a protracted afterdischarge. A source of depolarization for the afterdischarge is a voltage-gated, nonselective cation channel, similar to transient receptor potential (TRP) channels. Once the afterdischarge is triggered, phospholipase C (PLC) is activated to hydrolyze phosphatidylinositol-4,5-bisphosphate (PIP2) into diacylglycerol (DAG) and inositol trisphosphate (IP3). We previously reported that a DAG analog, 1-oleoyl-2-acetyl-sn-glycerol (OAG), activates a prominent, inward whole-cell cationic current that is enhanced by IP3 To examine the underlying mechanism, we investigated the effect of exogenous OAG and IP3, as well as PLC activation, on cation channel activity and voltage dependence in excised, inside-out patches from cultured bag cell neurons. OAG transiently elevated channel open probability (PO) when applied to excised patches; however, coapplication of IP3 prolonged the OAG-induced response. In patches exposed to OAG and IP3, channel voltage dependence was left-shifted; this was also observed with OAG, but not to the same extent. Introducing the PLC activator, m-3M3FBS, to patches increased channel PO, suggesting PLC may be physically linked to the channels. Accordingly, blocking PLC with U-73122 ablated the m-3M3FBS-induced elevation in PO Treatment with m-3M3FBS left-shifted cation channel voltage dependence to a greater extent than exogenous OAG and IP3 Finally, OAG and IP3 potentiated the stimulatory effect of PKC, which is also associated with the channel. Thus, the PLC-PKC signaling system is physically localized such that PIP2 breakdown products liberated during the afterdischarge modulate the cation channel and temporally influence neuronal activity.SIGNIFICANCE STATEMENT Using excised patches from Aplysia bag cell neurons, we present the first evidence of a nonselective cation channel physically associating with phospholipase C (PLC) at the single-channel level. PLC-mediated breakdown of phospholipids generates diacylglycerol and inositol trisphosphate, which activate the cation channel. This is mimicked by exogenous lipids; furthermore, these second messengers left-shift channel voltage dependence and enhance the response of the channel to protein kinase C. PLC-mediated lipid signaling controls single-channel currents to ensure depolarization is maintained for an extended period of firing, termed the afterdischarge, when the bag cell neurons secrete egg-laying hormone to trigger reproduction.

Keywords: afterdischarge; diacylglycerol; inositol trisphosphate; mollusk; neuroendocrine cell; voltage dependence.


Figures

Figure 1.
Figure 1.
A voltage-dependent cation channel from cultured Aplysia bag cell neurons. A, Cation channel activity in an excised, inside-out patch, voltage-clamped at indicated membrane potentials (left) with Na+-based nASW plus 20 mm tetraethylammonium at the extracellular face and a K+-aspartate-based intracellular saline with 1 μm Ca2+ at the cytoplasmic face. The closed state is at the top of each trace, indicated by −C, and the open-state, designated by −O, is at the bottom (at right of −60 trace). Openings are seen as unitary inward (negative) current deflections. As the patch is depolarized from −90 (bottom trace) to 30 mV (top trace), the channel opens more often, and more time is spent in the open state and less time in the closed state. Scale bars apply to all traces. B, Voltage dependence of cation channel PO expressed by normalizing activity within each experiment to the PO at 30 mV. A half-maximal voltage of activation (V50) of 38 mV and a k of 23 are determined from a Boltzmann sigmoidal curve fit to the data. The n value refers to the number of patches. Inset, Phase-contrast micrograph of a bag cell neuron in vitro (top). The pipette is coated with dental wax to reduce noise. After seal formation, the pipette is excised from the soma and current is recorded across the patch at the tip. Schematic of a cation channel in a membrane patch (bottom). C, All-points histograms of recordings in A represent current flow during channel closed (C) and open (O1 or O2) states at different voltages. Gaussian fits to these peaks are used to determine channel amplitude plotted in D. D, Single-channel I/V relationship shows subtle rectification at potentials >0 mV. A conductance (g) of 24 pS is derived from a linear fit of −90 to −15 mV; this represents the physiological range of the channel and avoids the region of rectification. E, The cation channel is part of a regulatory complex that includes PKC and calmodulin (CaM). The voltage-sensing domains open the channel in response to depolarization (ΔVm), whereas PKC-dependent phosphorylation and CaM binding intracellular Ca2+ activate the channel, allowing Na+ and Ca2+ to enter the cell and K+ to leave during the afterdischarge.
Figure 2.
Figure 2.
Kinetic analysis of true single channels shows that the cation channel stays open longer and favors reopening with depolarization. A, Closed-state (left column) and open-state (right column) dwell times at 30, 0, and −30 mV from a one-channel-only single-channel recording are plotted as histograms. Each histogram is best fit with a probability density function (three closed-state time constants: τC1, τC2, and τC3; two open-state time constants: τO1 and τO2). The longest closed-state time constant decreases with depolarization (−30: 8.83 ± 6.7 s vs 30: 3.3 ± 2.5 s), whereas the longer open-state time constant subtly increases in duration (−30: 23.7 ± 4.6 ms vs 30: 44.6 ± 18.8 ms). B, The duration of the longest closed-state time constant, τC3, decreases linearly with depolarization (left). Data for τC3 are normalized to −60 mV, at which τC3 is the longest. Similarly, the length of τO2 increases linearly with depolarization. Data are normalized to 30 mV, at which τO2 is the longest.
Figure 3.
Figure 3.
A diacylglycerol analog transiently activates the cation channel, and this is prolonged by IP3. A, Application of 25 μm OAG, a diacylglycerol analog, to the cytoplasmic face of a cation channel-containing patch held at −60 mV increases activity for the 3 min following addition (middle) compared with the initial recording (top). Nine minutes after the addition, the PO has returned to the initial level (bottom). Scale bars apply to all traces in A, B, and D. B, Excising patches into intracellular saline containing 5 μm IP3, and then delivering OAG, increases the extent and duration of the OAG-induced elevation of cation channel activity. Before OAG addition, channel activity is minimal (top). Application of OAG to patches in the presence of IP3 increases PO (middle), and this effect is prolonged (bottom). C, Summary data show that the PO goes up following addition of OAG (gray bars), compared with delivery of DMSO (white). In patches excised into IP3 (black), the OAG-induced change in PO is almost twofold higher than untreated cells. The increased PO is significantly longer in IP3-treated patches than in untreated cells (6 min: p = 0.0082; 9 min: p = 0.0019; 12 min: p = 0.0171, KW-ANOVA). **p < 0.01 (Dunn's multiple-comparisons test). *p < 0.05 (Dunn's multiple-comparisons test). For this and all subsequent bar graphs, the numbers within the bars refer to the number of patches. In this instance, certain n values change starting at the 6 or 9 min bin due to some patches not lasting the full 12 min recording period. D, The synergy between OAG and IP3 is blocked by heparin. For an inside-out patch excised into 100 μm heparin, an IP3-receptor blocker, plus IP3, the subsequent application of OAG does not alter PO (bottom) compared with the initial activity (top). E, Summary data of the OAG-induced change in cation channel PO show that 10 μm (gray bars) or 100 μm heparin (black bars) prevents the activity increase induced by OAG in IP3 compared with IP3 alone (white) (p = 0.0010, KW-ANOVA). *p < 0.05 (Dunn's multiple-comparisons test). **p < 0.01 (Dunn's multiple-comparisons test). F, Left, Intracellular Ca2+ measured from the soma of a cultured bag cell neuron in nASW under whole-cell voltage-clamp at −60 mV using K+-aspartate-based intracellular saline supplemented with 1 mm fura. Bath application of 5 μm IP3 has no real impact on Ca2+, yet introducing 20 μm CPA later on causes a clear Ca2+ elevation reflective of store depletion. Right, The average response to IP3 is not significantly different from a theoretical mean of zero (p > 0.05; one-sample t test), whereas the difference between the mean Ca2+ change to CPA versus IP3 readily meets significance (*p < 0.0001; unpaired Student's t test).
Figure 4.
Figure 4.
The voltage dependence of the cation channel is left-shifted by OAG and IP3. A, Cation channel activity in excised, inside-out patches exposed to 25 μm OAG alone (top traces at each voltage) or excised into 5 μm IP3 followed by OAG (bottom traces) and held at the potentials indicated on the left. Compared with OAG alone, the PO of the channel is higher in the presence of OAG + IP3, particularly at −60 and −15 mV. Ordinate at bottom right applies to −60 mV, whereas that beside the −15 mV trace applies to −15 and 15 mV; abscissa applies to all traces. B, Voltage dependence of cation channel PO in OAG (half-filled circles), OAG and IP3 (filled circles), or PMA (open circles). A Boltzmann curve fit to the PO activity normalized to 30 mV in OAG + IP3 (thick black) is left-shifted (V50 = −12 mV, k = 23) compared with OAG (dotted gray) (V50 = −3 mV, k = 13) and PMA (thin black) curves. The PMA curve is similar to naive channels (compare with Fig. 1D) and is shown here as a control. OAG with IP3 results in a larger left-shift in the voltage dependence than OAG alone (−90 mV: p > 0.05, KW-ANOVA; −75 mV: p > 0.05, KW-ANOVA; −60 mV: **p = 0.0046, KW-ANOVA with p < 0.05 for PMA vs OAG + IP3 and OAG vs OAG + IP3; −45 mV: **p = 0.0087, KW-ANOVA with p < 0.05 PMA vs OAG + IP3 and OAG vs OAG + IP3; −30 mV: *p = 0.0154, KW-ANOVA with p < 0.05 PMA vs OAG + IP3 and OAG vs OAG + IP3; −15 mV: **p = 0.0046, KW-ANOVA with p < 0.05 PMA vs OAG + IP3 and OAG vs OAG + IP3; 0 mV: p > 0.05, KW-ANOVA; 15 mV: **p = 0.0048, KW-ANOVA with p < 0.05 PMA vs OAG + IP3; all post hoc tests Dunn's multiple-comparisons).
Figure 5.
Figure 5.
A PLC activator increases cation channel activity in excised, inside-out patches. A, Addition of 25 μm o-3M3FBS (bottom), an inactive control molecule, to the cytoplasmic face of a patch held at −60 mV, results in no change in PO from the initial level (top). B, In a separate patch from a different neuron, applying 25 μm m-3M3FBS, a PLC activator, increases channel activity (bottom trace) compared with the initial period (top). C, In a patch excised from a neuron treated with 5 μm of the PLC inhibitor, U-73122, delivery of m-3M3FBS has no effect on PO. Scale bars apply to all traces in A–C. D, Summary data show that application of m-3M3FBS to excised patches increases channel activity over the course of ∼6 min and reaches a peak by ∼9 min (gray bars), and this effect can be blocked by U-73122 treatment before patch excision (black). Adding the inactive form, o-3M3FBS, has no effect on channel activity (white) (p = 0.0083, KW-ANOVA). *p < 0.05 (Dunn's multiple-comparisons test).
Figure 6.
Figure 6.
PLC activation left-shifts the voltage dependence of the cation channel. A, Cation channel activity increases as holding potentials are depolarized from −60 (bottom) to 15 mV (top) when excised from cells treated with 25 μm of either the active (m-3M3FBS) or inactive (o-3M3FBS) form the PLC activator. However, at both −60 and −15 mV (middle), channel PO is higher with the active m-3M3FBS. Ordinate at bottom right applies to −60 mV, whereas that beside the −15 mV trace applies to −15 and 15 mV; abscissa applies to all traces. B, Exposure to 25 μm m-3M3FBS (filled circles) results in a left-shifted voltage dependence compared with the inactive o-3M3FBS (open circles). A Boltzmann curve fit to the PO activity normalized to 30 mV in m-3M3FBS (thick black) is left-shifted (V50 = −24 mV, k = 17) compared with the o-3M3FBS (thin black) curve (V50 = 26 mV, k = 18) (−90: p > 0.05; −75 mV: **p = 0.0095; −60 mV: **p = 0.0087; −45 mV: *p = 0.0260; −30 mV: **p = 0.0012; −15 mV: *p = 0.0350; 0 mV: **p = 0.007; 15 mV: p > 0.05; all Mann–Whitney unpaired U test).
Figure 7.
Figure 7.
PKC-induced cation channel activation is increased following addition of PLC breakdown products. A, Addition of 1 mm ATP to the cytoplasmic face of a cation channel held at −60 mV in an excised, inside-out patch increases PO ∼2-fold (bottom trace) compared with initial activity (top). Prior work shows that this is due to PKC-mediated phosphorylation (i.e., it is sensitive to PKC inhibition and reversed by protein phosphatases) (Wilson et al., 1998). B, Following treatment of an intact bag cell neuron with 25 μm m-3M3FBS, a cation channel-containing patch is excised (top). Delivery of ATP to this patch provokes a marked PO increase (bottom). C, Moreover, in a different patch, after exposure to 25 μm OAG (top trace), introducing ATP results in an even larger elevation in channel activity. Scale bars apply to all traces in A–D. D, When excised into 5 μm IP3 followed by 25 μm OAG (top), the response to ATP is a very substantial increase in PO (bottom). E, Summary data of excised patches show that, compared with pre-ATP, after addition of OAG, with or without IP3, ATP significantly increases channel activity in these patches. This PO change is far greater when both OAG and IP3 are present versus OAG alone (p < 0.0001, KW ANOVA). *p < 0.05 (Dunn's multiple-comparisons test). ***p < 0.001 (Dunn's multiple-comparisons test).
Figure 8.
Figure 8.
Schematic representation of the Aplysia cation channel regulatory complex in the bag cell neuron plasma membrane. A, The cation channel is found with closely associated PKC (Wilson et al., 1998), CaM (Lupinsky and Magoski, 2006), and PLC. At rest, the voltage sensors are located closer to the inner leaflet. PIP2 is located in the plasma membrane. A representative single-channel recording from the channel in an excised patch held at −60 mV indicates that the channel is predominantly in the closed (C) state, with few transitions to the open (O) state. B, In response to the afterdischarge, PLC is activated (lightning bolt) and PIP2 is hydrolyzed to DAG and IP3. The combined liberation of DAG and IP3, along with PKC-dependent phosphorylation and Ca2+/CaM, gates the channel in a positive manner. The bag cell neuron membrane also depolarizes, resulting in further channel activation and cation influx. Given these regulatory elements, channel activity increases dramatically, as evidenced by the representative single-channel recording.

References

    1. Albert AP, Large WA (2003) Synergism between inositol phosphates and diacylglycerol on native TRPC6-like channels in rabbit portal vein myocytes. J Physiol 552:789–795. 10.1113/jphysiol.2003.052977 - DOI - PMC - PubMed
    1. Allen JA, Halverson-Tamboli RA, Rasenick MM (2007) Lipid raft microdomains and neurotransmitter signalling. Nat Rev Neurosci 8:128–140. 10.1038/nrn2059 - DOI - PubMed
    1. Bae YS, Lee TG, Park JC, Hur JH, Kim Y, Heo K, Kwak JY, Suh PG, Ryu SH (2003) Identification of a compound that directly stimulates phospholipase C activity. Mol Pharmacol 63:1043–1050. 10.1124/mol.63.5.1043 - DOI - PubMed
    1. Berridge MJ. (2009) Inositol trisphosphate and calcium signalling mechanisms. Biochim Biophys Acta 1793:933–940. 10.1016/j.bbamcr.2008.10.005 - DOI - PubMed
    1. Bleasdale JE, Thakur NR, Gremban RS, Bundy GL, Fitzpatrick FA, Smith RJ, Bunting S (1990) Selective inhibition of receptor-coupled phospholipase C-dependent processes in human platelets and polymorphonuclear neutrophils. J Pharmacol Exp Ther 255:756–768. - PubMed

Publication types

MeSH terms

Grants and funding

LinkOut - more resources