Review
. 2019 May 1;11(5):a032698.
doi: 10.1101/cshperspect.a032698.

Ribosome Profiling: Global Views of Translation

Affiliations
Review

Ribosome Profiling: Global Views of Translation

Nicholas T Ingolia et al. Cold Spring Harb Perspect Biol. .

Abstract

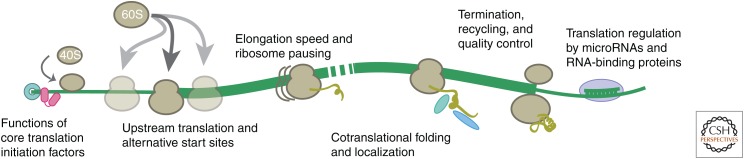
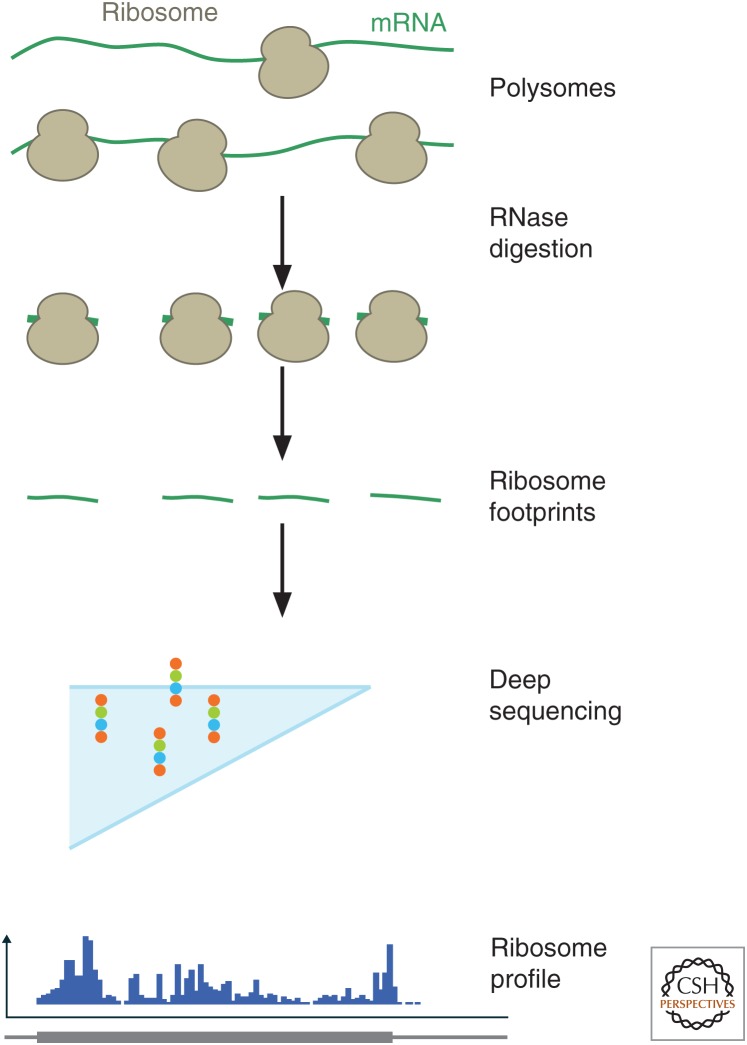
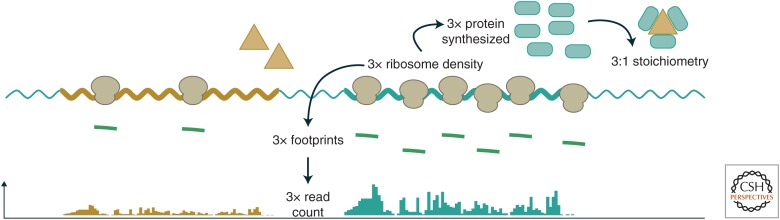
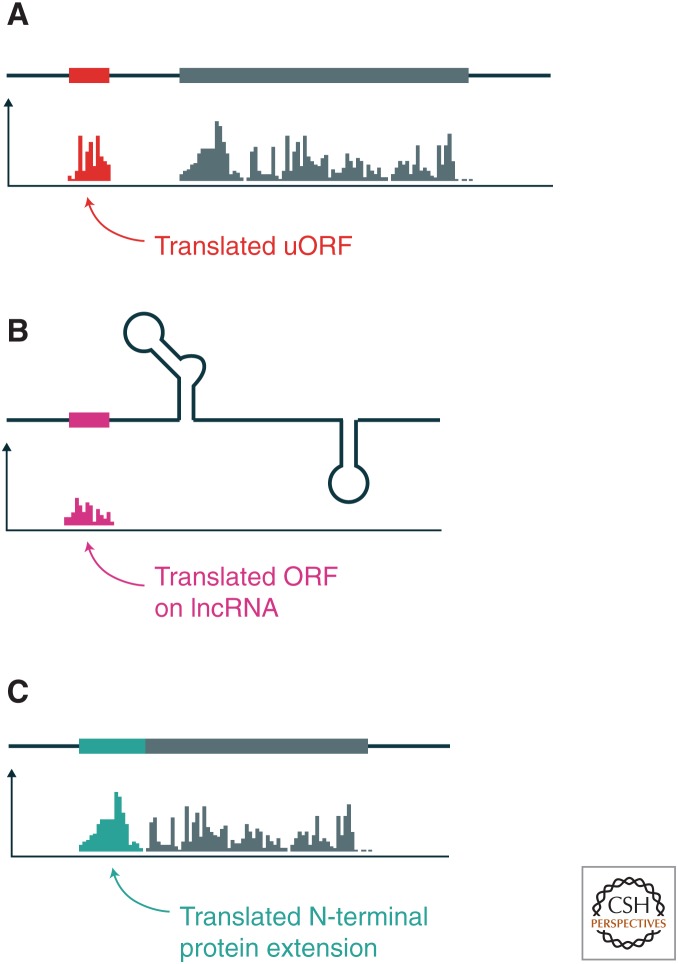
The translation of messenger RNA (mRNA) into protein and the folding of the resulting protein into an active form are prerequisites for virtually every cellular process and represent the single largest investment of energy by cells. Ribosome profiling-based approaches have revolutionized our ability to monitor every step of protein synthesis in vivo, allowing one to measure the rate of protein synthesis across the proteome, annotate the protein coding capacity of genomes, monitor localized protein synthesis, and explore cotranslational folding and targeting. The rich and quantitative nature of ribosome profiling data provides an unprecedented opportunity to explore and model complex cellular processes. New analytical techniques and improved experimental protocols will provide a deeper understanding of the factors controlling translation speed and its impact on protein function and cell physiology as well as the role of ribosomal RNA and mRNA modifications in regulating translation.


Figures

Figure 1.
Figure 1.
Insights from ribosome profiling. Ribosome profiling experiments have addressed many aspects of the mechanisms of protein synthesis and its regulation in the cell as well as related, cotranslational processes.
Figure 2.
Figure 2.
Ribosome footprint profiling. Steps in a typical ribosome profiling experiment are shown. Polysomes reflecting in vivo translation are isolated from cells and subjected to RNase digestion, which degrades unprotected messenger RNA (mRNA). The ribosome-protected footprints are analyzed by deep sequencing, schematized by the flowcell (light blue) with clusters of fluorescently labeled DNA attached to it (colored dots). Aligning these footprint sequences back to the transcriptome produces a quantitative profile of ribosome occupancy.
Figure 3.
Figure 3.
Quantifying protein synthesis. The number of ribosomes translating a reading frame determines the number of footprints generated in a profiling experiment, and so counting the footprint sequences derived from a reading frame indicates the amount of the encoded protein that is being synthesized. An exemplary polycistronic bacterial transcript is shown, with two open reading frames ([ORFs] A and B) encoding a pair of proteins that assemble with a 1:3 stoichiometric ratio. To achieve this stoichiometry, ORF B is translated threefold more heavily than ORF A, leading to threefold higher ribosome density and threefold more ribosome footprints.
Figure 4.
Figure 4.
Annotating the proteome with ribosome profiling. The figure diagrams mRNAs (top) showing the frequency of ribosome footprints along them (below). (A) Ribosome footprint sequences mapping to the 5′ leader of a transcript indicates the translation of an upstream open reading frame (uORF, red segment) and downstream ORF (gray segment). (B) Likewise, ribosome footprint sequences on a noncoding RNA indicate the presence of a translated region, typically near the 5′ end of the transcript. (C) Alternative protein isoforms translated in addition to or in place of annotated reading frames also appear in ribosome profiling data.
Figure 5.
Figure 5.
Inferring elongation speed from variations in ribosome footprint density. The lower part of the figure reports the frequency of ribosomal footprints along the mRNA. Regions of slow elongation will accumulate higher ribosome occupancy than regions of faster elongation on the same transcript. These differences in ribosome density are visible in profiling data, and they can be used to infer how codon usage, peptide sequence, and other features control the speed of translation.

References

    1. Alain T, Morita M, Fonseca BD, Yanagiya A, Siddiqui N, Bhat M, Zammit D, Marcus V, Metrakos P, Voyer LA, et al. 2012. eIF4E/4E-BP ratio predicts the efficacy of mTOR targeted therapies. Cancer Res 72: 6468–6476. - PubMed
    1. Albert FW, Muzzey D, Weissman JS, Kruglyak L. 2014. Genetic influences on translation in yeast. PLoS Genet 10: e1004692. - PMC - PubMed
    1. Alvarez-Dominguez JR, Zhang X, Hu W. 2017. Widespread and dynamic translational control of red blood cell development. Blood 129: 619–629. - PMC - PubMed
    1. Anderson DM, Anderson KM, Chang CL, Makarewich CA, Nelson BR, McAnally JR, Kasaragod P, Shelton JM, Liou J, Bassel-Duby R, et al. 2015. A micropeptide encoded by a putative long noncoding RNA regulates muscle performance. Cell 160: 595–606. - PMC - PubMed
    1. Andreev DE, O’Connor PB, Fahey C, Kenny EM, Terenin IM, Dmitriev SE, Cormican P, Morris DW, Shatsky IN, Baranov PV. 2015. Translation of 5′ leaders is pervasive in genes resistant to eIF2 repression. eLife 4: e03971. - PMC - PubMed

Publication types