. 2018 Aug 7;115(32):E7605-E7614.
doi: 10.1073/pnas.1714684115. Epub 2018 Jul 23.

Top-down, contextual entrainment of neuronal oscillations in the auditory thalamocortical circuit

Affiliations

Top-down, contextual entrainment of neuronal oscillations in the auditory thalamocortical circuit

Annamaria Barczak et al. Proc Natl Acad Sci U S A. .

Abstract

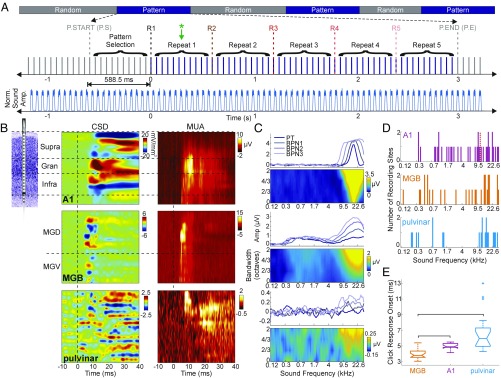
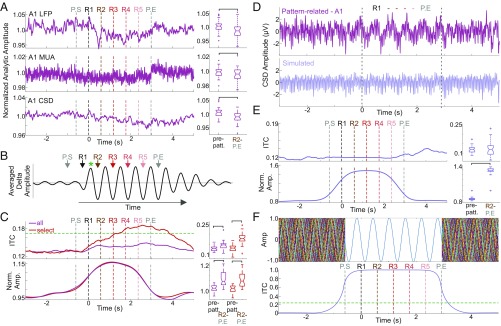
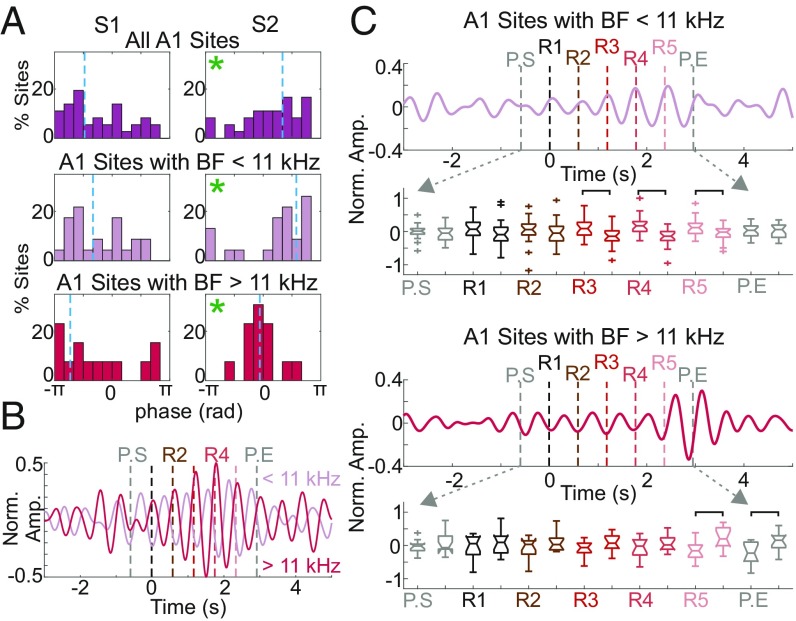
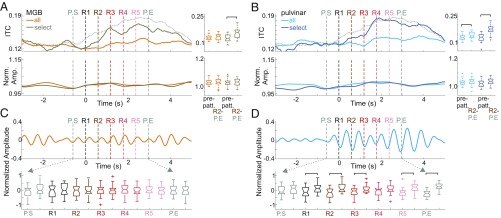
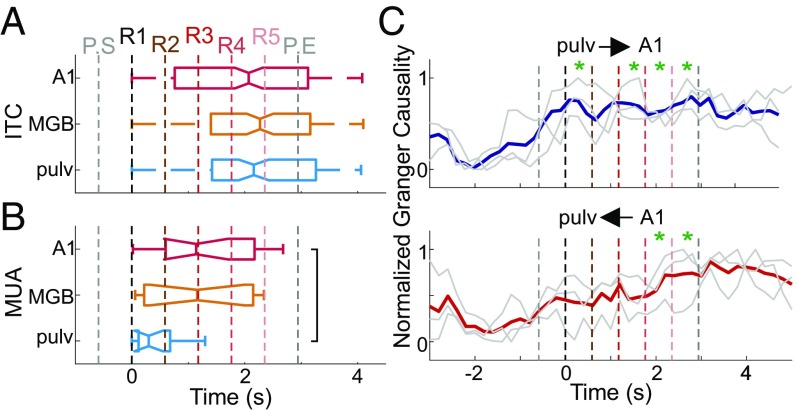
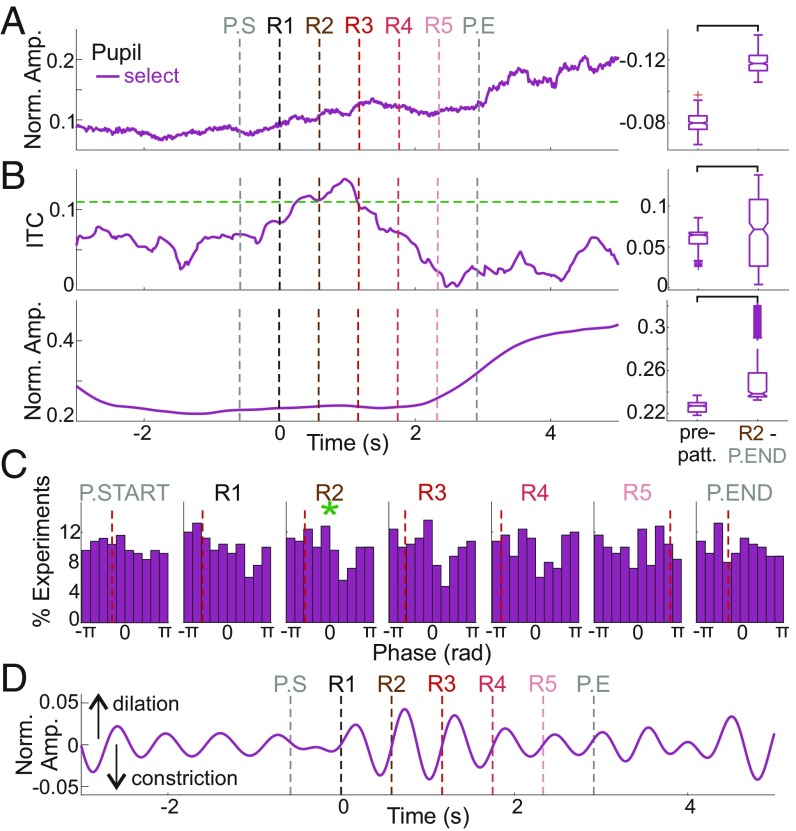
Prior studies have shown that repetitive presentation of acoustic stimuli results in an alignment of ongoing neuronal oscillations to the sequence rhythm via oscillatory entrainment by external cues. Our study aimed to explore the neural correlates of the perceptual parsing and grouping of complex repeating auditory patterns that occur based solely on statistical regularities, or context. Human psychophysical studies suggest that the recognition of novel auditory patterns amid a continuous auditory stimulus sequence occurs automatically halfway through the first repetition. We hypothesized that once repeating patterns were detected by the brain, internal rhythms would become entrained, demarcating the temporal structure of these repetitions despite lacking external cues defining pattern on- or offsets. To examine the neural correlates of pattern perception, neuroelectric activity of primary auditory cortex (A1) and thalamic nuclei was recorded while nonhuman primates passively listened to streams of rapidly presented pure tones and bandpass noise bursts. At arbitrary intervals, random acoustic patterns composed of 11 stimuli were repeated five times without any perturbance of the constant stimulus flow. We found significant delta entrainment by these patterns in the A1, medial geniculate body, and medial pulvinar. In A1 and pulvinar, we observed a statistically significant, pattern structure-aligned modulation of neuronal firing that occurred earliest in the pulvinar, supporting the idea that grouping and detecting complex auditory patterns is a top-down, context-driven process. Besides electrophysiological measures, a pattern-related modulation of pupil diameter verified that, like humans, nonhuman primates consciously detect complex repetitive patterns that lack physical boundaries.

Keywords: auditory patterns; auditory perception; macaque; oscillations; rhythms.


Conflict of interest statement

The authors declare no conflict of interest.

Figures

Fig. 1.
Fig. 1.
Auditory paradigm and functional properties of cortical and thalamic areas. (A, Upper) Pattern-repetition paradigm. The start of the first repetition (R1) is the point at which the pattern becomes theoretically detectable, termed “effective transition” (9), and is designated “0” in all pattern-related plots. (Lower) The blue trace is the average analytic amplitude of sounds for 50 patterns from one experiment illustrating that patterns have no physical, acoustically detectable boundaries. (B) Schematic of a linear array multielectrode (Left) and representative CSD (Center) and MUA (Right) profiles for recordings in the A1 (Top), MGB (Middle), and pulvinar (Bottom). Transmembrane currents (sinks and sources) in CSD color maps are color-coded red and blue, respectively. Black horizontal dashed lines mark the boundaries of the supragranular, granular, and infragranular layers in the A1 and the approximate border between the dorsal and ventral portions of the MGB. (C) Tuning properties of representative A1 (Top), MGB (Middle), and pulvinar (Bottom) recording sites. In each pair the traces show frequency tuning based on averaged MUA responses for pure tones and different bandwidth tone groups. The color maps show the same frequency tuning but with averaged MUA response amplitudes color-coded and mapped on the frequency (x axis) and noise bandwidth (y axis). (D) BFs of all recording sites in the A1 (Top), MGB (Middle), and pulvinar (Bottom) as defined by the frequency of the tone eliciting a maximal-amplitude MUA response. The dashed red vertical line in the Top panel marks the BF boundary between low- and high-frequency A1 sites. (E) MUA response onsets to auditory clicks pooled across a subset of recording sites from the three locations (MGB, n = 23; A1, n = 16; pulvinar, n = 18). Brackets indicate significant differences between groups, crosses (+ and ‡) denote outliers (Kruskal–Wallis ANOVA with Bonferroni corrected multiple comparisons analysis: H (Kruskal–Wallis ratio) = 34.79, P = 2.784 × 10⁻⁸; MGB vs. A1, P = 0.0003; MGB vs. pulvinar, P = 4.1541 × 10⁻⁸; A1 vs. pulvinar, P = 0.3732).
Fig. 2.
Fig. 2.
Pattern-related alignment of neural oscillations in A1. (A) Analytic amplitude of pattern-related LFP (Top), MUA (Middle), and CSD (Bottom) averaged across all A1 recordings. Vertical multicolored dashed lines mark the onset of pattern repeats. Boxplots show pooled prepattern (−5,000 to 0 ms) vs. pattern-related (R2–P.END) amplitudes. Brackets indicate a significant difference between periods (Wilcoxon signed rank test, n = 36, PLFP = 0.031; PMUA = 0.036; PCSD = 0.003). (B) Waveform illustrating our main hypothesis that, despite an amplitude decrease, an oscillation should be visible in the averaged responses if the oscillation is aligned to the temporal structure of pattern repetitions. The green asterisk indicates the approximate time when humans detected patterns (9). (C, Upper) Traces display pattern-related delta ITC (at 1.7 Hz) averaged across all channels within all A1 sites (purple trace) and across channels in which a significant delta ITC peak (Rayleigh P < 0.05) was detected during pattern repetitions (R2–P.END) (red trace). The dashed horizontal line marks the significance threshold as calculated by mean + 2 SD from the baseline ITC across all experiments. Boxplots show that both groups exhibit a significant ITC increase compared with prepattern ITC (Wilcoxon signed rank test, n = 36, PITCall = 0.0002; PITCselect = 2.35 × 10⁻⁷). (Lower) Traces show delta amplitude for the same two groups as above. Brackets indicate a significant increase of pattern-related delta amplitude (Wilcoxon signed rank test, n = 36, PAMPall = 2.21 × 10⁻⁵; PAMPselect = 6.59 × 10⁻⁵). (D) Averaged pattern-related supragranular CSD response from a representative A1 site and the same response simulated. Vertical dashed lines mark the period of pattern repeats. (E) As in C, but for simulated data. While pattern-related amplitude increase remains significant (Wilcoxon signed rank test, n = 36, P = 6.59 × 10⁻⁶), there is no pattern-related ITC increase (n = 36, P = 0.86). (F, Upper) Simulated data for 50 trials. (Lower) The ITC calculated for the 50 simulated trials. The horizontal dashed line signifies the significance threshold (n = 50, Rayleigh statistic, P = 0.05). P.E., P.END; prepatt., baseline before patterns; P.S., P.START.
Fig. 3.
Fig. 3.
Pattern-related excitability modulation across differently tuned A1 neuronal ensembles. (A) Delta phase distributions for supragranular channels selected based on the largest-amplitude sink–source pair, S1 and S2. Phase distributions for all A1 sites (n = 36, Top), A1 sites tuned to frequencies <11 kHz (Middle), and sites tuned to frequencies ≥11 kHz (Bottom). Vertical dashed blue lines indicate mean phases; green asterisks denote significant phase bias as determined by the Rayleigh test of uniformity (all A1 sites: PS1 = 0.20, PS2 = 0.030; BF <11 kHz: PS1 = 0.25, PS2 = 0.002; BF >11 kHz: PS1 = 0.32, PS2 = 0.003). (B) Supragranular pattern-related neuronal activity (S2 channels) filtered in the delta band (1.7 Hz ± 20%) and averaged separately across sites according to BF. (C) Filtered (1.7 Hz ± 20%), averaged, and normalized MUA averaged across A1 sites with BF <11 kHz (Upper) and with BF ≥11 kHz (Lower). Boxplots show the distribution of normalized MUA amplitudes at pattern onset and at midway points. Brackets indicate significant MUA amplitude differences (two-sample t test, P < 0.01).
Fig. 4.
Fig. 4.
Delta oscillatory alignment and pattern structure-related excitability modulation in the thalamus. (A, Upper) Traces display the pattern-related delta ITC averaged across all channels in MGB sites (ITCall, orange) and across channels with a significant delta ITC peak (Rayleigh P < 0.05) during the pattern repetitions (ITCselect, gold). The gray dashed trace shows ITC measured in significant A1 sites for reference (as in Fig. 2C, ITCselect). (Lower) Traces show the pattern-related data as above but for delta amplitude. Boxplots show that only the select MGB group had a significant ITC increase during patterns (Wilcoxon signed rank test, n = 30, PITCall = 0.15; PITCselect = 5.7 × 10⁻⁵). No significant amplitude differences were detected (Wilcoxon signed rank test, PAMPall = 0.37; PAMPselect = 0.55). (B) As in A, but for pulvinar recordings. Despite a significant increase in pattern-related ITC for both groups of channels (Wilcoxon signed rank test, n = 21, PITCall = 0.012; PITCselect = 6.89 × 10⁻⁵), no significant delta amplitude increase was detected (Wilcoxon signed rank test, n = 21, PAMPall = 0.19; PAMPselect = 0.14). (C) Filtered, averaged, and normalized MUA averaged across all MGB sites. Boxplots show the distribution of MUA amplitudes at pattern onset and midway points. (D) As in C but for pulvinar sites. Brackets indicate significant differences in MUA amplitude (two-sample t test, P < 0.01).
Fig. 5.
Fig. 5.
Summary of ITC and MUA modulation across areas. (A) Boxplots show the distribution of time points at which pattern structure-related ITC (at 1.7 Hz) became significant on individual electrode channels (n = 226, 134, and 118 for A1, MGB, and pulvinar, respectively). These significant ITC onset distributions were not different from one another (Kruskal–Wallis test, PA1&MGB = 0.088, PA1&pulv = 0.262, PMGB&pulv = 0.909). (B) Boxplots show the onsets of significant pattern-related filtered (1.7 Hz ± 20%) MUA. Only experiments with a significant deviation from baseline were included (n = 19, 13, 12 for A1, MGB, and pulvinar, respectively). Modulation onsets between A1 and pulvinar were different (Kruskal–Wallis test, PA1&MGB = 0.648, PA1&pulv = 0.020, PMGB&pulv = 0.214). (C) Normalized pairwise GC of pattern-related CSD from the pulvinar to the A1 (Upper) and from the A1 to the pulvinar (Lower). Gray traces show the GC for individual experiments (n = 3); colored traces show the average. Asterisks denote pattern repetitions during which the pairwise GC was significantly greater than the baseline (Wilcoxon rank sum test, Bonferroni corrected, pulv→A1: PR1-R2 = 0.0248, PR2-R3 = 0.0562, PR3-R4 = 0.0175, PR4-R5 = 0.0425, PR5-P.END = 0.0175; pulv←A1: PR1-R2 = 0.5449, PR2-R3 = 0.2532, PR3-R4 = 0.0958, PR4-R5 = 0.0237, PR5-P.END = 0.0175).
Fig. 6.
Fig. 6.
Pattern-related pupil modulation. (A) Normalized unfiltered pupil diameter averaged across clean trials. Boxplots show a significant difference before and during pattern presentation (n = 249, Wilcoxon signed rank test, P = 5.3573 × 10−48). (B, Upper) Traces display pattern-related ITC of the pupil signal averaged across selected trials (n = 249). Boxplots show a significant ITC increase (n = 282 time points, Wilcoxon signed rank test, P = 0.0311). (Lower) Traces show normalized delta amplitude for the same trials. Boxplots show a significant difference in amplitude (n = 282 time points, Wilcoxon signed rank test, P = 5.3573 × 10−48). (C) Single trial phases at pattern-repeat onsets for selected trials. Dashed red vertical lines indicate the mean phase at each pattern repetition. Green asterisks denote significant phase alignment (n = 249, Rayleigh test of uniformity, PP.START = 0.3034, PR1 = 0.1727, PR2 = 0.0441, PR3 = 0.0681, PR4 = 0.2833, PR5 = 0.8841, PP.END = 0.8831). (D) Normalized delta-filtered pupil diameter averaged across selected trials.

References

    1. Buzsáki G. Neural syntax: Cell assemblies, synapsembles, and readers. Neuron. 2010;68:362–385. - PMC - PubMed
    1. Doelling KB, Arnal LH, Ghitza O, Poeppel D. Acoustic landmarks drive delta-theta oscillations to enable speech comprehension by facilitating perceptual parsing. Neuroimage. 2014;85:761–768. - PMC - PubMed
    1. Giraud AL, Poeppel D. Cortical oscillations and speech processing: Emerging computational principles and operations. Nat Neurosci. 2012;15:511–517. - PMC - PubMed
    1. Ding N, Melloni L, Zhang H, Tian X, Poeppel D. Cortical tracking of hierarchical linguistic structures in connected speech. Nat Neurosci. 2016;19:158–164. - PMC - PubMed
    1. Bizley JK, Cohen YE. The what, where and how of auditory-object perception. Nat Rev Neurosci. 2013;14:693–707. - PMC - PubMed

Publication types

LinkOut - more resources