Comparative Study
. 2018 Aug;20(8):909-916.
doi: 10.1038/s41556-018-0143-y. Epub 2018 Jul 23.

Enteroendocrine cells switch hormone expression along the crypt-to-villus BMP signalling gradient

Affiliations
Comparative Study

Enteroendocrine cells switch hormone expression along the crypt-to-villus BMP signalling gradient

Joep Beumer et al. Nat Cell Biol. 2018 Aug.

Abstract

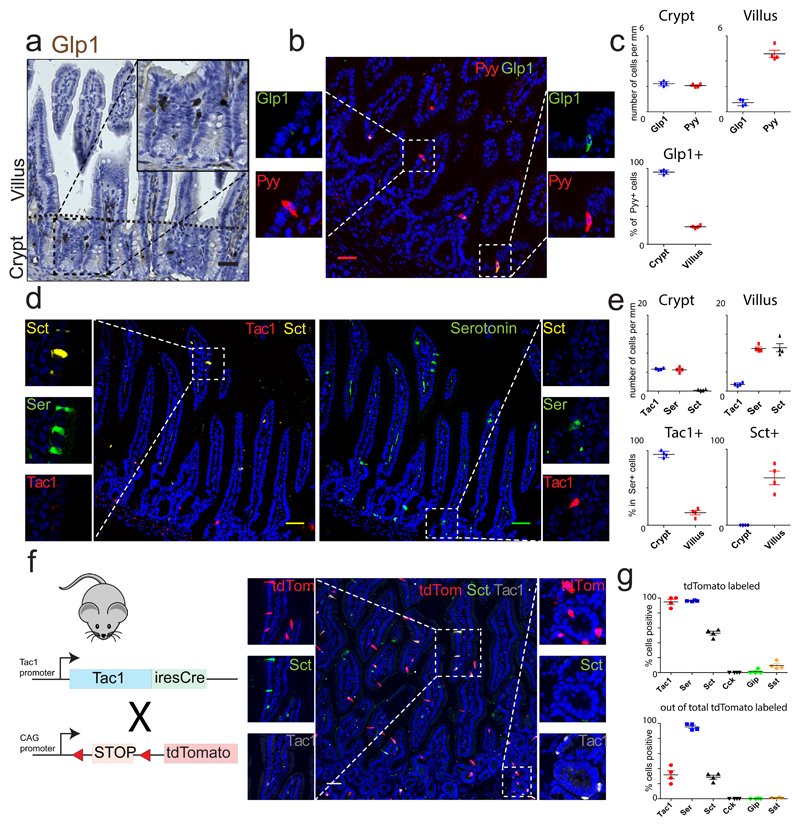
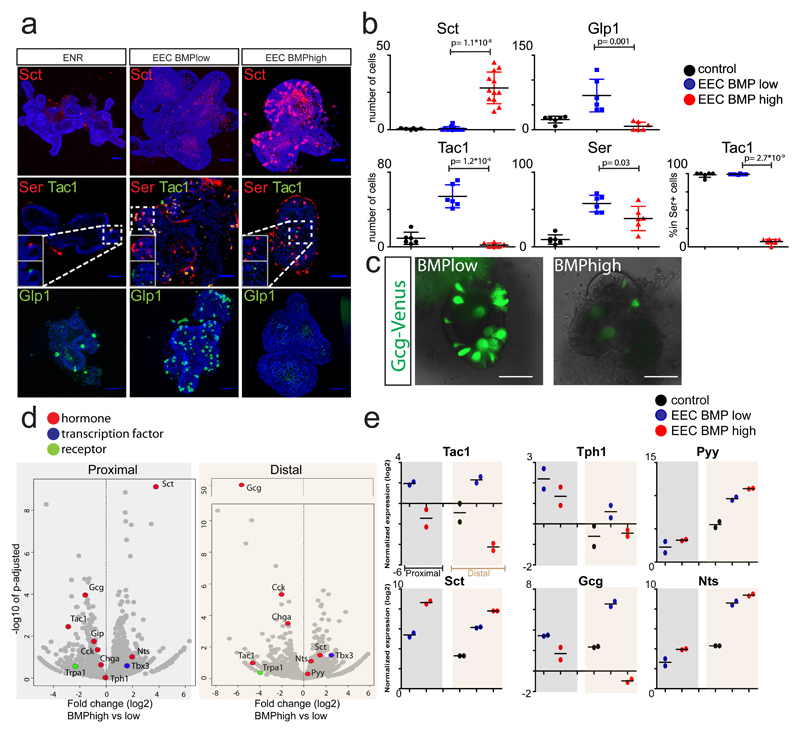
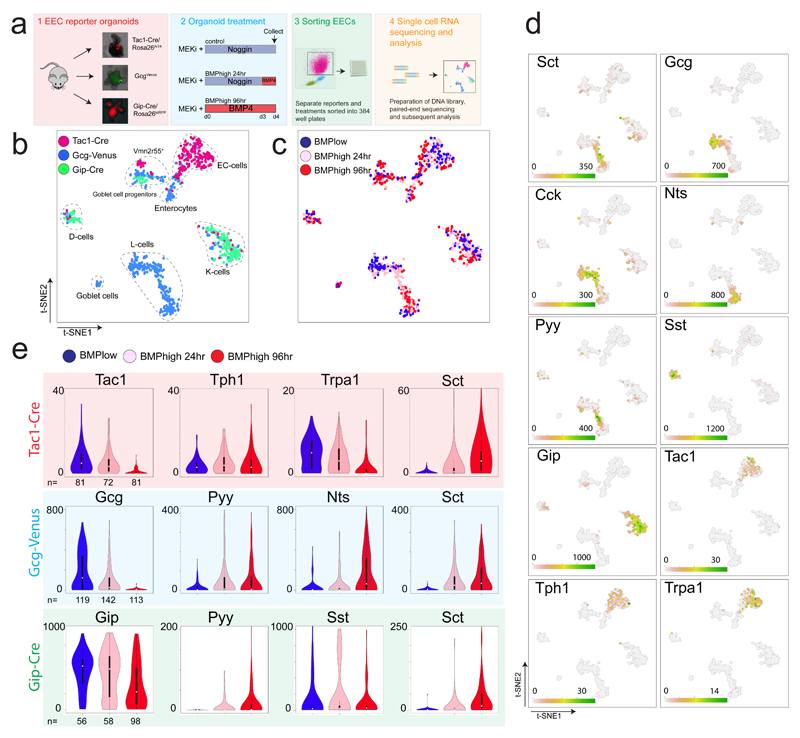
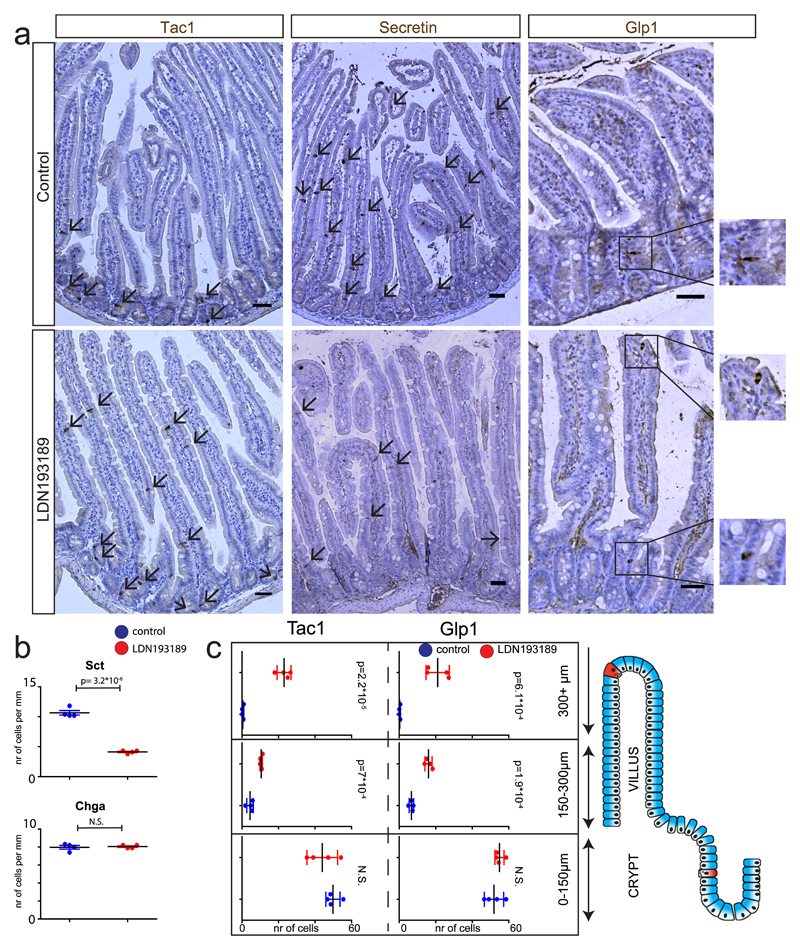
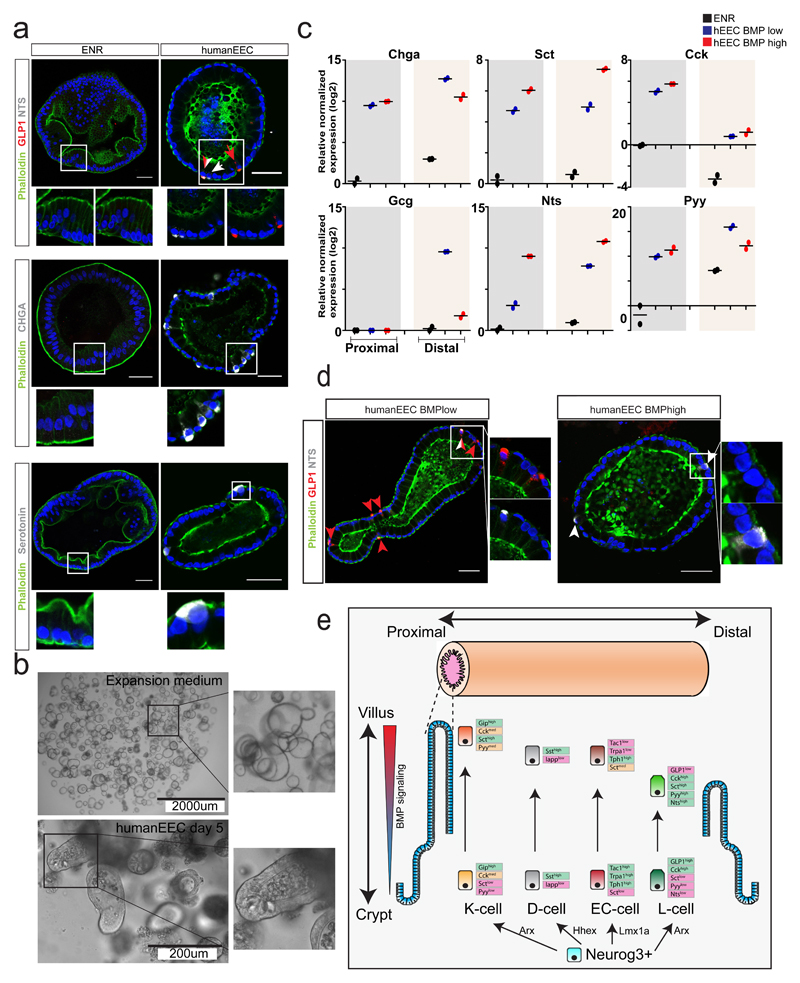
Enteroendocrine cells (EECs) control a wide range of physiological processes linked to metabolism1. We show that EEC hormones are differentially expressed between crypts (for example, Glp1) and villi (for example, secretin). As demonstrated by single-cell mRNA sequencing using murine Lgr5+ cell-derived organoids, BMP4 signals alter the hormone expression profiles of individual EECs to resemble those found in the villus. Accordingly, BMP4 induces hormone switching of EECs migrating up the crypt-villus axis in vivo. Our findings imply that EEC lineages in the small intestine exhibit a more flexible hormone repertoire than previously proposed. We also describe a protocol to generate human EECs in organoids and demonstrate a similar regulation of hormone expression by BMP signalling. These findings establish alternative strategies to target EECs with therapeutically relevant hormone production through BMP modulation.


Conflict of interest statement

Competing financial interests

The authors disclose no conflicts of interest.

Figures

Fig. 1
Fig. 1. Enteroendocrine cells switch hormone expression while migrating from crypt to villus.
a and b, Immunohistochemical analysis reveals Glp1+ cells are enriched in the ileal crypt, where they co-express Pyy. Experiment in (a) was repeated two times independently with similar results. c, Quantification of b. The percentage of Pyy+ cells that co-express Glp1 are represented in the lower chart. d, ECs express Tac1 in the crypt and Sct in the villus, while Serotonin is produced in both locations. e, Quantification of d. The percentage of Serotonin+ cells that co-express Tac1 or Sct are represented in the lower charts. f, Intestine of Tac1iresCre /RosaAi14 mice reveals that ECs lose Tac1 and gain Sct expression from crypt to villus. g, Quantification of (f) and Fig S1. The percentages of each hormone that is tdTomato+ (upper chart) and of tdTomato+ cells that are hormone positive (lower chart) are shown. The mean values are depicted in graphs c, e and g, and error bars present SD for n=4 mice for each experiment. Scale bar is 50 µm.
Fig.2
Fig.2. Activation of BMP signaling induces Villus-like hormone signature in mouse EECs.
a, Organoids are differentiated for 4 days to EECs in the absence (EEC BMPlow) or presence of BMP4 (EEC BMPhigh). ENR is used as a control. Activation of BMP signaling induces expression of Sct, while repressing Tac1 and Glp1. Images are presented as maximum projections. b, Quantification of a. The number of positive cells for each hormone were quantified and are displayed per mm of organoid epithelium. The percentage of Serotonin+ cells that co-express Tac1 are presented. Sample size represents n=2 biologically independent experiments, in which at least 3 organoids were quantified per replicate and staining. Statistics were derived comparing all organoids (n=12 for Sct, n=6 for other hormones) in BMP low and high conditions using a two-sided t-test. Mean values per treatment are shown, and error bars present SD. c, Overlay of brightfield and Venus image of organoids derived from GcgVenus mice after a 4 day treatment with a BMPlow or BMPhigh EEC differentiation cocktail. BMP activation represses expression of Gcg, without inducing morphological alterations. Experiment was repeated independently 10 times. d, Volcano plots showing results from RNA sequencing of organoids stimulated for 4 days with BMP low or high EEC differentiation cocktails, from proximal (left) and distal (right) SI organoids. Gene expression fold change (log2) of BMPhigh versus BMPlow is shown on the x-axis and significance on the y-axis. Each grey dot represents a gene, and dots representing relevant genes are highlighted in different colors, according to their function. Sample size represents n=2 biologically independent experiments, and p-adjusted values were calculated with a Wald test using the DESeq2 package. e, qPCR analysis of selected hormones from d. Expression levels are shown relative to control organoids in ENR medium. Experiment was performed in n=2 biologically independent experiments, and the mean expression is depicted. Scale bar is 50 µm.
Fig.3
Fig.3. Single cell RNA sequencing reveals BMP regulated plasticity among different EEC subtypes.
a, Experimental paradigm. Different EEC reporter organoids were treated with a MEK inhibitor, while receiving Noggin or BMP4. After 4 days, organoids were dissociated and traced EECs sorted and processed for single cell RNA sequencing. b and c, t-SNE map of single cell RNA sequenced EECs using the RaceID2 algorithm. Different colors, as indicated in the legend, highlight cells isolated from different reporter organoids (b) and treatments (c). d, Expression levels of selected hormones and receptors in the tSNE space of (b-c). e, Expression of individual hormones within different EEC reporter sorted cells are presented in violin plots, with different colors for the different treatments (as indicated in the legend). Violin plots depict median values (white dot), 50% of the values (within thick black line) and 95% of the values (within thin black line). The number of cells per treatment and reporter is depicted. Different dynamics of hormone expression were observed over the course of BMP treatment in subtypes of EECs.
Fig. 4
Fig. 4. Manipulation of BMP gradient alters hormone expression in mice.
a, Mice were treated for 80 hours with BMPr1a inhibitor LDN193819. Immunohistochemical analysis of the intestine shows a repression of Sct and induction of Glp1 and Tac1 expression upon BMP inhibition. Glp1+ and Tac1+ expressing cells are mostly restricted to the crypt in control mice, but expand into the upper villus region upon BMP inhibition. b, Quantification of a. Number of Chga+ and Sct+ positive cells per treatment. c, Quantification of a. Number of Tac1+ or Glp1+ cells are displayed for each segment of the crypt-villus axis in the different treatments. Cells positive for Tac1 and Glp1 increase in the higher villus segments upon LDN193189 treatment. Tac1+ cells are counted and displayed in 10mm of the proximal small intestine. Glp1+ cells are counted and displayed in 30mm of the distal small intestine. Results presented are derived from n=4 mice per treatment, and statistics were calculated using a two-sided t-test. Mean values per staining and treatment are shown, and error bars present SD. Scale bar is 50 µm.
Fig. 5
Fig. 5. New human EEC differentiation protocol implies conserved BMP-controlled hormone expression.
a, Human small intestinal organoids were induced to differentiate either for 5 days by withdrawing Wnt signals (ENR) or to EECs through additional MEK and Notch inhibition. Immunofluorescence indicates the presence of different subtypes of EECs in human organoids. White arrows indicate NTS+ cells, red arrows Glp1+ cells. Experiment has been repeated four times independently with similar results. b, Brightfield images of human intestinal organoids in expansion medium or after a 5 day differentiation towards EECs. Experiment was repeated independently four times. c, The 5-day differentiation protocol of EECs (‘humanEEC’) was performed in the presence and absence of BMP4. Expression levels of hormones were determined by qPCR and are shown relative to duodenal ENR control. Gcg expression is shown relative to ileal ENR control, as it was not detected in duodenal organoids. Sample size represents n=2 biologically independent experiments, and the mean expression values are shown. d, Human EECs were produced in the absence (BMPlow) or presence (BMPhigh) of BMP4. NTS overlaps with GLP1 in BMP low conditions, while only NTS single positive cells are observed in BMPhigh conditions. Experiment was repeated independently four times. Scale bar is 50 µm. e, Model of EEC differentiation. K-cells are enriched in the proximal and L-cells in the distal part of the SI respectively, whereas ECs and D-cells are uniformly distributed. A crypt-to-villus BMP signaling gradient drives alterations in hormone repertoires in these EEC lineages.

Comment in

References

    1. Furness JB, Rivera LR, Cho H-J, Bravo DM, Callaghan B. The gut as a sensory organ. Nat Rev Gastroenterol Hepatol. 2013;1010:729–740. - PubMed
    1. Connor TMO, et al. The Role of Substance P in Inflammatory Disease. doi: 10.1002/jcp.20061. - DOI - PubMed
    1. Egerod KL, et al. A major lineage of enteroendocrine cells coexpress CCK, secretin, GIP, GLP-1, PYY, and neurotensin but not somatostatin. Endocrinology. 2012;153:5782–5795. - PMC - PubMed
    1. Haber AL, et al. A single-cell survey of the small intestinal epithelium. Nature. 2017;551:333–339. - PMC - PubMed
    1. Barker N, et al. Identification of stem cells in small intestine and colon by marker gene Lgr5. Nature. 2007;449:1003–1007. - PubMed

Publication types

Substances