. 2018 Aug;21(8):1126-1136.
doi: 10.1038/s41593-018-0187-0. Epub 2018 Jul 23.

Cell-specific histone modification maps in the human frontal lobe link schizophrenia risk to the neuronal epigenome

Affiliations

Cell-specific histone modification maps in the human frontal lobe link schizophrenia risk to the neuronal epigenome

Kiran Girdhar et al. Nat Neurosci. 2018 Aug.

Abstract

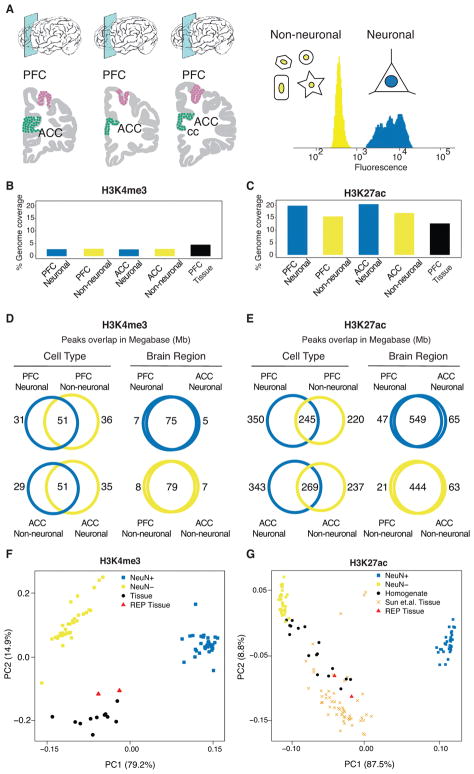
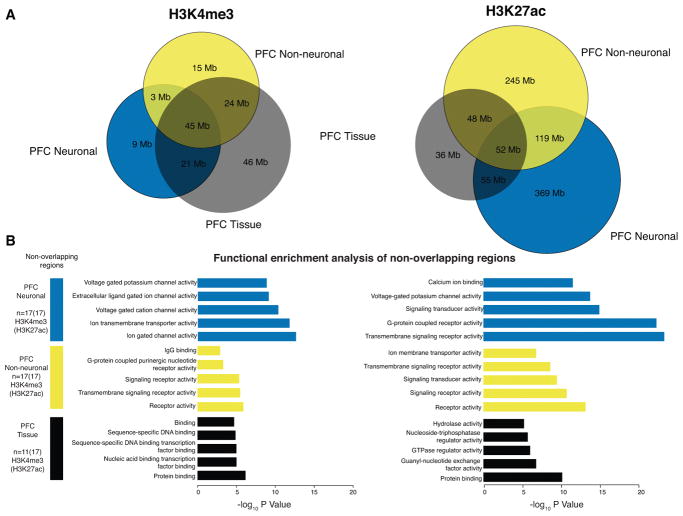
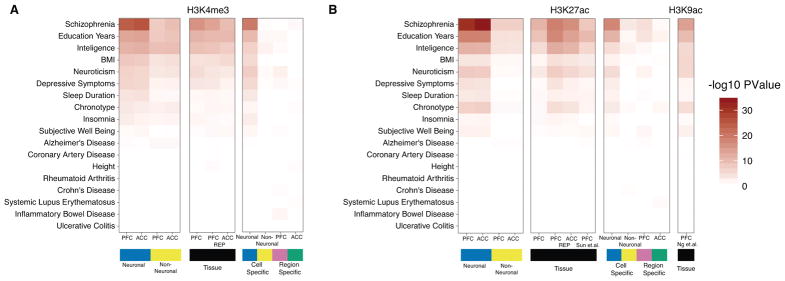
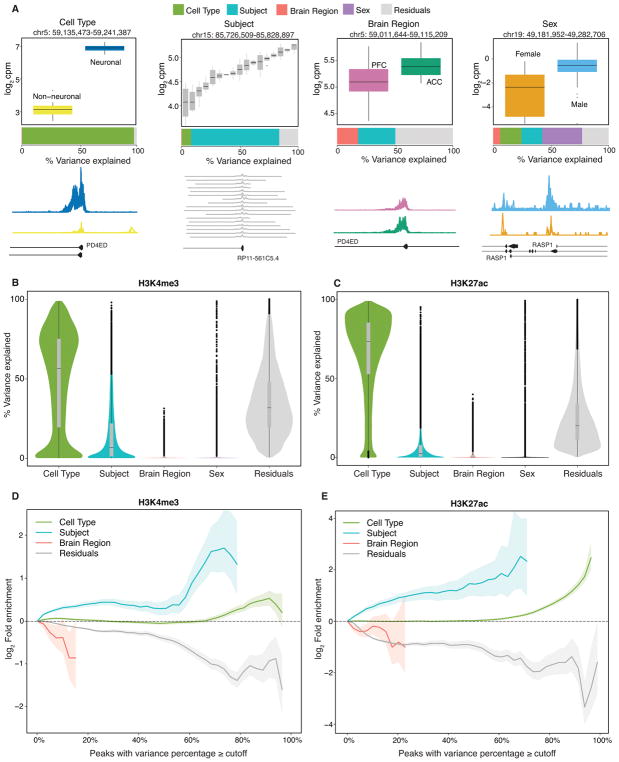
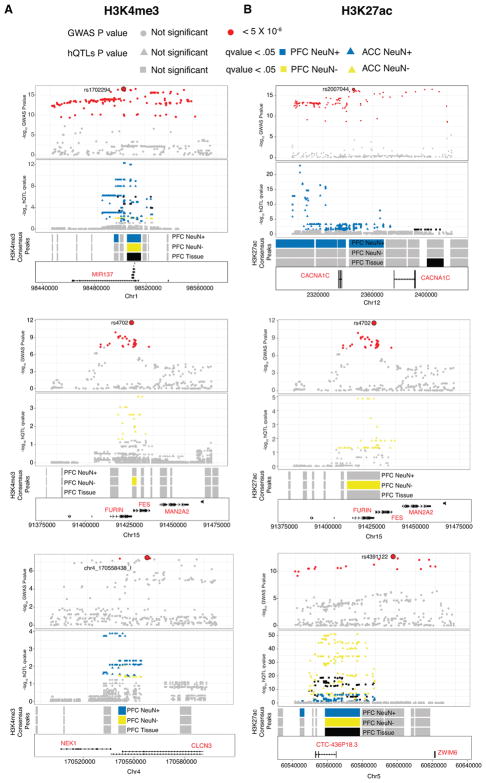
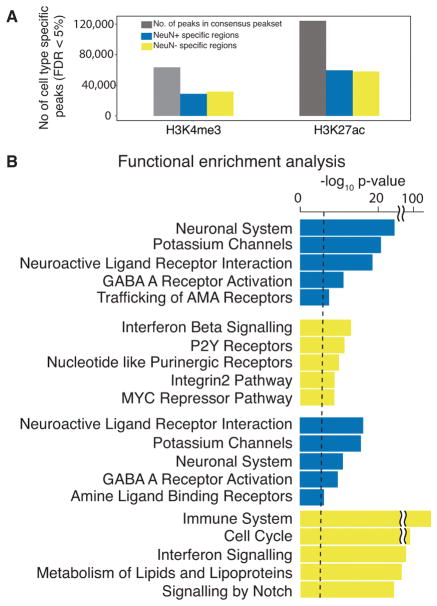
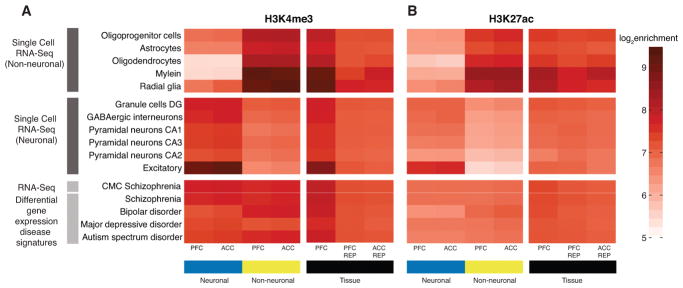
Risk variants for schizophrenia affect more than 100 genomic loci, yet cell- and tissue-specific roles underlying disease liability remain poorly characterized. We have generated for two cortical areas implicated in psychosis, the dorsolateral prefrontal cortex and anterior cingulate cortex, 157 reference maps from neuronal, neuron-depleted and bulk tissue chromatin for two histone marks associated with active promoters and enhancers, H3-trimethyl-Lys4 (H3K4me3) and H3-acetyl-Lys27 (H3K27ac). Differences between neuronal and neuron-depleted chromatin states were the major axis of variation in histone modification profiles, followed by substantial variability across subjects and cortical areas. Thousands of significant histone quantitative trait loci were identified in neuronal and neuron-depleted samples. Risk variants for schizophrenia, depressive symptoms and neuroticism were significantly over-represented in neuronal H3K4me3 and H3K27ac landscapes. Our Resource, sponsored by PsychENCODE and CommonMind, highlights the critical role of cell-type-specific signatures at regulatory and disease-associated noncoding sequences in the human frontal lobe.


Conflict of interest statement

Competing interests: The authors declare no competing interests.

Figures

Figure 1
Figure 1. Cell- and region-specific histone modification profiling in the human frontal lobe
(A) (left) Region-of-interest, dorsolateral prefrontal cortex (PFC) and anterior cingulate cortex (ACC) positioned dorsal and anterior from rostral genu of corpus callosum (cc). (right) representative FACS nuclei sorting showing fluorescence of NeuN antibody binding separating nuclei into neuronal (NeuN+) and neuron-depleted (NeuN) fraction. (B,C) The genome wide coverage of ChIP-Seq peaks for each consolidated data set: PFC neuronal, PFC neuron-depleted, ACC neuronal and ACC neuron-depleted, separately for (B) H3K4me3, N (brains) = 17 PFC NeuN+, 14 ACC NeuN+, 17 PFC NeuN, 15 ACC NeuN, and (C) H3K27ac, N (brains) = 17 PFC NeuN+, 17 ACC NeuN+, 17 PFC NeuN, 15 ACC NeuN, (D,E) Venn diagrams by histone mark (panel D: H3K4me3, panel E: H3K27ac) cell type (blue: neuronal, gold: neuron-depleted), and brain region, summarizing the overlap (expressed in Mb) of called peaks (MACS2, P value<0.01). (F,G) PCA of pairwise correlations between each pair of ChIP-Seq log2 counts per million of samples from each mark. Visualization of first two principal components where each sample/data point shown in the figure are from 1) our cell-specific and homogenate dataset: PFC neurons, ACC neurons in blue squares, PFC non-neurons, ACC-non neurons are in golden squares (N (samples) = 63-H3K4me3, 66-H3K27ac) and PFC homogenate (N(samples) = 11-H3K4me3, 17-H3K27ac) in black circles 2) REP Roadmap Epigenomic project: ACC and PFC homogenate are in red triangles and 3) Sun et.al.: PFC homogenate in orange cross markers (N (brains) 53-H3K27ac).
Figure 2
Figure 2. Functional enrichment of non-overlapping cell- and tissue-specific histone peaks
(A) Venn diagrams showing overlap in Mb of peak regions between neuronal (blue), non-neuronal (gold) and homogenate (black) for H3K4me3 (left panel) and H3K27ac (right panel). (B) Functional enrichments evaluated using GREAT of peak regions that are unique to each of the 3 sets. Bar plots in blue, gold and black correspond to –log10 p-value from hypergeometric test of pathway enrichment results of peaks that are unique to neuronal, non-neuronal and homogenate respectively. H3K4me3, N (brains) = 17 PFC NeuN+, 17 PFC NeuN, 11 PFC tissue homogenate, and H3K27ac N (brains) = 17 PFC NeuN+, 17 PFC NeuN, 17 PFC tissue homogenate.
Figure 3
Figure 3. Enrichment of heritability for brain and non-brain related phenotypes within cell- and tissue-specific histone peaks
Using LD-score regression to partitioned heritability, we tested if the genetic variants contributing to 18 brain and non-brain-related phenotypes were enriched for (A) H3K4me3 and (B) H3K27ac. In (A), heritability enrichment analysis was preformed on multiple sets of genome regions that are visualized in 3 blocks. (1) Regions marked in blue and golden show enrichment values from PFC neuronal: 63,642 (105,075) peaks, ACC neuronal: 61,043 (116,714) and PFC neuronal-depleted: 95,501 (91,037) peaks, ACC-neuronal-depleted: 87,292 (101,885) from consolidated H3K4me3 (H3K27ac) datasets. (2) Regions marked in black show enrichment value of PFC tissue from our dataset: 158,345(183,885) peaks and PFC tissue: 75,912(317,582) peaks, ACC tissue: 79,844(260,288) peaks from the Roadmap Epigenomics project for H3K4me3(H3K27ac) marks. (3) Regions showing statistically significant differential histone modification either between the two cell types or two brain regions. Results for peaks that show increased histone modification in neurons: 28,838(59,588) peaks or non-neurons: 31,790(58,120) peaks from H3K4me3(H3K27ac) marks are indicated in blue and gold, respectively. Results for peaks that show increased histone modification in PFC: 696(10,665) peaks or ACC: 508(10,797) peaks from H3K4me3(H3K27ac) are indicated in purple and green, respectively. (B) Layout is the same as in (A) except that enrichment of 56,503 peaks from PFC tissue from Sun, et al. and 26,384 peaks from Ng et al. were added. We note that regions marked in neurons consistently show the most significant enrichment for sequences associated with genetic risk for schizophrenia. H3K4me3, N (brains) = 17 PFC NeuN+, 14 ACC NeuN+, 17 PFC NeuN, 15 ACC NeuN, and 11 PFC tissue homogenate; H3K27ac. N (brains) = 17 PFC NeuN+, 17 ACC NeuN+, 17 PFC NeuN, 15 ACC NeuN, 17 PFC tissue homogenate (HBCC).
Figure 4
Figure 4. Decomposing multiples sources of epigenetic variation
The contribution of epigenetic variation across 2 cell types, 17 subjects, 2 brain regions and 2 sexes, plus residual variation, were quantified using a linear mixed model implemented in variancePartition. (A) Representative examples of H3K4me3 consensus peaks (128,467 peaks from n=63 samples) where one source explains a large fraction of the epigenetic variation. Box plots indicate the log2 counts per million stratified by cell type, subject, brain region and sex. Box plot black horizontal line indicates median, box demarcates log2cpm in IQR (inter quartile range) for a given peak region, vertical line above and below the box plot show the 1.5IQR of upper (lower) quartile. Barplot below the box plot indicates the fraction of epigenetic variation in the peak explained by each variable. Genome coverage plot (bottom row) of ChIP-Seq signal (n=17 individuals) from data subset PFC neuronal for each peak region shown in the boxplot. (B–C) Violin plots indicate the genome-wide distribution of epigenetic variation across 4 variables, plus the residual variation for (B) H3K4me3 (128,467 peaks from n=63 samples) and (C) H3K27ac (147,539 peaks from n=66 samples). Each point represents a peak, and the width of the violin plot represents the number of peaks. Bar plot indicate the median and 25% and 75% quantiles. (D,E) Fold enrichment of histone QTL’s identified in lymphoblastoid cell lines and post mortem PFC for peaks with variance explained by each variable exceeding the cutoff indicated on the x-axis for (D) H3K4me3 (n=63 samples) and (E) H3K27ac (n=66 samples), respectively. Results for sex are not shown because enrichment for only autosomal genes was considered. Shaded regions indicate 90% confidence interval from 10,000 permutations.
Figure 5
Figure 5. Overlap of cell specific and homogenate hQTLs with genome wide significant loci in schizophrenia
A few representative genome wide significant loci in schizophrenia that overlap with cell specific and homogenate hQTLs are shown. All significant SNPs (p-value<5×10⁻⁸) are colored in red with lead SNP as a big red circle and rest are shown in gray. Corresponding to these representative GWAS loci, overlapping cell specific and homogenate hQTLs are shown in gray with significant hQTLs (RASQUAL q value < .05) colored in blue (neurons), gold (non-neurons) and black (homogenate). Consensus peak regions for which hQTLs were called are shown in gray separately for neurons, non-neurons and homogenates. These tracks are colored as blue, gold and black if they have any significant hQTL (RASQUAL q value < .05) that overlaps with the representative genome wide significant loci (p-value<5×10⁻⁸). From top to bottom, loci shown are MIR137, FURIN, CLCN3 for H3K4me3 (A) and CACNA1C, FURIN and ZWIM6 for H3K427ac (B). H3K4me3, N (brains) = 17 PFC NeuN+, 14 ACC NeuN+, 17 PFC NeuN, 15 ACC NeuN, and 11 PFC tissue homogenate; H3K27ac. N (brains) = 17 PFC NeuN+, 17 ACC NeuN+, 17 PFC NeuN, 15 ACC NeuN, 17 PFC tissue homogenate (HBCC).
Figure 6
Figure 6. Regions differentially modified in neuronal and non-neuronal cell types
(A) Bar plot of counts of differentially modified peaks for each neuronal (blue) and neuron-depleted (gold) chromatin for H3K4me3 (top) and H3K27ac (bottom) at FDR < 5%. Differential modification analysis was performed on the normalized read counts matrix with columns as genomic regions 128,467 (147,539) and 4 types of samples PFC neuronal, ACC neuronal, PFC neuron-depleted and ACC neuron-depleted from 17 individuals (brains) as rows N (samples) = 63 (66) after QC for H3K4me3 (H3K27ac) (B) Functional enrichments for genes near differentially modified peaks computed with GREAT. Bar plots in corresponding to significant peaks (neuronal: 28,838(59,588) and non-neuronal 31,790(58,120) from H3K4me3(H3K27ac) marks identified in datasets from (A) N (samples) = 63 (66) H3K4me3 (H3K27ac) show top 5 pathways from REACTOME, Pathway Interaction Database and KEGG databases with –log10 p-value from hypergeometric test for neuronal and non-neuronal peaks respectively. Dashed line shows the Bonferroni cutoff at 2×10⁻⁵.
Figure 7
Figure 7. Cell-type specific histone acetylation and methylation profiles are associated with differential enrichment for neuronal and glial transcripts
(A,B) The colored tiles illustrates the log2 magnitude of enrichment of ChIP-seq counts (A, H3K4me3; B, H3K27ac) within 15 Kb downstream and upstream of transcription start site (TSS) of gene sets that are identified as neuronal and non-neuronal cell types from (top) scRNA-Seq defining various neuronal and glial subtypes as indicated and (bottom) disease-associated gene expression profiles . Enrichments were quantified for cell-specific datasets (blue) PFC neuronal, ACC neuronal, (golden) PFC neuron-depleted, ACC neuron-depleted and PFC tissue (homogenate) including Human Brain Collection Core (HBCC), and the REP Roadmap Epigenomics Project.

References

    1. Geschwind DH, Flint J. Genetics and genomics of psychiatric disease. Science (New York, NY) 2015;349:1489–1494. - PMC - PubMed
    1. Gandal MJ, Leppa V, Won H, Parikshak NN, Geschwind DH. The road to precision psychiatry: translating genetics into disease mechanisms. Nature neuroscience. 2016;19:1397–1407. - PMC - PubMed
    1. Bernstein BE, et al. The NIH Roadmap Epigenomics Mapping Consortium. Nat Biotech. 2010;28 - PMC - PubMed
    1. Farh KKH, et al. Genetic and Epigenetic Fine-Mapping of Causal Autoimmune Disease Variants. Nature. 2015;518:337–343. - PMC - PubMed
    1. Roadmap Epigenomics, C., et al. Integrative analysis of 111 reference human epigenomes. Nature. 2015;518:317–330. - PMC - PubMed

Publication types

MeSH terms