. 2018 Aug;21(8):1049-1060.
doi: 10.1038/s41593-018-0192-3. Epub 2018 Jul 23.

Epigenetic regulation of brain region-specific microglia clearance activity

Affiliations

Epigenetic regulation of brain region-specific microglia clearance activity

Pinar Ayata et al. Nat Neurosci. 2018 Aug.

Abstract

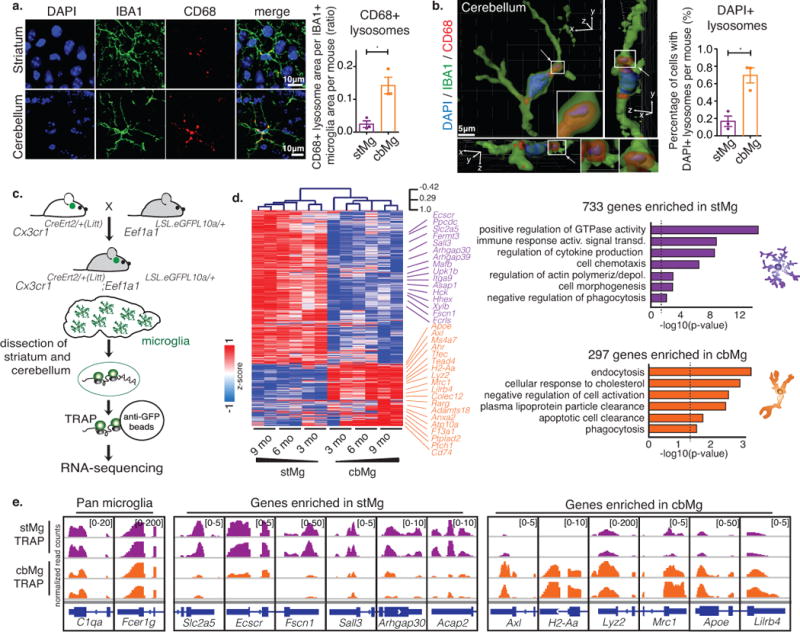
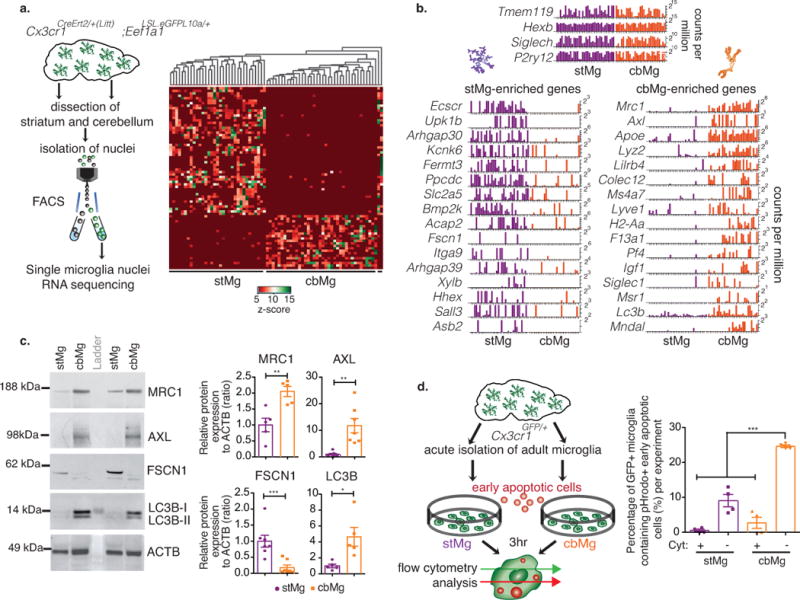
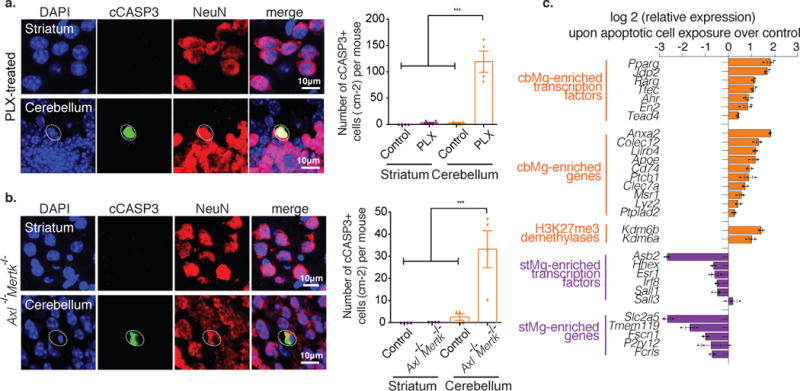
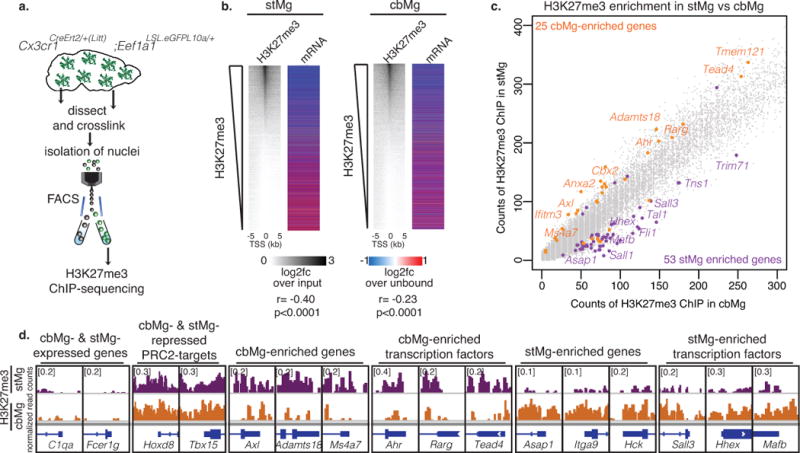
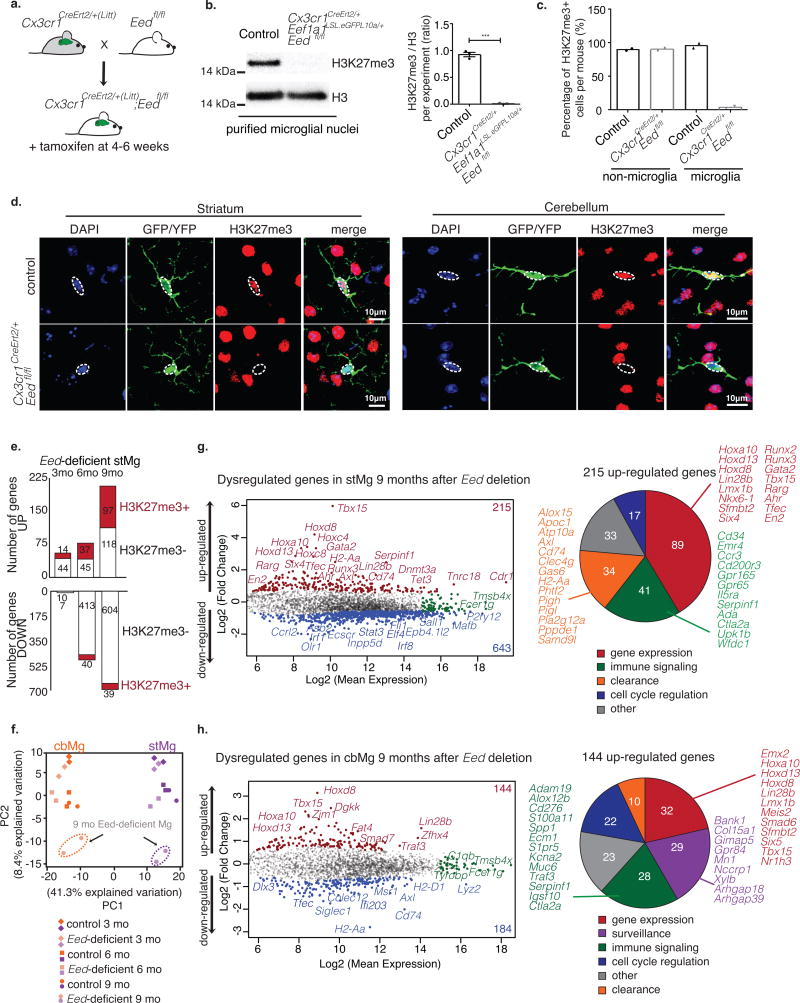
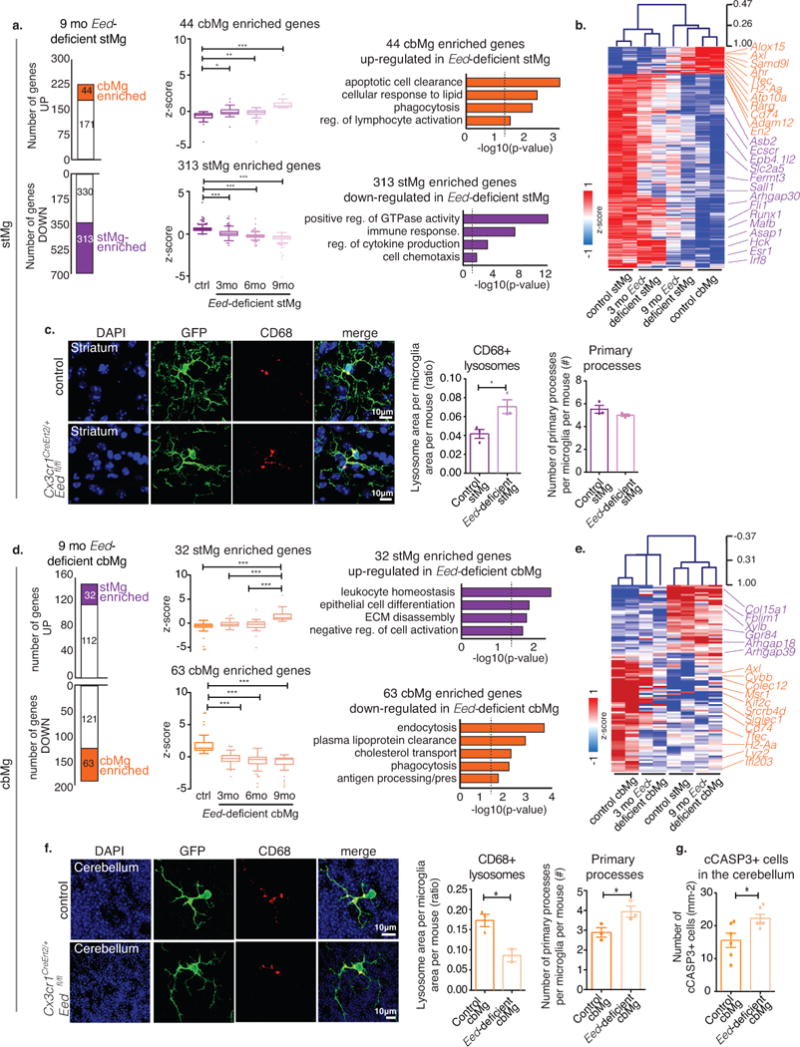
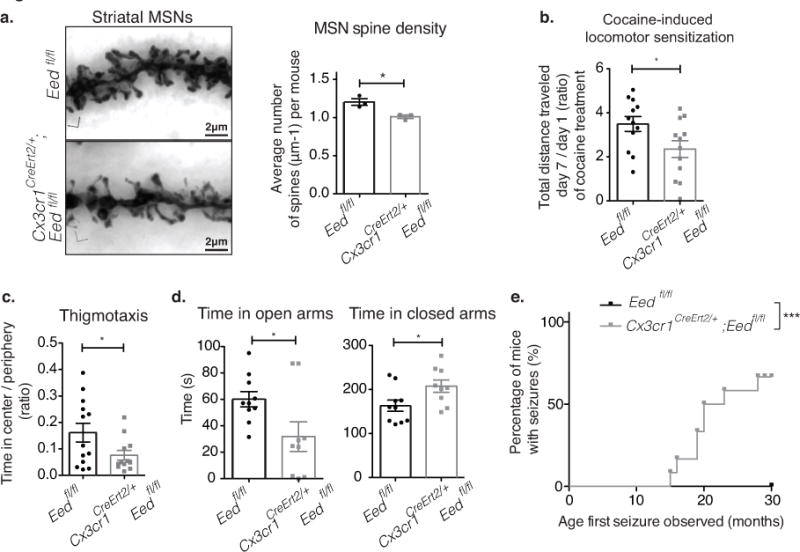
The rapid elimination of dying neurons and nonfunctional synapses in the brain is carried out by microglia, the resident myeloid cells of the brain. Here we show that microglia clearance activity in the adult brain is regionally regulated and depends on the rate of neuronal attrition. Cerebellar, but not striatal or cortical, microglia exhibited high levels of basal clearance activity, which correlated with an elevated degree of cerebellar neuronal attrition. Exposing forebrain microglia to apoptotic cells activated gene-expression programs supporting clearance activity. We provide evidence that the polycomb repressive complex 2 (PRC2) epigenetically restricts the expression of genes that support clearance activity in striatal and cortical microglia. Loss of PRC2 leads to aberrant activation of a microglia clearance phenotype, which triggers changes in neuronal morphology and behavior. Our data highlight a key role of epigenetic mechanisms in preventing microglia-induced neuronal alterations that are frequently associated with neurodegenerative and psychiatric diseases.


Conflict of interest statement

Competing Interests:

A.M.G. receives financial compensation as an advisory board member for Denali Therapeutics (a biotechnology company focused on the discovery and development of therapies for patients with neurodegenerative diseases.

Figures

Fig. 1
Fig. 1. cbMg display a cell clearance phenotype
(a) CD68+ lysosome content (red) in IBA1+ microglia (green) in brain sections from 4/6mo wild-type mice (DAPI: blue). Scale: 10 μm. Representative image (left); quantification of lysosomal area/microglia area (right) are shown. stMg: mean=0.02437, SEM=0.01011; cbMg: mean=0.1424, SEM=0.02527; p=0.0166, F=6.245, t2=7.668; >15 images/region from n=3 mice. (b) DAPI content (blue) in CD68+ lysosomes (red) of IBA1+ microglia (green) was determined using 3D reconstruction (Imaris) from 4/6mo wild-type mice. Scale: 5 μm. Representative reconstruction with side scatter views (left); quantification of percentage of microglia with DAPI+ CD68+ lysosomes (right). Arrows indicate DAPI+/CD68+ lysosome, which is shown with a zoomed in view. 3D axes are shown. stMg: mean=0.1675, SEM=0.06029; cbMg: mean=0.6960, SEM=0.0868; p=0.0300, F=2.077, t2=5.639; >200 cells/region from n=3 mice. Bar graphs with individual data points show mean ± SEM, t-tests were two-tailed paired. (c) Schematic showing microglia-specific TRAP-sequencing. (d) Heatmap with hierarchical clustering distances shows the variation in the expression levels (z-scored log2 RPKM [z-score]) of 733 stMg- and 297 cbMg-enriched genes identified by TRAP (DESeq2, n=2/age/region). Selected Gene Ontology (GO) annotations (Enrichr) enriched for stMg-/cbMg-enriched genes are shown. y-axis: -log10 (p-value). Dotted lines: p=0.05. (e) Genome browser views (IGV) of normalized read counts of selected genes in stMg/cbMg by TRAP.
Fig. 2
Fig. 2. cbMg show cell clearance phenotype at the single cell, protein, and functional level
(a) Schematic showing single nuclei RNA-seq (Fluidigm C1). Heatmap with unsupervised clustering displays the variation in the expression levels (z-score) of 75 most differentially expressed genes across all single nuclei. (b) Bar graphs show normalized expression levels (counts per million) of selected genes for single stMg/cbMg nuclei. Experiment was repeated independently 2 times with similar results. (c) Western blot analysis of CD11b-bead-isolated microglia (75,000 cbMg/stMg from one mouse per lane). Representative blots (left, cropped to show the specific band); quantifications (right). ACTB is used as loading control. FSCN1: stMg: mean=1.0, SEM=0.1887; cbMg: mean=0.1792, SEM=0.08138; p=0.0018, F=5.378, t11=3.994. MRC1: stMg: mean=1.0, SEM=0.2132; cbMg: mean=2.051, SEM=0.16; p=0.0043, F=1.776, t8=3.941. AXL: stMg: mean=1.0, SEM=0.3482; cbMg: mean=11.79, SEM=2.691; p=0.0018, F=59.71, t12=3.977. LC3: stMg: mean=1.0, SEM=0.2328; cbMg: mean=4.647, SEM=1.179; p=0.0162, F=25.66, t8=3.034. Two-tailed paired t-test. n=7 animals (4 independent experiments) for FSCN1 and AXL, n=5 animals (2 independent experiments) for MRC1 and LC3. The full-length image of these blots and those of subsequent blots can be found in Supplementary Fig. 15. (d) Schematic showing phagocytosis assay of acutely isolated adult cbMg/stMg exposed to early apoptotic cells in vitro. Quantification of the percentage of GFP+ microglia that engulfed pHrodo+ early apoptotic cells in presence/absence of phagocytosis inhibitor, Cytochalasin D (Cyt) (stMg: mean=9.055, SEM=1.761; stMg+Cyt: mean= 0.5725, SEM=0.3420; cbMg: mean=24.63, SEM=0.3789; cbMg+Cyt: mean=2.720, SEM=1.589; pbrain region<0.0001, Fbrain region=53.36; pCyt<0.0001, FCyt=156.9). Two-way ANOVA (n=4 independent experiments, each using four 3/4mo Cx3cr1GFP/+ mice). Bar graphs with individual data points show mean ± SEM.
Fig. 3
Fig. 3. cbMg clearance phenotype is associated with exposure to dying cells
(a,b) Representative immunofluorescence images are shown (NeuN+ neurons: red; cCASP3+: green; DAPI: blue). Dotted circles: cCASP3+/NeuN+ cell. Scale: 10 μm. (a) Quantification of cCASP3+ cells per cm2 from 4mo control (striatum: mean=0, SEM=0; cerebellum: mean=2.500, SEM=1.443) or PLX-treated mice (striatum: mean=2.500, SEM=1.443; cerebellum: mean=119.2, SEM=20.02); p<0.0001, F=67.40; 14 cerebellum/striatum sections from n=4 mice/group.(b) Quantification of cCASP3+ cells per cm2 from 4/5mo control (striatum: mean=0, SEM=0; cerebellum: mean=2.500, SEM=1.443) or Axl−/−Mertk−/− mice (striatum: mean=0, SEM=0; cerebellum: mean=33.17, SEM=8.355); p=0.0003, F=14.62;12 cerebellum/striatum sections from n=4 mice/group. Bar graphs with individual data points show mean ± SEM, one-way ANOVA with Tukey’s Multiple Comparison. (c) Horizontal bar graph shows relative expression (qPCR) of selected cbMg-enriched (orange) and stMg-enriched (purple) genes in microglia after 12 hours of exposure to vehicle or early apoptotic cells. Pparg (p=0.002, t4=7.144), Jdp2 (p<0.0001, t4=15.16), Rarg (p=0.001, t4=10.16), Tfec (p<0.0001, t4=11.47); Ahr (p=0.004, t4=6.033), En2 (p=0.025, t4=3.493), Tead4 (p=0.002, t4=7.013), Anxa2 (p<0.0001, t4=36.96), Colec12 (p=0.002, t4=7.498), Lilrb4 (p<0.0001, t4=14.04), Apoe (p=0.002, t4=6.964), Cd74 (p=0.001, t4=8.070), Ptch1 (p=0.037, t4=3.066), Clec7a (p=0.015, t4=4.064), Msr1 (p=0.011, t4=4.448), Lyz2 (p=0.024, t4=3.529), Ptplad2 (p=0.009, t4=4.809), Kdm6b (p<0.0001, t4=15.33), Kdm6a (p=0.004, t4=5.871), Hhex (p=0.025, t4=3.501), Esr1 (p=0.018, t4=3.885), Irf8 (p=0.001, t4=9.580), Sall1 (p=0.139, t4=1.842), Sall3 (p=0.449, t4=0.8381), Slc2a5 (p<0.0001, t4=15.30), Asb2 (p<0.0001, t4=25.35), Tmem119 (p=0.003, t4=6.721), Fscn1 (p<0.0001, t4=18.93), P2ry12 (p=0.733, t4=0.3659), and Fcrls (p=0.001, t4=10.31). Bar graphs show mean ± SEM, two-tailed unpaired t-test, n=3 wells of primary microglia cultures obtained from four 3mo mice. Experiment was independently reproduced 4 times.
Fig. 4
Fig. 4. H3K27me3 is associated with suppressed clearance genes in stMg
(a) Schematic showing isolation of cross-linked microglial nuclei from striatum/cerebellum for H3K27me3 ChIP-sequencing. (b) H3K27me3 enrichment at the transcriptional start site (TSS) of genes in adult stMg/cbMg is negatively correlated with stMg gene expression. Heatmaps (left) show the abundance of H3K27me3 (MACS, n=1 [25 mice]) ranked by log2 fold change (log2fc) of H3K27me3 ChIP over input in microglia nuclei at the TSS ± 5 kb of individual genes; (right) log2fc (DESeq2, n=2) of mRNAs from microglia-TRAP over their unbound fraction. stMg: p < 2.2e-16, r=-0.4002547; cbMg: p < 2.2e-16, r=-0.2161471; Pearson correlation. (c) H3K27me3 is differentially enriched at the TSS of genes in cbMg vs stMg. Scatter plot shows counts of H3K27me3 spanning the TSS ± 1kb for each gene in cbMg (x-axis) vs stMg (y-axis). cbMg- (orange) and stMg-enriched (purple) genes that are differentially enriched in H3K27me3 (MACS) in stMg and cbMg are depicted. (d) Genome browser views (IGV) of selected genes show normalized counts of H3K27me3+ chromatin at the TSS ± 1kb of the indicated genes in stMg/cbMg.
Fig. 5
Fig. 5. Selective effect of Eed inactivation on stMg and cbMg gene expression
(a) Schematic showing microglia-specific Eed deletion in adult mice. (b) H3K27me3 levels were quantified by Western blot analysis of isolated microglial nuclei (50,000 nuclei from n=3 mice/genotype) relative to total H3 (2 independent experiments). Representative blot (left, cropped to show the specific band); quantification (right). Ratio of intensities (ImageJ) from control, Cx3cr1CreErt2/+; Eef1a1LSL.eGFPL10a/+; Eedfl/+ (mean= 0.9245, SEM=0.04116), and mutant, Cx3cr1CreErt2/+(Litt) ; Eef1a1LSL.eGFPL10a/+; Eedfl/fl mice (mean=0.01006, SEM=0.00556). p < 0.0001, F=54.90, t4=22.02. Two-tailed unpaired t-test. (c) Quantification of the number of H3K27me3+ cells from control (microglia: mean= 96.50; non-microglia: mean=89.70) and mutant mice (microglia: mean=3.500; non-microglia: mean= 90.33). > 50 cells from n=2 mice/genotype. Bar graphs with individual data points show mean ± SEM. (d) H3K27me3 (red) in YFP/GFP+ microglia (green) using immunofluorescence of brain sections (DAPI: blue). Scale: 10 μm. Representative image is shown (2 independent experiments). Dotted circles: microglial nuclei. (e) Bar graph shows number of genes up-/down-regulated in Eed-deficient stMg at 3, 6, and 9 months by TRAP (DESeq2, n=2/region/genotype). Number of H3K27me3+ genes (red) is shown. (f) Principle Component Analysis (PCA) of stMg-/cbMg-TRAP-seq of 3mo/6mo/9mo Cx3cr1CreErt2/+;Eef1a1LSLeGFPL10a/+;Eedfl/fl and control, Cx3cr1CreErt2/+; Eef1a1LSLeGFPL10a/+; Eedfl/+ mice (n=2/genotype/age). (g,h) MA plots show gene expression changes (red: up; blue: down) caused by deletion of Eed in stMg (g) and cbMg (h) of 9mo mice (DESeq2, n=2/genotype). x-axis: log2 (mean expression); y-axis: log2 (fold change). Genes in green are equally expressed. Pie charts show the GO-based categories of up-regulated genes with selected genes named.
Fig. 6
Fig. 6. Eed deficiency in stMg induces cbMg-like clearance phenotype
(a,d) Left: Bar graphs show number of genes up-/down-regulated in 9mo Eed-deficient stMg (a) or cbMg (d) by TRAP (DESeq2, n=2/region/genotype/age). The number of dysregulated cbMg/stMg signature genes is indicated. Middle: Box-and-whisker plots show mean relative expression of the indicated dysregulated cbMg/stMg signature genes. One-way ANOVA (Kruskal-Wallis test) with Dunn’s Multiple Comparison. Right: Selected GO annotations (Enrichr) enriched for dysregulated cbMg/stMg signature genes. y-axis: -log10 (p-value). Dotted lines: p-value=0.05. (a) 44 cbMg signature genes that are up- (ctrl: min=-4.20, 25%=-0.88, median=-0.51, 75%=-0.30, max=-0.044; 3mo: min=-2.14, 25%=-0.35, median=-0.15, 75%=0.20, max=1.73; 6mo: min=-4.20, 25%=-0.38, median=-0.11, 75%=0.09, max=0.51; 9mo: min=0.46, 25%=0.59, median=0.77, 75%= 1.15, max= 6.68; p<0.0001, F=40.99, Kruskal-Wallis statistic=106.3) and 313 stMg signature genes that are down-regulated in Eed-deficient stMg (ctrl: min=-0.03, 25%=0.44, median=0.58, 75%=0.73, max=3.77; 3mo: min=-1.37, 25%=-0.15, median=0.056, 75%=0.31, max=2.13; 6mo: min=-1.417, 25%=-0.36, median=-0.22, 75%=-0.105, max=1.84; 9mo: min=-5.639, 25%=-0.58, median=-0.39, 75%=-0.26, max= 0.22;p < 0.0001, F=487.6, KWS=820.2). (d) 32 stMg signature genes up-regulated in 9mo Eed-deficient cbMg (ctrl: min=-5.50, 25%=-0.85, median=-0.52, 75%=-0.21, max=0.60; 3mo: min=-1.36, 25%=-0.57, median=-0.28, 75%=0.16, max=1.72 ; 6mo: min=-5.08, 25%=-0.891, median=-0.24, 75%=0.24, max=2.81; 9mo: min=0.39, 25%=0.84, median=1.137, 75%=1.895, max=5.77;p < 0.0001, F=26.62, KWS=64.91) and of 63 cbMg signature genes down-regulated in 9mo Eed-deficient cbMg (ctrl: min=0.517, 25%=1.03, median=1.35, 75%=2.23, max=6.84; 3mo: min=-3.075, 25%=-0.69, median=-0.24, 75%=0.20, max=1.68; 6mo: min=-4.696, 25%=-1.065, median=-0.40, 75%=-0.07, max=1.33; 9mo: min=-4.70, 25%=-1.17, median=-0.38, 75%=-0.199, max=0.33; p < 0.0001, F=79.43, KWS=135.7). (b,e) Heatmap with hierarchical clustering distances shows the variation in the expression levels (z-score) of cbMg/stMg signature genes that are dysregulated in 3 & 9mo Eed-deficient stMg (b) or cbMg (e) with control stMg and cbMg. (c,f) CD68+ lysosome content (red) in YFP+ microglia (green) from 12-month-old control, Cx3cr1CreErt2/+;Eedfl/+, and mutant, Cx3cr1CreErt2/+;Eedfl/fl, mice (DAPI: blue). Scale: 10 μm. Representative image (left); quantification of the lysosomal area/microglia area and number of primary processes (right). (c) Lysosomal content: Control: mean= 0.04169, SEM=0.004789; mutant: mean= 0.07056, SEM= 0.007284; p=0.0296, F=2.313, t4=3.312; 18 images from n=3/genotype. Number of primary processes (control: mean=5.514, SEM=0.3433; mutant: mean=4.989, SEM=0.1060; p=0.2174, F=10.49, t4=1.462) 20-25 cells from n=3 mice/genotype. (f) Lysosome area: Control: mean=0.1728, SEM=0.01556); mutant: mean=0.08600, SEM=0.01564; p=0.0334, F=1.485, t3=3.739 (16 images from n=3/genotype). Number of primary processes: Control: mean=2.889, SEM=0.2422; mutant: mean=3.940, SEM=0.2845; p=0.0481, F=1.380, t4=2.815. 20-25 cells from n=3 mice/genotype. (g) Quantification of cCASP3+ cells in the cerebellum. Control: mean=15.56, SEM=2.169; mutant: mean=22.25, SEM=1.239; p=0.0316, F=3.064, t7=2.679. 5-8 images from n=6 mice/genotype. Two-tailed unpaired t-test unless otherwise specified. Bar graph with individual data points shows mean ± SEM. *p ≤ 0.05, **p ≤ 0.01, ***p ≤ 0.001.
Fig. 7
Fig. 7. Microglia-specific Eed deficiency alters MSN morphology and MSN-controlled behaviors in mice
(a) Representative images of Golgi-stained neuronal processes of MSNs from 15-month-old control, Eedfl/fl, and Cx3cr1CreErt2/+;Eedfl/fl mice. Scale: 2 μm. Bar graph with individual data points shows total spine densities of MSNs of control (mean=1.205, SEM=0.04387) and mutant mice (mean= 1.009, SEM= 0.02326). p=0.0171, F=3.556, t4=3.932; 30 dendrites from n=3 mice/genotype. (b) Bar graph with individual data points shows the ratio of total distance traveled on day 7 versus day 1 of daily cocaine administration (control: mean=3.497, SEM=0.3380; mutant: mean= 2.356, SEM= 0.3833) p=0.0361, F=1.286, t22=2.232; n=12/genotype. (c) Open field analysis (thigmotaxis) shows mutant mice spend less time in the center vs periphery (mean=0.2138, SEM=0.03855) than control mice (mean=0.2714, SEM=0.03522) p=0.0459, F=4.110, t23=2.110, n=13/genotype. (d) Elevated plus maze analysis shows that mutant mice spend less time in the open arms (mean=60.09, SEM=5.765) than control mice (mean=31.77, SEM= 11.23) p=0.0279, F=3.415, MWU=18.00, SWp=0.0210; and more time in closed arms (mutant: mean=163.0, SEM=12.75; control: mean=207.5, SEM=14.09) p=0.0314, F=1.100, t17=2.346, n=10/genotype. Grubbs’ Test was used to identify and exclude an outlier. (e) Mutant mice develop seizures with age. Kaplan-Meier curve (n=12 mutant, 14 control mice; p=0.0002; χ2=13.71 log-rank Mantel–Cox test). Bar graphs with individual data points show mean ± SEM. All t-tests were two-tailed unpaired.

Comment in

References

    1. Dickstein DL, Weaver CM, Luebke JI, Hof PR. Dendritic spine changes associated with normal aging. Neuroscience. 2013;251:21–32. doi: 10.1016/j.neuroscience.2012.09.077. - DOI - PMC - PubMed
    1. O’Banion MK, Coleman PD, Callahan LM. Regional neuronal loss in aging and Alzheimer’s disease: a brief review. Seminars in Neuroscience. 1994;6:307–314. doi: 10.1006/smns.1994.1039. - DOI
    1. Woodruff-Pak DS, et al. Differential effects and rates of normal aging in cerebellum and hippocampus. Proceedings of the National Academy of Sciences. 2010;107:1624–1629. doi: 10.1073/pnas.0914207107. - DOI - PMC - PubMed
    1. Morterá P, Herculano-Houzel S. Age-related neuronal loss in the rat brain starts at the end of adolescence. Frontiers in Neuroanatomy. 2012;6:45. doi: 10.3389/fnana.2012.00045. - DOI - PMC - PubMed
    1. Mensah PL. Stability of large cell-medium cell clusters in the mature neostriatum. Experimental Brain Research. 1982;47:57–60. doi: 10.1007/BF00235886. - DOI - PubMed

Publication types

MeSH terms

Substances