. 2018 Sep;50(9):1296-1303.
doi: 10.1038/s41588-018-0175-z. Epub 2018 Jul 23.

Dynamic interplay between enhancer-promoter topology and gene activity

Affiliations

Dynamic interplay between enhancer-promoter topology and gene activity

Hongtao Chen et al. Nat Genet. 2018 Sep.

Abstract

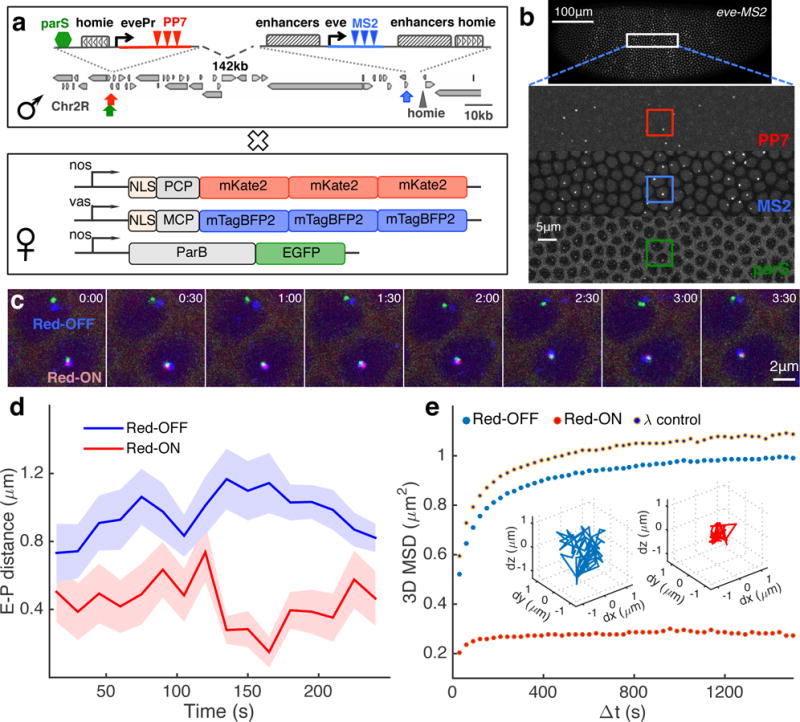
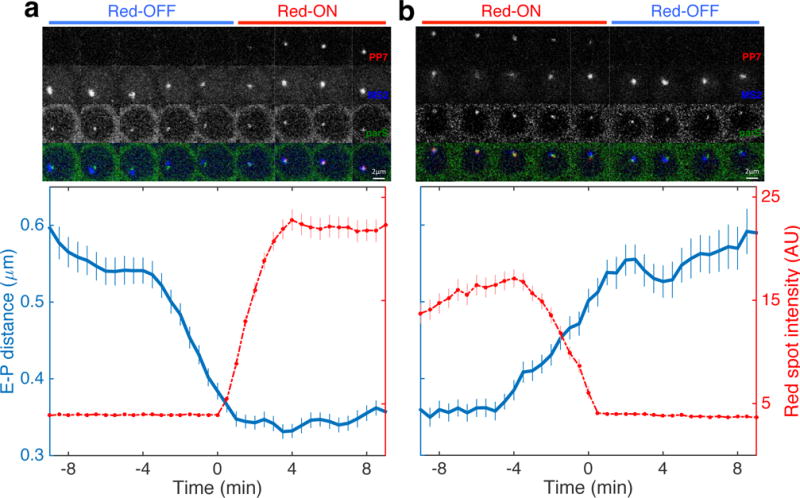
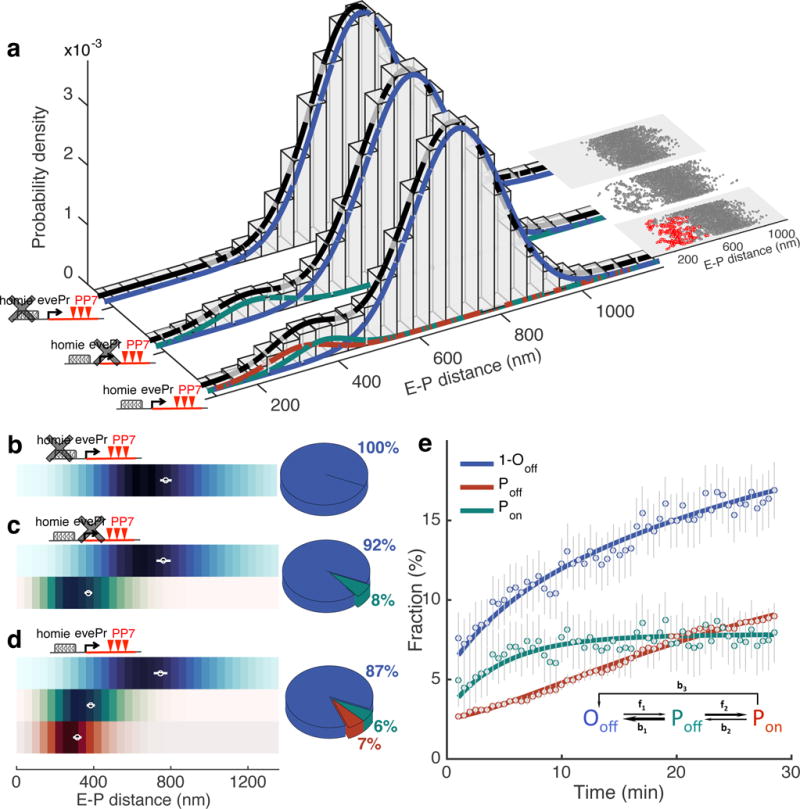
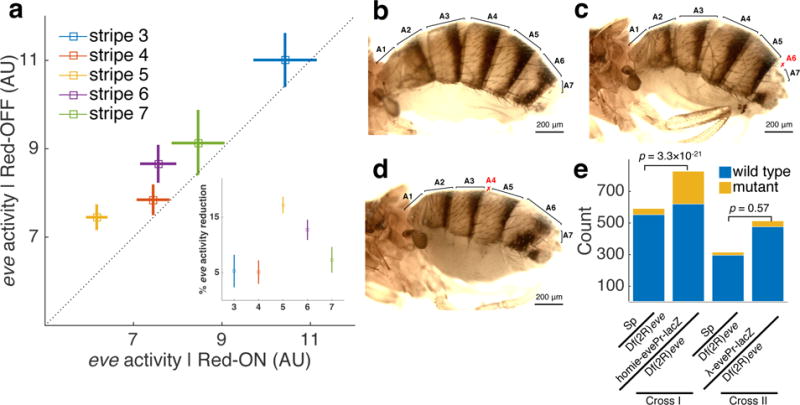
A long-standing question in gene regulation is how remote enhancers communicate with their target promoters, and specifically how chromatin topology dynamically relates to gene activation. Here, we combine genome editing and multi-color live imaging to simultaneously visualize physical enhancer-promoter interaction and transcription at the single-cell level in Drosophila embryos. By examining transcriptional activation of a reporter by the endogenous even-skipped enhancers, which are located 150 kb away, we identify three distinct topological conformation states and measure their transition kinetics. We show that sustained proximity of the enhancer to its target is required for activation. Transcription in turn affects the three-dimensional topology as it enhances the temporal stability of the proximal conformation and is associated with further spatial compaction. Furthermore, the facilitated long-range activation results in transcriptional competition at the locus, causing corresponding developmental defects. Our approach offers quantitative insight into the spatial and temporal determinants of long-range gene regulation and their implications for cellular fates.


Conflict of interest statement

Competing financial interests

The authors declare no competing financial interests.

Figures

Figure 1
Figure 1. Three-color live imaging of enhancer-promoter movement and transcriptional activity
a, Male flies carrying the modified eve locus are crossed with females carrying maternally expressed blue, red and green fluorescent proteins that are fused to MS2 coat protein (MCP), PP7 coat protein (PCP) and ParB DNA binding protein, respectively. In the male flies, a reporter with an eve promoter (evePr) driving PP7 transcription is integrated at −142 kb upstream of an MS2-tagged endogenous eve locus in the Drosophila genome. An ectopic homie insulator sequence is also included in the reporter in order to force loop formation through homie-homie pairing. Furthermore, a parS sequence is integrated near the homie-evePr-PP7 reporter. b, Snapshot of a representative embryo generated from crosses shown in a. The embryo displays fluorescent foci for MS2, PP7 and parS in the corresponding channels. c, 8 snapshots of a time course following two nuclei for ~4 min. The lower nucleus displays PP7 activity (Red-ON), the upper has none (Red-OFF). d, Instantaneous physical enhancer–promoter (E-P) distance between endogenous eve enhancers (blue signal) and the PP7 reporter (green signal) as a function of time for the Red-OFF and Red-ON nuclei in c. Error bar corresponds to measurement error estimated from the co-localization control experiments (see Supplementary Fig. 3). e, Population-averaged MSD calculated from E-P distance trajectories obtained from all Red-ON (n=720) and Red-OFF (n=7,163) nuclei, as well as for a control construct where homie in the reporter is replaced by phage λ DNA (λ control, n=1,453). Inset shows two representative trajectories for a Red-OFF nucleus (blue) and a Red-ON (red) nucleus, respectively.
Figure 2
Figure 2. Sustained physical enhancer–promoter proximity is necessary for productive transcription
a, Average transcription activity (red) and E-P distance (RMS distance between blue and green foci) as a function of time for 286 nuclei transitioning from the Red-OFF to Red-ON state. Time series for individual nuclei are aligned such that PP7 activity starts at 0 min, i.e. first occurrence of red signal. Top panel shows a series of raw images of a representative nucleus that transitions from Red-OFF to Red-ON (see also Supplementary Video 4). b, Average transcription activity and E-P distance as a function of time for 203 nuclei transitioning from Red-ON to Red-OFF. Time series for individual nuclei are aligned such that PP7 activity ends at 0 min, i.e. disappearance of red signal. The top panel shows a series of raw images of a representative nucleus that transitions from Red-ON to Red-OFF (see also Supplementary Video 4). All error bars are standard errors of the mean.
Figure 3
Figure 3. Characterization of topological enhancer-promoter conformations, the kinetic transitions between them, and their relation to transcriptional activation
a, E-P distance distribution for three experimental constructs: parS-homie-evePr-PP7 (n=265,277 RMS E-P distances from 7,883 trajectories in 84 embryos), parS-homie-noPr-PP7 (n=81,629 RMS E-P distances from 2,566 trajectories in 29 embryos) and parS-λ-evePr-PP7 (n=49,587 RMS E-P distances from 1,453 trajectories in 15 embryos). A 5-min sliding window along each time trace is used to calculate RMS E-P distances. Gaussian mixture models for all RMS samples are shown with black curves for each construct. Gaussian mixture models for RMS samples in which PP7 is not active are shown with blue (larger mean) and green (smaller mean) curves. Red curve is Gaussian fitting for all RMS distance samples accompanied by continuous PP7 transcription. Insets show scatter plots of RMS distance from one representative embryo for each construct. Each data point is a time-averaged RMS distance. Red points indicate continuous PP7 transcription across the window. b-d, Distribution of instantaneous E-P distance for E-P topological states classified as Ooff (blue), Poff (green) or Pon (red) for parS-λ-evePr-PP7 (b), parS-homie-noPr-PP7 (c) and parS-homie-evePr-PP7 (d). Means±STD of RMS distance calculated from individual embryos shown as white circles with bars. Adjacent pie charts show the fraction of each E-P topological state. See also Supplementary Fig. 8. e, Fraction of each topological state for the parS-homie-evePr-PP7 construct as a function of developmental time, starting 25 min into nc14. Error bars are bootstrapped standard errors of state fractions. Solid lines are fits derived from kinetic parameters obtained from MCMC (Markov Chain Monte Carlo) inference. Inset shows the kinetic model capturing the transitions between the three topological states; arrow widths represent transition time scales (wider arrows correspond to faster rates, see Supplementary Fig. 9 for values).
Figure 4
Figure 4. Long-distance-mediated promoter competition results in patterning phenotypes
a, Endogenous eve-MS2 activity in nuclei that also display PP7 reporter activity (x-axis) is lower than in the neighboring nuclei where PP7 is not expressed (y-axis). Means±SEMs (n=45, 106, 143, 85 and 27 PP7 expressing nuclei for stripe 3-7, respectively). Inset: Reduction in eve-MS2 activity for each stripe. Error bars are bootstrapped standard errors of the percentage reduction. b-d, Adult wild-type (b) and mutant (c, d) flies from crosses between Sp/homie-evePr-lacZ males and CyO/Df(2R)eve females. c and d show defects in abdominal segments A4 and A6, respectively, resulting from reduced eve activity in stripe 5 and stripe 6, respectively. Abdominal segments are labeled, with defective segments marked in red. e, Results of phenotype scoring. Mutant counts include both A4 and A6 phenotypes. Cross I: single Sp/homie-evePr-lacZ males were crossed with CyO/Df(2R)eve females, and scoring results from 47 individual vials were summed. Cross II: single Sp/λ-evePr-lacZ males were crossed with CyO/Df(2R)eve females, and results from 23 individual vials were summed. P-values are from one-tailed Fisher’s exact test.

References

    1. Benoist C, Chambon P. In vivo sequence requirements of the SV40 early promotor region. Nature. 1981;290:304–10. - PubMed
    1. Levine M. Transcriptional enhancers in animal development and evolution. Curr Biol. 2010;20:R754–63. - PMC - PubMed
    1. Long HK, Prescott SL, Wysocka J. Ever-Changing Landscapes: Transcriptional Enhancers in Development and Evolution. Cell. 2016;167:1170–1187. - PMC - PubMed
    1. Buecker C, Wysocka J. Enhancers as information integration hubs in development: lessons from genomics. Trends Genet. 2012;28:276–84. - PMC - PubMed
    1. Kim TK, Shiekhattar R. Architectural and Functional Commonalities between Enhancers and Promoters. Cell. 2015;162:948–59. - PMC - PubMed

Publication types