. 2018 Jul 3;9(51):29772-29788.
doi: 10.18632/oncotarget.25710.

TRAF3IP2, a novel therapeutic target in glioblastoma multiforme

Affiliations

TRAF3IP2, a novel therapeutic target in glioblastoma multiforme

Eckhard U Alt et al. Oncotarget. .

Abstract

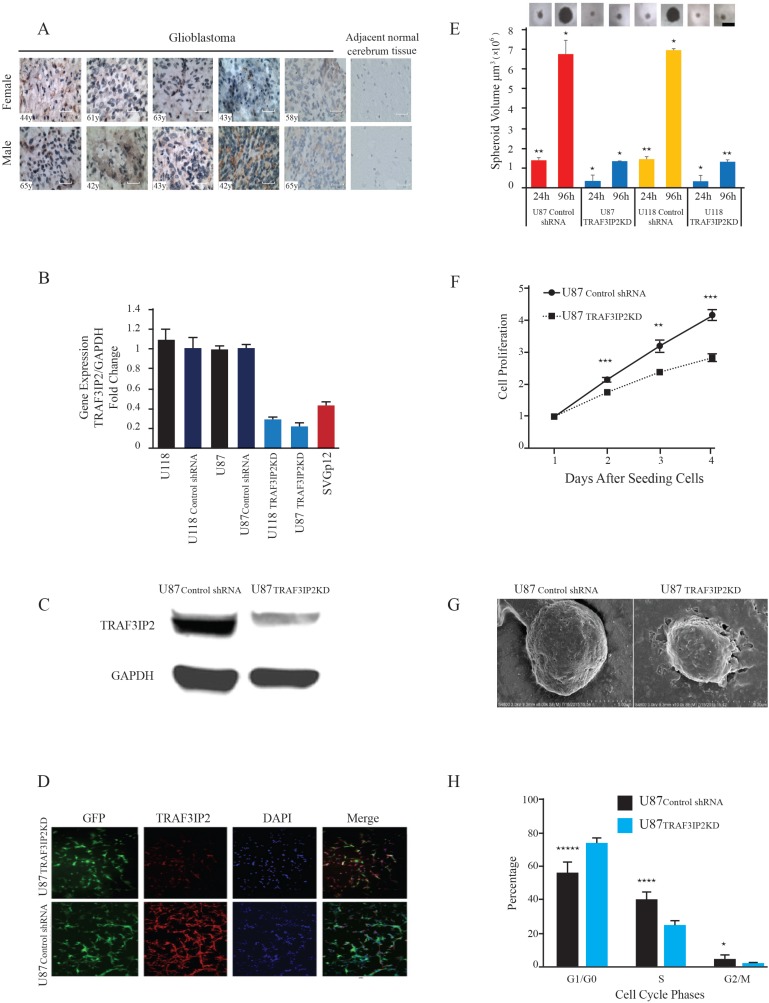
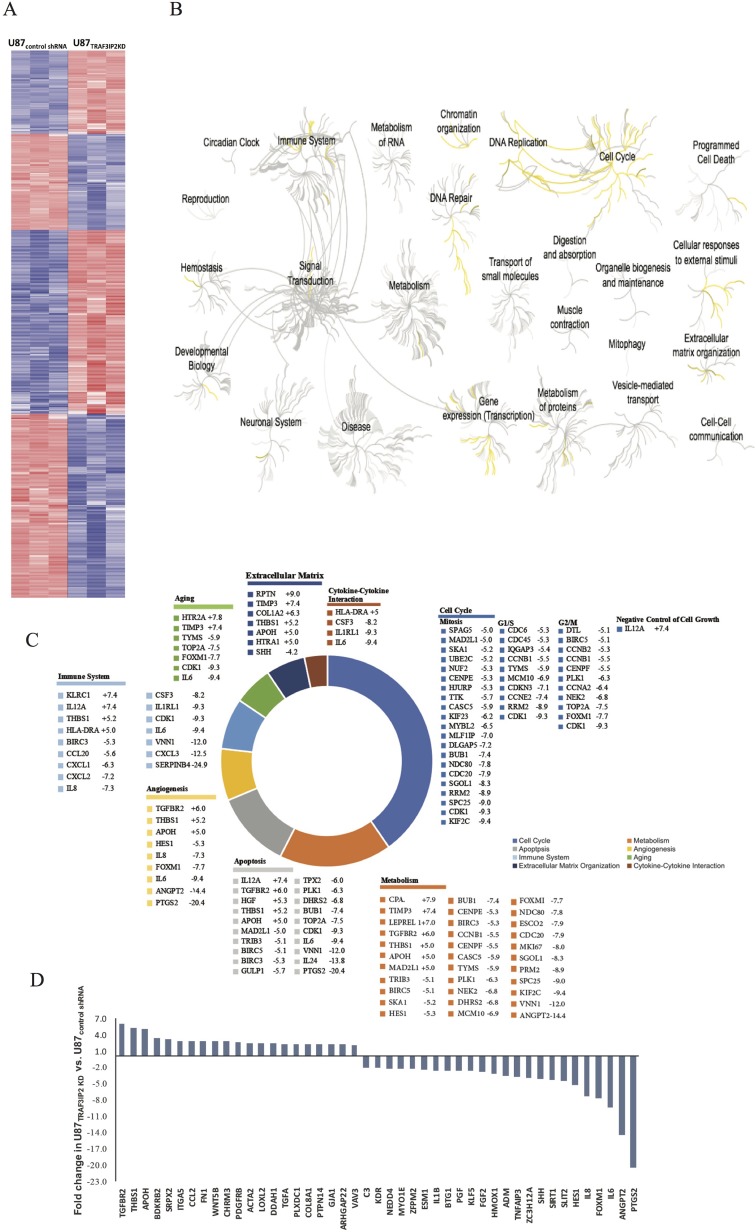
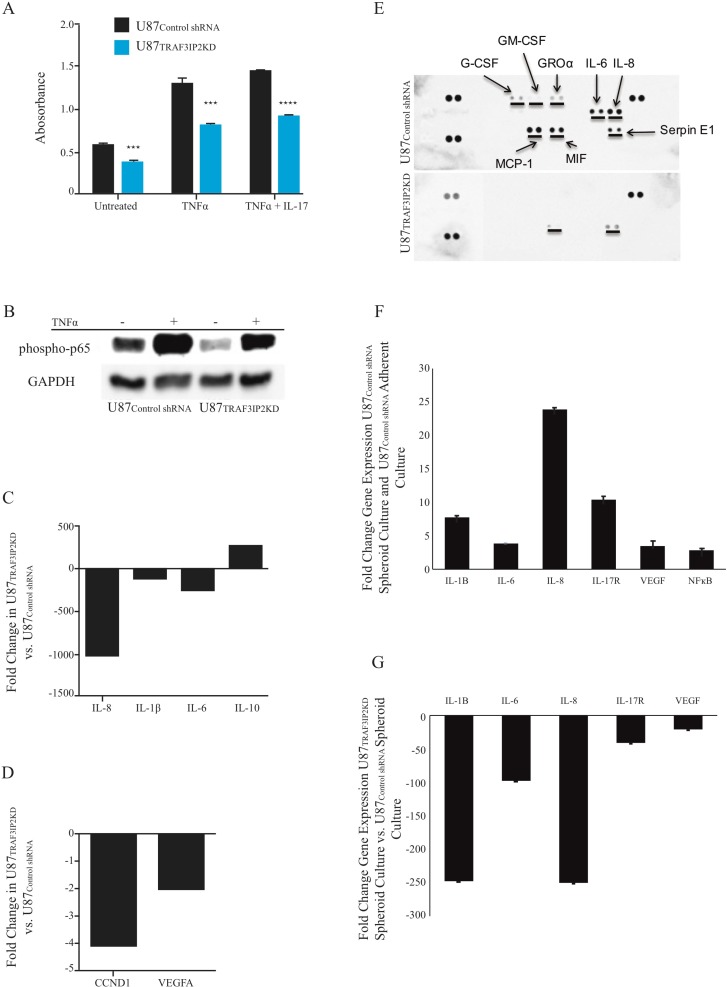
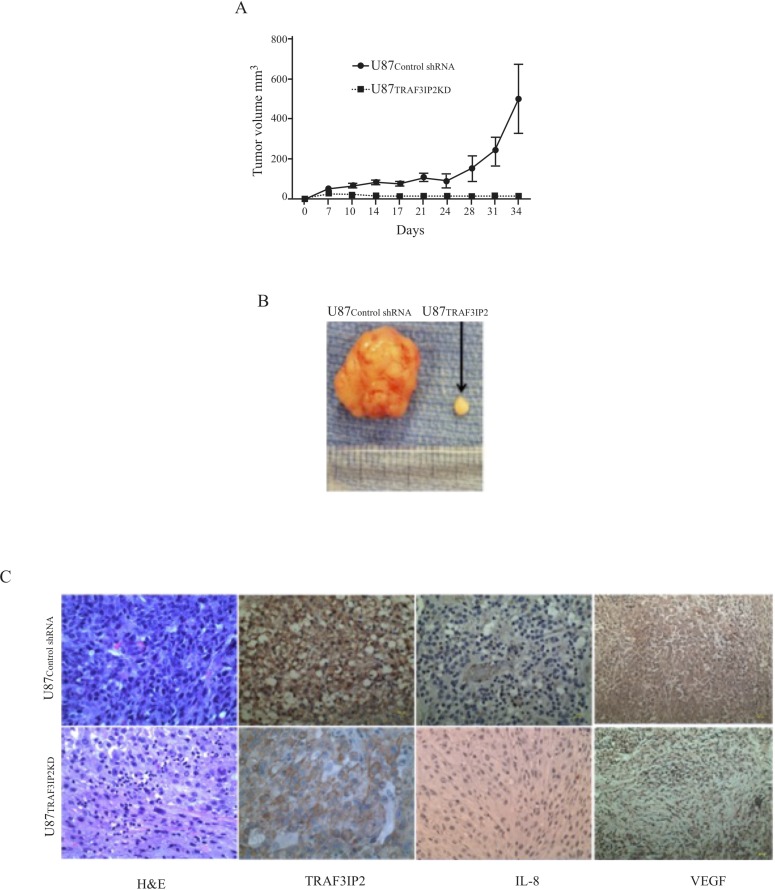
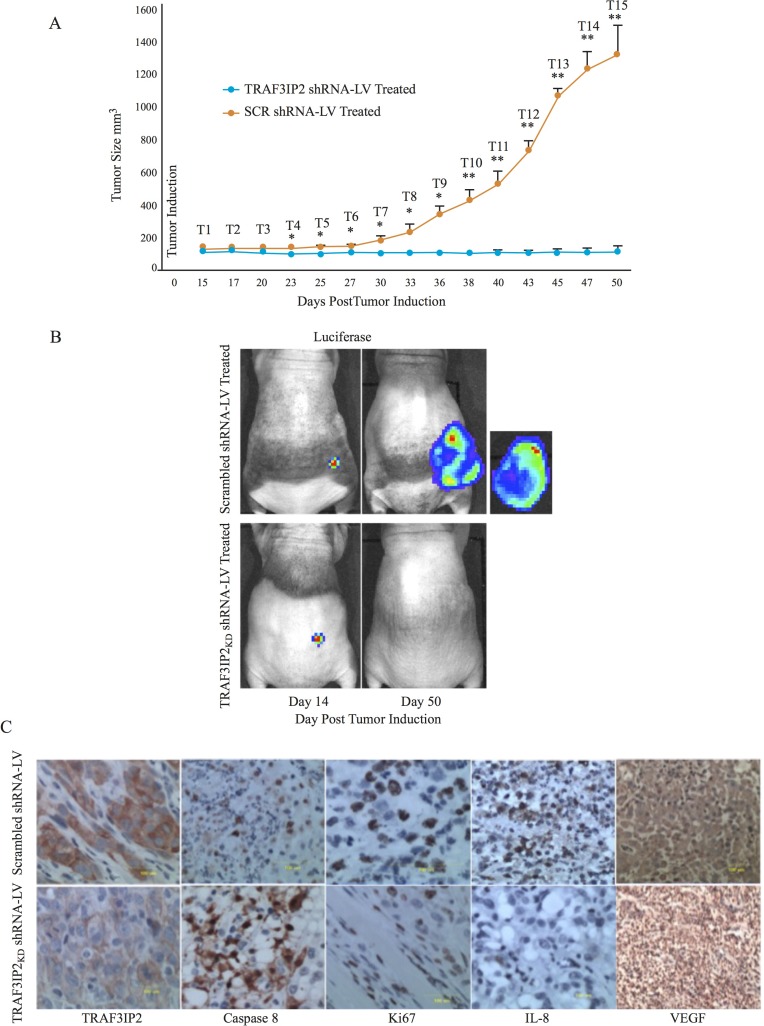
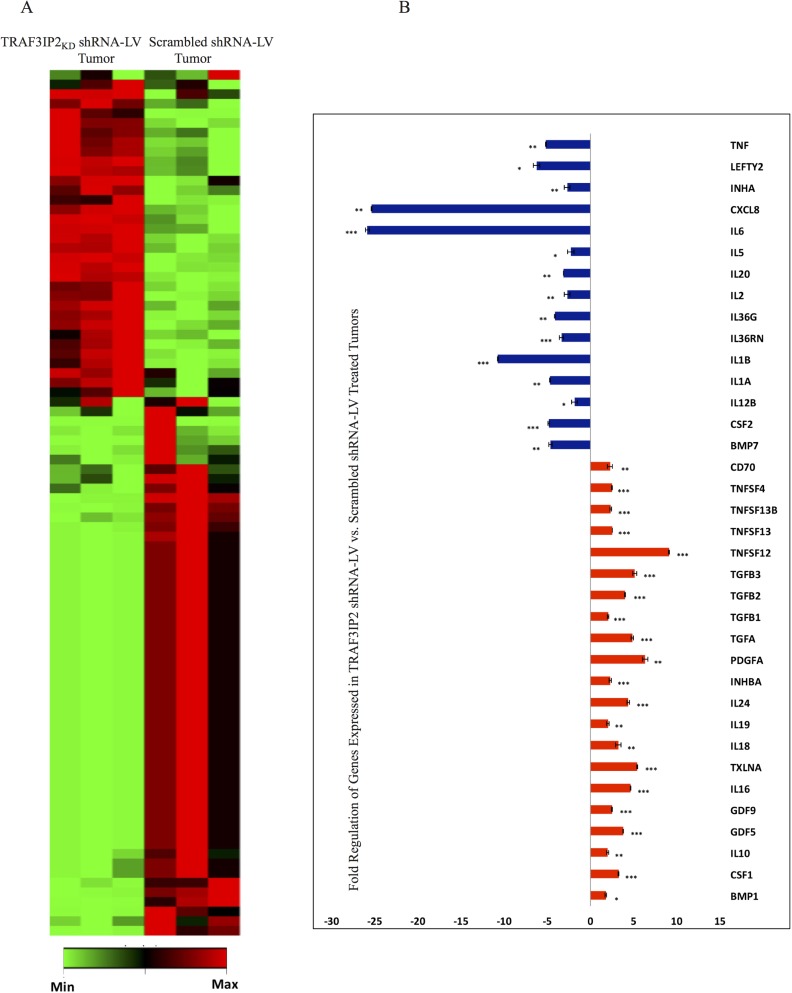
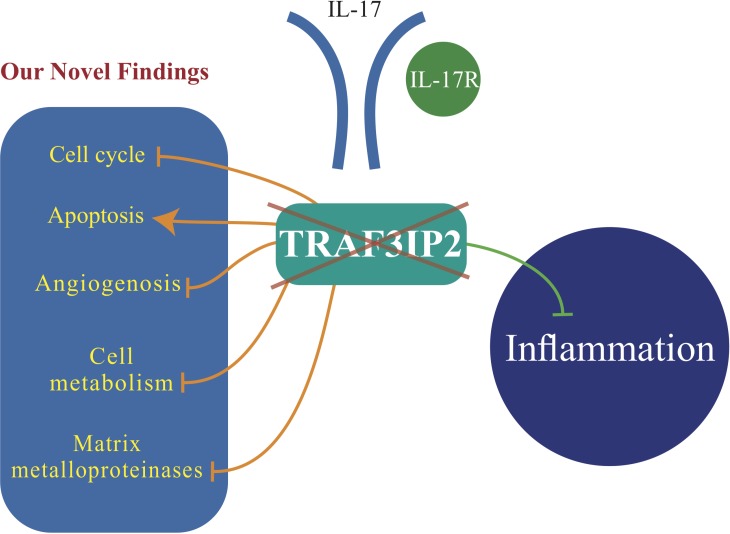
Glioblastoma multiforme (glioblastoma) remains one of the deadliest cancers. Pro-inflammatory and pro-tumorigenic mediators present in tumor microenvironment (TME) facilitate communication between tumor cells and adjacent non-malignant cells, resulting in glioblastoma growth. Since a majority of these mediators are products of NF-κB- and/or AP-1-responsive genes, and as TRAF3 Interacting Protein 2 (TRAF3IP2) is an upstream regulator of both transcription factors, we hypothesized that targeting TRAF3IP2 blunts tumor growth by inhibiting NF-κB and pro-inflammatory/pro-tumorigenic mediators. Our in vitro data demonstrate that similar to primary glioblastoma tumor tissues, malignant glioblastoma cell lines (U87 and U118) express high levels of TRAF3IP2. Silencing TRAF3IP2 expression inhibits basal and inducible NF-κB activation, induction of pro-inflammatory mediators, clusters of genes involved in cell cycle progression and angiogenesis, and formation of spheroids. Additionally, silencing TRAF3IP2 significantly increases apoptosis. In vivo studies indicate TRAF3IP2-silenced U87 cells formed smaller tumors. Additionally, treating existing tumors formed by wild type U87 cells with lentiviral TRAF3IP2 shRNA markedly regresses their size. Analysis of residual tumors revealed reduced expression of pro-inflammatory/pro-tumorigenic/pro-angiogenic mediators and kinesins. In contrast, the expression of IL-10, an anti-inflammatory cytokine, was increased. Together, these novel data indicate that TRAF3IP2 is a master regulator of malignant signaling in glioblastoma, and its targeting modulates the TME and inhibits tumor growth by suppressing the expression of mediators involved in inflammation, angiogenesis, growth, and malignant transformation. Our data identify TRAF3IP2 as a potential therapeutic target in glioblastoma growth and dissemination.

Keywords: TRAF3IP2; cancer stem cells; glioblastoma multiforme; inflammation; tumor microenvironment.


Conflict of interest statement

CONFLICTS OF INTEREST The authors declare no competing interests.

Figures

Figure 1
Figure 1. TRAF3IP2 expression in human glioblastoma tumor tissues and glioblastoma cell lines
(A) TRAF3IP2 expression (brown) was localized by IHC. Hematoxylin was used as a counterstain (blue). Images representing glioblastoma tumor tissues from ten independent subjects are shown (5 females and 5 males, age of each subject is indicated on the image). The right panels show the images representing lack of TRAF3IP2 expression in adjacent non-tumor tissues. Scale bar, 100 μm. (B) TRAF3IP2 knockdown in U87 and U118 cells. TRAF3IP2 mRNA expression in U118, U118control shRNA, U87, U87control shRNA, U118TRAF3IP2 KD, U87TRAF3IP2 KD, and SVG p12 cells was analyzed by RT-qPCR. Results were normalized to values obtained in U87 and U118 cells respectively (n = 9/cell type; P < 0.05). (C) Western blot analysis of TRAF3IP2 expression in U87TRAF3IP2 KD and U87control shRNA cells. (D) Immunofluorescent detection of GFP (green) and TRAF3IP2 (red) in U87TRAF3IP2 KD (top panels) and U87control shRNA cells (bottom panels), counterstained with DAPI (blue) to visualize nuclei. Scale bar, 100 µm. (E) Effect of silencing TRAF3IP2 on sphere forming ability of U87TRAF3IP2 KD, U118TRAF3IP2 KD, U87control shRNA, U118control shRNA. Cells were incubated in sphere media for up to 96 hours. 20 spheroids/cell type were randomly selected for measurement at 24 and 96h time points. The spheres were imaged using a Nikon microscope. Spheroid diameters were measured using a microscope, and volumes computed (*P < 0.05; **P < 0.01). (F) Analysis of U87TRAF3IP2 KD and U87control shRNA cell proliferation by XTT assay. Statistically significant differences at every time point; **P < 0.01; ***P < 0.001. (G) Silencing TRAF3IP2 alters cell morphology. Morphology of U87TRAF3IP2 KD and U87control shRNA cells analyzed by uranyl acetate staining and viewed under electron microscopy (scale bar represents 500 nm). (H) Silencing TRAF3IP2 alters cell cycle profile. Mean and SEM of relative numbers of cells in G0/G1, S-Phase and G2/M phase of U87TRAF3IP2 KD and U87control shRNA cells (*P < 0.05; ***P < 0.001; ****P < 0.0001, n = 18).
Figure 2
Figure 2. Differential gene expression in U87TRAF3IP2 KD and U87control shRNA cells
(A) Hierarchical clustering displayed genes differentially expressed in U87TRAF3IP2 KD and U87control shRNA cells. The extent of blue (decreased fold change) or red (increased fold change) color is directly proportional to the magnitude of differential expression of these genes. (B) Reactome (http://reactome.org/) was used for Gene Ontology Tree, representing functional characterization of genes differentially expressed in U87TRAF3IP2 KD cells and U87control shRNA cells in comparition to the number (and significance) of gene ontologies and shows a dendrogram comparison of gene ontology (biological process) specifically differential between U87TRAF3IP2 KD cells and U87control shRNA cells. Yellow, ontologies enriched in U87TRAF3IP2 KD cells; gray, ontologies not affected in U87TRAF3IP2 KD cells. Inset, the top four biological processes hit. Of particular interest is the specific and significant enrichment of proteins involved in cell cycle, DNA replication, immune system, programmed cell death, cellular responses to external stimuli, extracellular matric organization, DNA repair and metabolism. (C) Pathway analysis (using Reactome) of a cluster of 1297 perturbed gene expressions in U87TRAF3IP2 KD cells revealed a statistically significant preponderance of genes involved in cell cycle, metabolism, apoptosis, angiogenesis, immune system, aging, extracellular matrix organization, and cytokine-cytokine interaction. The chart displays genes representative of each pathway displaying greater than 5-fold change in U87TRAF3IP2 KD versus U87control shRNA cells (P < 0.05). (D) Fold change expression of perturbed genes involved in angiogenesis in U87TRAF3IP2 KD versus U87control shRNA cells (P < 0.05).
Figure 3
Figure 3. Silencing TRAF3IP2 inhibits NF-κB activation and inflammatory cytokine expression in malignant glioblastoma cells
(A) p-p65 levels were analyzed by ELISA. Silencing TRAF3IP2 inhibits TNF-α or TNF-α+IL-17-induced p-p65 levels in U87TRAF3IP2KD and U87control shRNA cells. (B) Western blot analysis demonstrating significantly reduced p-p65 levels in U87TRAF3IP2 KD versus U87control shRNA cells. U87TRAF3IP2 KD and U87control shRNA cells showed higher expression of p-p65 after TNF-α treatment. However, the magnitude of increase is less in U87TRAF3IP2KD cells. (C and D) RT2-qPCR analysis: fold changes of U87TRAF3IP2KD versus U87control shRNA cells for IL-8, IL-1β, IL-6, IL-10, CCND1 and VEGF. (E) Dot-blot comparative protein analysis of conditioned media from U87TRAF3IP2KD cells showing decreased expression of G-CSF, GM-CSF, GRO, IL-6, IL-8, MCP-1 and MIF compared to U87control shRNA cells. Protein levels of G-CSF, GM-CSF, GRO, IL-6, IL-8 and MCP-1 were below the detection limit in U87TRAF3IP2KD cells conditioned media. (F) RT-qPCR analysis: fold changes expression of upstream (IL-17R) and downstream (NF-κB, IL-1β, IL-6, and IL-8, in addition to VEGF) signaling of TRAF3IP2 in U87 spheroids compared to adherent U87 cultures. (G) Gene expression analysis of U87TRAF3IP2KD versus U87control shRNA spheroids (n = 6; *P < 0.05, **P < 0.001, ***P < 0.0001).
Figure 4
Figure 4. Silencing TRAF3IP2 prevents glioblastoma growth
(A) Immunodeficient NIH-III mice were injected with U87TRAF3IP2KD cells (1 × 10⁶ cells) into the flank region. Control animals were injected with U87control shRNA cells (1 × 10⁶ cells). Tumor size was measured weekly using calipers. (B) U87TRAF3IP2KD cells formed smaller tumors. (C) Immunohistochemical localization of TRAF3IP2, IL-8, and VEGF in tumors derived from U87TRAF3IP2KD and U87control shRNA cells. Scale: 100 µm.
Figure 5
Figure 5. Effect of silencing TRAF3IP2 in a flank xenograft model
(A) Suppression of glioblastoma tumors by TRAF3IP2 shRNA-LV injected subcutaneously onto tumors compared to scrambled shRNA-LV injected tumors. Frequency of administration is shown in the graph. (B) Tumor size was measured biweekly (*P < 0.05; **P < 0.001). (C) Animals imaged for luciferase weekly. Immunohistochemical localization of TRAF3IP2, caspase 8, Ki67, IL-8, and VEGF in tumors treated with TRAF3IP2 shRNA-LV or scrambled shRNA-LV. Scale: 100 µm.
Figure 6
Figure 6. Transcriptome analysis of TRAF3IP2 shRNA-LV-treated xenograft tumors
(A) Clustergram of genes analyzed by RT2-based PCR array. Xenograft glioblastoma tumors treated with TRAF3IP2 shRNA-LV were compared with scrambled shRNA-LV treated tumors (n = 3/group). (B) Clustering performed using data analysis software (Qiagen). Intensity of green (decreased fold change) or red (increased fold change) is directly proportional to the magnitude of differentially expressed genes. Expression of genes displaying a +/− 2-fold change in TRAF3IP2 shRNA-LV-treated xenograft tumors. Values normalized to scrambled shRNA-LV treated tumors (*P < 0.05; **P < 0.01; ***P < 0.001).
Figure 7
Figure 7. TRAF3IP2 is a potential therapeutic target in glioblastoma growth and dissemination
In addition to blocking inflammation (green line), our novel findings show that silencing TRAF3IP2 inhibits cell cycle progression, angiogenesis, cell metabolism, and matrix metalloproteinase expression, while increasing apoptosis of glioblastoma cells (orange lines), resulting ultimately in tumor regression, and possibly elimination.

References

    1. Stupp R, Mason WP, van den Bent MJ, Weller M, Fisher B, Taphoorn MJ, Belanger K, Brandes AA, Marosi C, Bogdahn U, Curschmann J, Janzer RC, Ludwin SK, et al. Radiotherapy plus concomitant and adjuvant temozolomide for glioblastoma. N Engl J Med. 2005;352:987–96. doi: 10.1056/NEJMoa043330. - DOI - PubMed
    1. Ilmer M, Vykoukal J, Recio Boiles A, Coleman M, Alt E. Two sides of the same coin: stem cells in cancer and regenerative medicine. FASEB J. 2014;28:2748–61. doi: 10.1096/fj.13-244640. - DOI - PubMed
    1. Welte G, Alt E, Devarajan E, Krishnappa S, Jotzu C, Song YH. Interleukin-8 derived from local tissue-resident stromal cells promotes tumor cell invasion. Mol Carcinog. 2012;51:861–8. doi: 10.1002/mc.20854. - DOI - PubMed
    1. Devarajan E, Song YH, Krishnappa S, Alt E. Epithelial-mesenchymal transition in breast cancer lines is mediated through PDGF-D released by tissue-resident stem cells. Int J Cancer. 2012;131:1023–31. doi: 10.1002/ijc.26493. - DOI - PubMed
    1. Jotzu C, Alt E, Welte G, Li J, Hennessy BT, Devarajan E, Krishnappa S, Pinilla S, Droll L, Song YH. Adipose tissue-derived stem cells differentiate into carcinoma-associated fibroblast-like cells under the influence of tumor-derived factors. Anal Cell Pathol (Amst) 2010;33:61–79. doi: 10.3233/ACP-CLO-2010-0535. - DOI - PMC - PubMed