. 2018 Sep 7;293(36):13974-13988.
doi: 10.1074/jbc.RA118.003541. Epub 2018 Jul 24.

Perilipin 1 (Plin1) deficiency promotes inflammatory responses in lean adipose tissue through lipid dysregulation

Affiliations

Perilipin 1 (Plin1) deficiency promotes inflammatory responses in lean adipose tissue through lipid dysregulation

Jee Hyung Sohn et al. J Biol Chem. .

Abstract

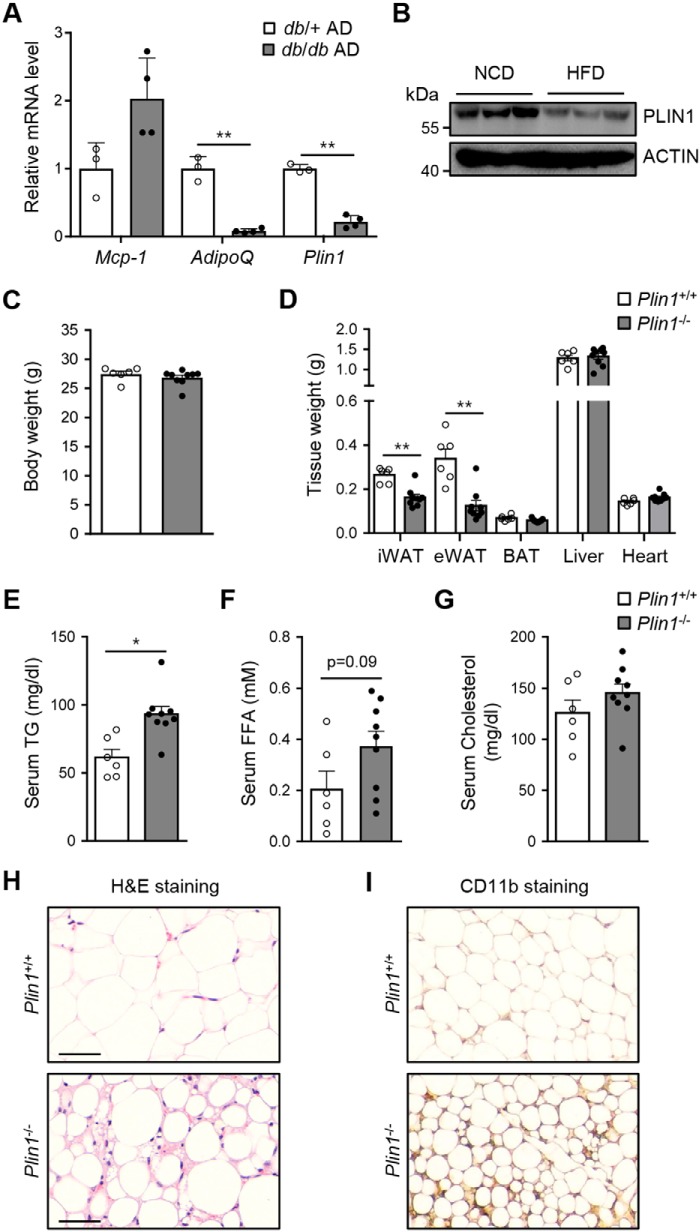
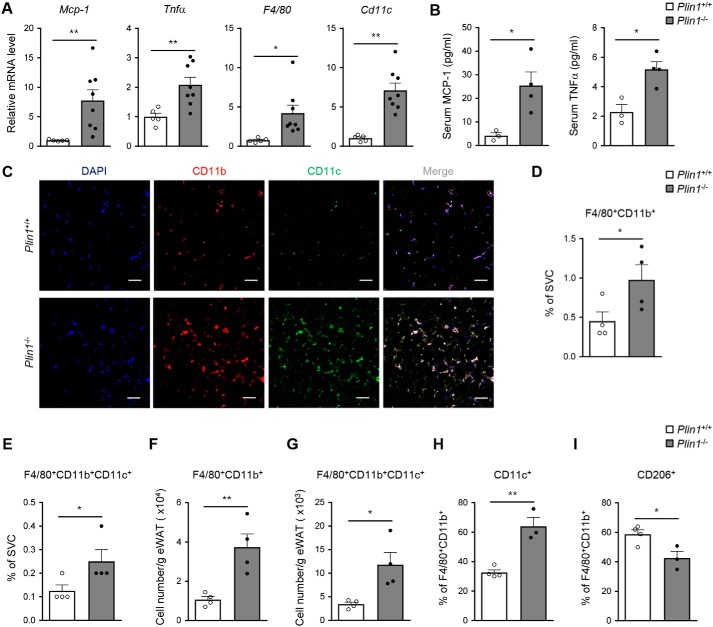
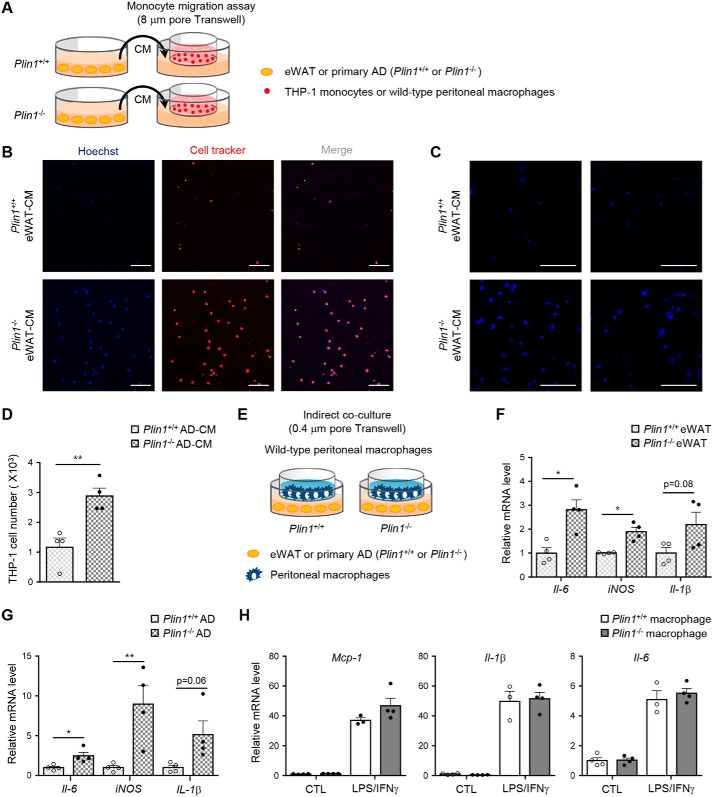
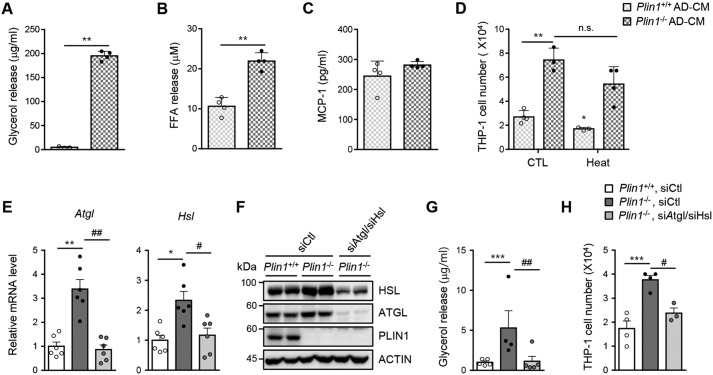
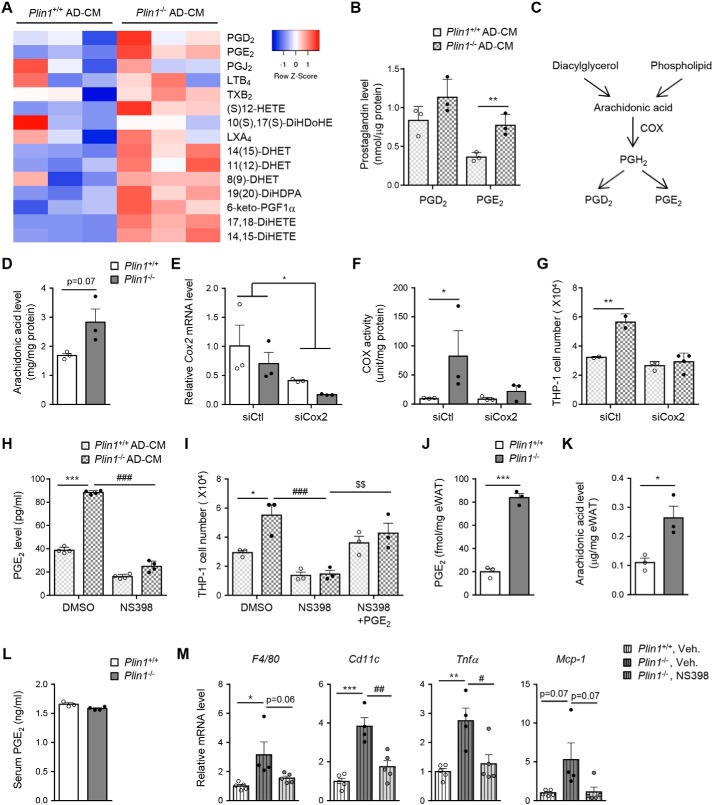
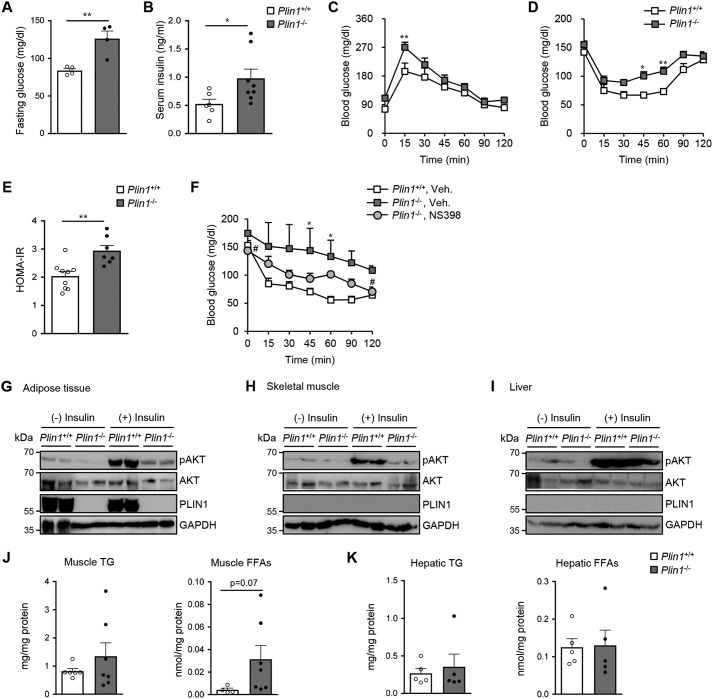
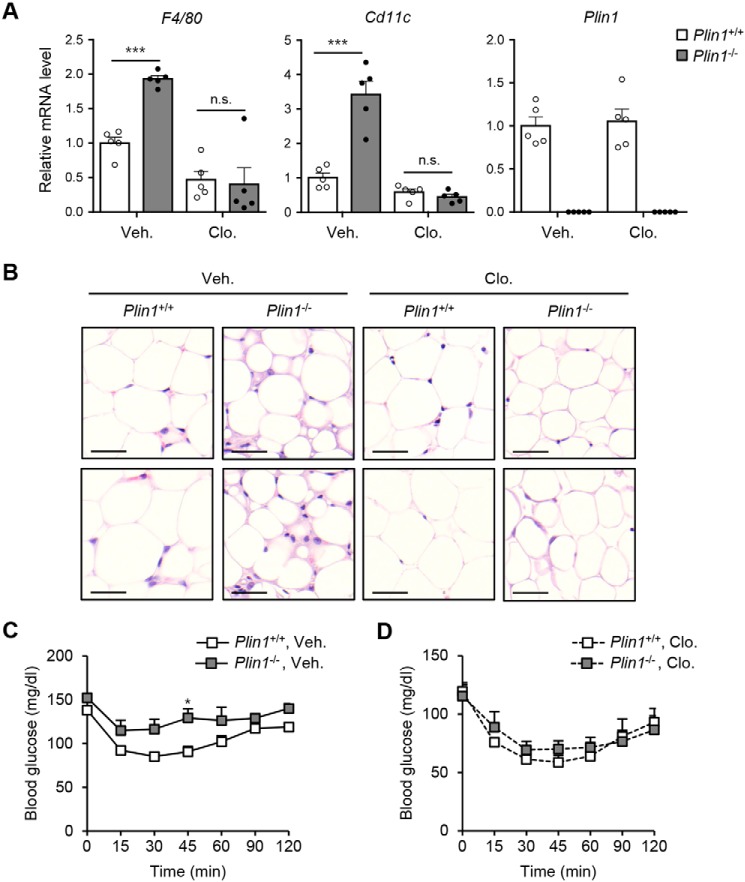
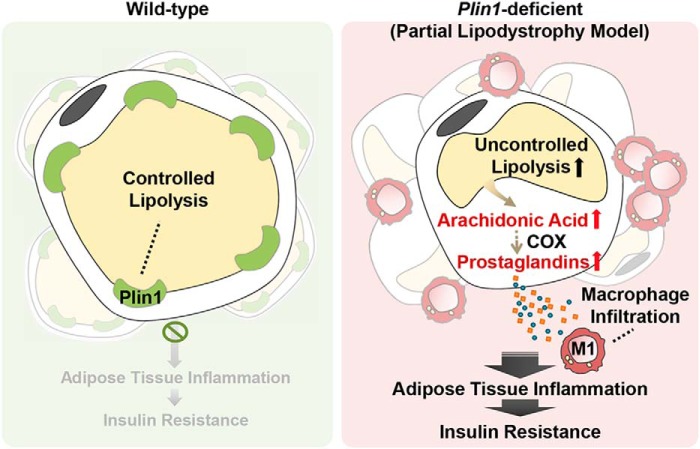
Lipid droplets are specialized cellular organelles that contain neutral lipid metabolites and play dynamic roles in energy homeostasis. Perilipin 1 (Plin1), one of the major lipid droplet-binding proteins, is highly expressed in adipocytes. In mice, Plin1 deficiency impairs peripheral insulin sensitivity, accompanied with reduced fat mass. However, the mechanisms underlying insulin resistance in lean Plin1 knockout (Plin1-/-) mice are largely unknown. The current study demonstrates that Plin1 deficiency promotes inflammatory responses and lipolysis in adipose tissue, resulting in insulin resistance. M1-type adipose tissue macrophages (ATMs) were higher in Plin1-/- than in Plin1+/+ mice on normal chow diet. Moreover, using lipidomics analysis, we discovered that Plin1-/- adipocytes promoted secretion of pro-inflammatory lipid metabolites such as prostaglandins, which potentiated monocyte migration. In lean Plin1-/- mice, insulin resistance was relieved by macrophage depletion with clodronate, implying that elevated pro-inflammatory ATMs might be attributable for insulin resistance under Plin1 deficiency. Together, these data suggest that Plin1 is required to restrain fat loss and pro-inflammatory responses in adipose tissue by reducing futile lipolysis to maintain metabolic homeostasis.

Keywords: Plin1; adipocyte; adipose tissue inflammation; adipose tissue macrophage; insulin resistance; lipid metabolism; lipolysis; prostaglandin.


Conflict of interest statement

The authors declare that they have no conflicts of interest with the contents of this article

Figures

Figure 1.
Figure 1.
Plin1−/− mice show hypotrophy of adipose tissue with elevated macrophages. A, expression levels of Plin1 mRNA in adipocytes (AD) of db/+ and db/db mice were determined by qRT-PCR. **, p < 0.01 versus db/+ group by Student's t test. B, C57BL/6J mice were fed NCD or high fat diet (HFD) for 20 weeks. eWAT were obtained and subjected to immunoblot analysis using anti-PLIN1 and anti-ACTIN antibodies. C–G, body weight (C), the weights of various tissues (D), and the levels of serum TG (E), serum FFAs (F), and serum cholesterol (G) from Plin1+/+ and Plin1−/− mice were measured. H, adipocyte morphology of eWAT from Plin1−/− and Plin1+/+ mice was assessed by hematoxylin and eosin (H&E) staining. Scale bars, 50 μm. I, myeloid cells were detected in eWAT from Plin1+/+ and Plin1−/− mice by diaminobenzidine staining with an anti-mouse CD11b antibody. ×100 magnification. All data represent the mean ± S.E. *, p < 0.05; **, p < 0.01 versus Plin1+/+ group by Student's t test.
Figure 2.
Figure 2.
Adipose tissue inflammation is enhanced in Plin1−/− mice. A, relative mRNA levels of inflammatory cytokine genes (Mcp-1 and Tnfα) and macrophage markers (F4/80 and Cd11c) were measured in eWAT by qRT-PCR. B, serum levels of MCP-1 and TNFα were assessed by ELISA. C, macrophage accumulation was detected in eWAT from Plin1+/+ and Plin1−/− mice by immunohistochemistry analysis of the nuclei (blue), CD11b (red), and CD11c (green). Scale bars, 50 μm. D–I, macrophage accumulation was measured in eWAT by flow cytometric analysis. The percentages of F4/80+CD11b+ (D) and F4/80+CD11b+CD11c+ (E) cells in the SVCs of eWAT are shown in the graphs. Total numbers of F4/80+CD11b+ (F) and F4/80+CD11b+CD11c+ (G) cells in SVCs/g of eWAT were determined. Percentages of CD11c+ (H) and CD206+ (I) cells in the F4/80+CD11b+ cells were measured. All data represent the mean ± S.E. *, p < 0.05; **, p < 0.01 versus Plin1+/+ group by Student's t test. All qRT-PCR data were normalized to the mRNA level of cyclophilin.
Figure 3.
Figure 3.
Plin1−/− adipocytes enhance monocyte migration and macrophage activation. A, eWAT or primary adipocytes from Plin1+/+ and Plin1−/− mice were incubated with culture medium for 48 h. Collected CM was tested for Transwell culture. THP-1 monocytes were prestained with CellTracker (red), and incubated for 6 h in Transwell plates (8 μm pore size) with CM. Peritoneal macrophages were incubated with CM for 6 h, and stained with Hoechst (blue). Migrated monocytes (B) or macrophages (C) upon incubation with eWAT CM were assessed by confocal microscope. Scale bars, 100 μm. D, the number of migrated cells upon incubation with primary adipocytes CM was measured. E, peritoneal macrophages were co-cultured with chopped eWAT or primary adipocytes of Plin1+/+ and Plin1−/− mice in Transwell plates (0.4 μm pore) for 48 h. Total RNA was isolated from peritoneal macrophages co-cultured with eWAT (F) or primary adipocytes (G) for determining the mRNA levels of Il-6, iNOS, and Il-1β. H, peritoneal macrophages were treated 17 h with LPS (5 ng/ml) and interferon (IFN) γ (100 units/ml) and subjected to qRT-PCR to determine the expression of the indicated inflammatory genes. All data represent the mean ± S.E. *, p < 0.05; **, p < 0.01 versus Plin1+/+ group by Student's t test. All qRT-PCR data were normalized to the mRNA level of cyclophilin. AD, adipocytes.
Figure 4.
Figure 4.
Suppression of enhanced lipolysis in Plin1−/− adipocytes alleviates monocyte migration. The levels of glycerol (A), FFAs (B), and MCP-1 (C) released from Plin1+/+ or Plin1−/− primary adipocytes for 48 h were measured. **, p < 0.01 versus Plin1+/+ group by Student's t test. D, CM were collected from SVC-derived adipocytes for 48 h and subjected to heat inactivation (70 °C, 10 min). The number of migrated cells upon incubation with each CM was measured. *, p < 0.05; **, p < 0.01 versus Plin1+/+, CTL group by two-way ANOVA followed by Bonferroni's post hoc test. E–H, SVC-derived adipocytes were transfected with control siRNA (siCtl) or Atgl-specific siRNA (siAtgl) and Hsl-specific siRNA (siHsl). After 48 h, total RNA or protein was extracted and CM was collected from siRNA-transfected SVC-derived adipocytes. The mRNA levels of Atgl and Hsl were analyzed by qRT-PCR (E) and protein levels of ATGL and HSL were analyzed by Western blotting (F). The released glycerol (G) was measured. The number of migrated cells upon incubation with each CM was measured (H). *, p < 0.05; **, p < 0.01; ***, p < 0.001 versus Plin1+/+, siCtl group; #, p < 0.05; ##, p < 0.01 versus Plin1−/−, siCtl group by one-way ANOVA followed by Tukey's post hoc test. All data represent the mean ± S.E. All qRT-PCR data were normalized to the mRNA level of cyclophilin. AD, adipocytes.
Figure 5.
Figure 5.
Prostaglandins produced by Plin1−/− adipocytes promote monocyte migration. A, CM of SVC-derived adipocytes was collected and analyzed by LC-MS/MS lipidomic methods. Eicosanoid profiles were displayed as a heat map. B, the contents of PGD2 and PGE2 in the CM were assessed. C, pathway of prostaglandin synthesis from AA, and the involvement of COX. D, the level of intracellular AA in Plin1+/+ or Plin1−/− adipocytes was measured by LC-MS/MS. **, p < 0.01 versus Plin1+/+ group by Student's t test. E–G, SVC-derived adipocytes were transfected with control siRNA (siCtl) or Cox2-specific siRNA (siCox2). After 48 h, total RNA was extracted from siRNA-transfected SVC-derived adipocytes. The mRNA level of Cox2 was analyzed by qRT-PCR. *, p < 0.05 versus siCtl group by two-way ANOVA followed by a post hoc Bonferroni test (E). The level of intracellular COX activity in Plin1+/+ or Plin1−/− adipocytes was measured (F) and CM was collected from siRNA-transfected SVC-derived adipocytes. The number of migrated cells upon incubation with each CM was measured (G). *, p < 0.05; **, p < 0.01 versus Plin1+/+, siCtl group by two-way ANOVA followed by a post hoc Bonferroni test. H and I, CM was collected from COX2 inhibitor, NS398 (1 μm), pretreated SVC-derived adipocytes. H, the level of secreted PGE2 was measured by ELISA. ***, p < 0.001 versus Plin1+/+, DMSO; ###, p < 0.001 versus Plin1−/−, DMSO group by two-way ANOVA followed by Bonferroni's post hoc test. I, migrated cells upon incubation with PGE2 (0.1 μm) supplemented CM were assessed. *, p < 0.05; ***, p < 0.001 versus Plin1+/+, DMSO group; ###, p < 0.001 versus Plin1−/−, DMSO group; $$, p < 0.001 versus Plin1−/−, NS398 group by two-way ANOVA followed by Bonferroni's post hoc test. The levels of PGE2 (J) and AA (K) in eWAT and serum PGE2 levels (L) were measured. *, p < 0.05; ***, p < 0.001 versus Plin1+/+ group by Student's t test. M, Plin1+/+ or Plin1−/− mice were intraperitoneally administered daily with NS398 (10 mg/kg body weight) for 8 days. Relative mRNA levels of pro-inflammatory genes were determined in eWAT by qRT-PCR. *, p < 0.05; **, p < 0.01; ***, p < 0.001 versus Plin1+/+, vehicle group; #, p < 0.05; ##, p < 0.01 versus Plin1−/−, vehicle group by one-way ANOVA followed by Tukey's post hoc test. All data represent the mean ± S.E. All qRT-PCR data were normalized to the mRNA level of cyclophilin. AD, adipocytes; Veh, vehicle.
Figure 6.
Figure 6.
Plin1−/− mice show insulin resistance through lipid dysregulation. A and B, Plin1+/+ and Plin1−/− mice were fasted for 15 h. Fasting serum glucose (A) and ad libitum insulin (B) were measured in Plin1+/+ and Plin1−/− mice. *, p < 0.05; **, p < 0.01 versus Plin1+/+ group by Student's t test. Intraperitoneal GTT (C) and ITT (D) were performed on Plin1+/+ and Plin1−/− mice. *, p < 0.05; **, p < 0.01 versus Plin1+/+ group by repeated-measures ANOVA (RM-ANOVA) followed by Bonferroni's post hoc test. E, homeostatic model assessment-insulin resistance (HOMA-IR) was measured in Plin1+/+ and Plin1−/− mice. **, p < 0.01 versus Plin1+/+ group by Student's t test. F, ITT was performed after treatment with NS398 (10 mg/kg body weight) for 7 days. *, p < 0.05 versus Plin1+/+, vehicle group; #, p < 0.05 versus Plin1−/−, vehicle group by RM-ANOVA followed by Bonferroni's post hoc test. G–I, Plin1+/+ and Plin1−/− mice were injected with saline or insulin (0.75 units/kg body weight). Insulin signaling in eWAT (G), skeletal muscle (H), and liver (I) was assessed by immunoblot analysis using antibodies against pAKT (S473), AKT, PLIN1, and glyceraldehyde-3-phosphate dehydrogenase (GAPDH). Levels of TG and FFAs in skeletal muscle (J) or in liver (K) were measured. p value versus Plin1+/+ mice by Student's t test. All data represent the mean ± S.E.
Figure 7.
Figure 7.
Plin1−/− mice exhibit improved insulin resistance upon macrophage depletion. A and B, clodronate (100 μl dose for 20–25 g of mouse) was intraperitoneally injected to Plin1+/+ or Plin1−/− mice. Gene expression by qRT-PCR using macrophage markers (A) and histological analysis (B) are shown. Scale bars, 50 μm. ***, p < 0.001 versus Plin1+/+, vehicle group by two way-ANOVA followed by Bonferroni's post hoc test. C and D, ITT was performed 4 days after the injection of clodronate. *, p < 0.05 versus Plin1+/+, vehicle group by repeated measures-ANOVA followed by Bonferroni's post hoc test. All data represent the mean ± S.E. All qRT-PCR data were normalized to the mRNA level of cyclophilin. Veh, vehicle; Clo, clodronate; N.S., not significant.
Figure 8.
Figure 8.
Proposed model. In Plin1-deficient adipose tissue, lipolytic by-products such as prostaglandins promote adipose tissue inflammation, contributing to whole-body insulin resistance.

References

    1. Kwon H., and Pessin J. E. (2013) Adipokines mediate inflammation and insulin resistance. Front. Endocrinol. (Lausanne) 4, 71 - PMC - PubMed
    1. Olefsky J. M., and Glass C. K. (2010) Macrophages, inflammation, and insulin resistance. Annu. Rev. Physiol. 72, 219–246 10.1146/annurev-physiol-021909-135846 - DOI - PubMed
    1. Lumeng C. N., DelProposto J. B., Westcott D. J., and Saltiel A. R. (2008) Phenotypic switching of adipose tissue macrophages with obesity is generated by spatiotemporal differences in macrophage subtypes. Diabetes 57, 3239–3246 10.2337/db08-0872 - DOI - PMC - PubMed
    1. Weisberg S. P., McCann D., Desai M., Rosenbaum M., Leibel R. L., and Ferrante A. W. Jr. (2003) Obesity is associated with macrophage accumulation in adipose tissue. J. Clin. Invest. 112, 1796–1808 10.1172/JCI200319246 - DOI - PMC - PubMed
    1. Xu H., Barnes G. T., Yang Q., Tan G., Yang D., Chou C. J., Sole J., Nichols A., Ross J. S., Tartaglia L. A., and Chen H. (2003) Chronic inflammation in fat plays a crucial role in the development of obesity-related insulin resistance. J. Clin. Invest. 112, 1821–1830 10.1172/JCI200319451 - DOI - PMC - PubMed

Publication types

LinkOut - more resources