. 2018 Jul 24;8(1):11112.
doi: 10.1038/s41598-018-29357-y.

Enhancing coevolution-based contact prediction by imposing structural self-consistency of the contacts

Affiliations

Enhancing coevolution-based contact prediction by imposing structural self-consistency of the contacts

Maher M Kassem et al. Sci Rep. .

Abstract

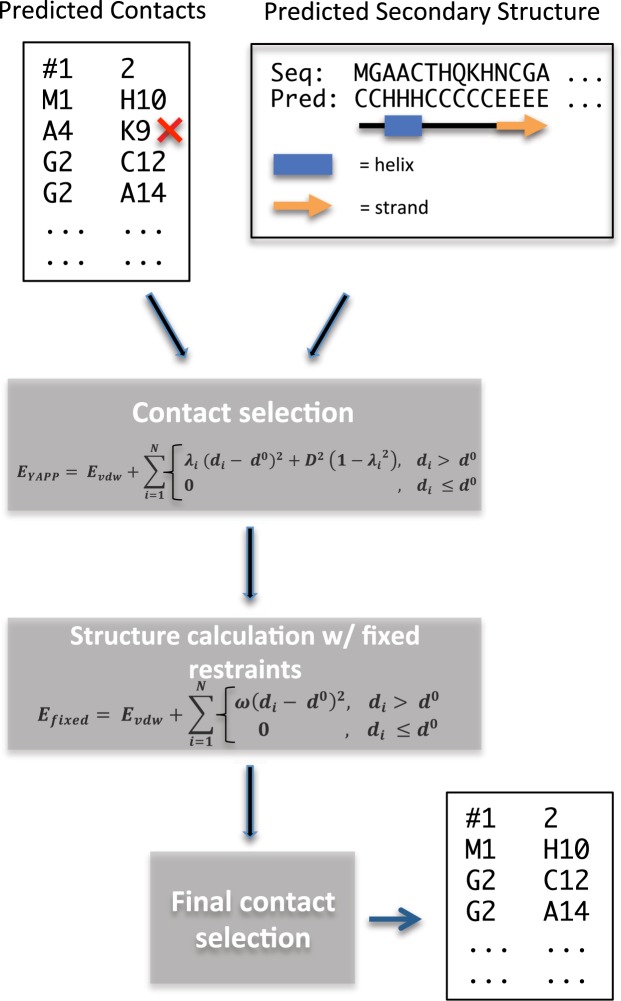
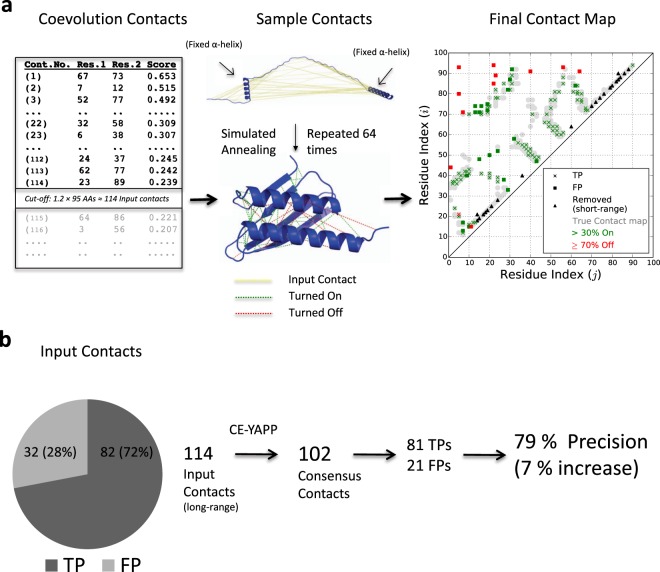
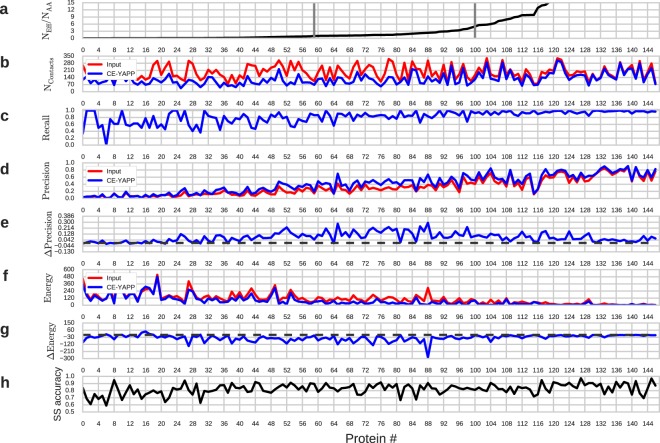
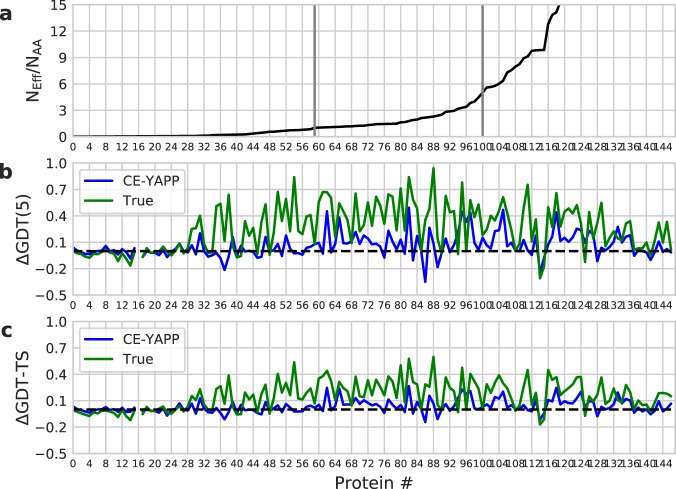
Based on the development of new algorithms and growth of sequence databases, it has recently become possible to build robust higher-order sequence models based on sets of aligned protein sequences. Such models have proven useful in de novo structure prediction, where the sequence models are used to find pairs of residues that co-vary during evolution, and hence are likely to be in spatial proximity in the native protein. The accuracy of these algorithms, however, drop dramatically when the number of sequences in the alignment is small. We have developed a method that we termed CE-YAPP (CoEvolution-YAPP), that is based on YAPP (Yet Another Peak Processor), which has been shown to solve a similar problem in NMR spectroscopy. By simultaneously performing structure prediction and contact assignment, CE-YAPP uses structural self-consistency as a filter to remove false positive contacts. Furthermore, CE-YAPP solves another problem, namely how many contacts to choose from the ordered list of covarying amino acid pairs. We show that CE-YAPP consistently improves contact prediction from multiple sequence alignments, in particular for proteins that are difficult targets. We further show that the structures determined from CE-YAPP are also in better agreement with those determined using traditional methods in structural biology.


Conflict of interest statement

The authors declare no competing interests.

Figures

Figure 1
Figure 1
Workflow diagram of the CE-YAPP method. Predicted coevolution contacts and predicted secondary structure are used in combination to filter out false positive contacts. The red ‘x’ represents a false positive contact.
Figure 2
Figure 2
CE-YAPP Protocol and results for the ribosome hibernation promoting factor HPF. (a) CE-YAPP uses as input 114 coevolution based long-range contacts predicted using Gremlin. These contacts are then used as input to the protocol depicted in Fig. 1, and repeated 64 times producing 64 similar contact lists. The final list of predicted consensus contacts are those that are turned on in more than 30% of the simulations. (b) The precision of the consensus contacts produced by CE-YAPP is compared to the precision of the input set of contacts.
Figure 3
Figure 3
CE-YAPP performance on the NOUMENON dataset. (a) The number of effective sequences divided by the number of amino acids, NEff/NAA, is plotted for each protein and sorted from low to high. The data in the remaining panels are sorted accordingly. The grey vertical bars represent the proteins with NEff/NAA closest to 1 and 5, respectively. (b) Number of contacts. (c) Recall (TP/(TP + FN)) of the CE-YAPP contacts. (d) Precision (TP/(TP + FP)). (e) Precision of CE-YAPP contacts minus precision of the input contacts (ΔPrecision). The black dashed lines in panels (e and f) denote zero. (f) Restraint violation energy (Eq. 4) (g) Drop in restraint violation after CE-YAPP (ΔEnergy). (h) Accuracy of the predicted secondary structures using the NOUMENON multiple sequence alignments.
Figure 4
Figure 4
Structural Performance on the NOUMENON dataset. Panel (a) The number of effective sequences divided by the number of amino acids, NEff/NAA, is plotted for each protein and sorted from low to high. The data in the remaining panels are sorted accordingly. The grey vertical bars represent the proteins with NEff/NAA closest to 1 and 5, respectively. Panel (b) Difference in GDT(5) (ΔGDT(5)). Panel (c) Difference in GDT-TS (Δ GDT-TS). The black dashed line denotes zero.

References

    1. Marks DS, et al. Protein 3D structure computed from evolutionary sequence variation. PLoS One. 2011;6:e28766. doi: 10.1371/journal.pone.0028766. - DOI - PMC - PubMed
    1. Hopf TA, et al. Three-dimensional structures of membrane proteins from genomic sequencing. Cell. 2012;149:1607–1621. doi: 10.1016/j.cell.2012.04.012. - DOI - PMC - PubMed
    1. Nugent T, Jones DT. Accurate de novo structure prediction of large transmembrane protein domains using fragment-assembly and correlated mutation analysis. Proc. Natl. Acad. Sci. USA. 2012;109:E1540–E1547. doi: 10.1073/pnas.1120036109. - DOI - PMC - PubMed
    1. Weigt M, White RA, Szurmant H, Hoch JA, Hwa T. Identification of direct residue contacts in proteinprotein interaction by message passing. Proc. Natl. Acad. Sci. USA. 2009;106:67–72. doi: 10.1073/pnas.0805923106. - DOI - PMC - PubMed
    1. Ovchinnikov S, Kamisetty H, Baker D. Robust and accurate prediction of residue-residue interactions across protein interfaces using evolutionary information. eLife. 2014;3:e02030. doi: 10.7554/eLife.02030. - DOI - PMC - PubMed

LinkOut - more resources