. 2018 Jul 10:9:1413.
doi: 10.3389/fmicb.2018.01413. eCollection 2018.

Respiratory Microbiome Profiling for Etiologic Diagnosis of Pneumonia in Mechanically Ventilated Patients

Affiliations

Respiratory Microbiome Profiling for Etiologic Diagnosis of Pneumonia in Mechanically Ventilated Patients

Georgios D Kitsios et al. Front Microbiol. .

Abstract

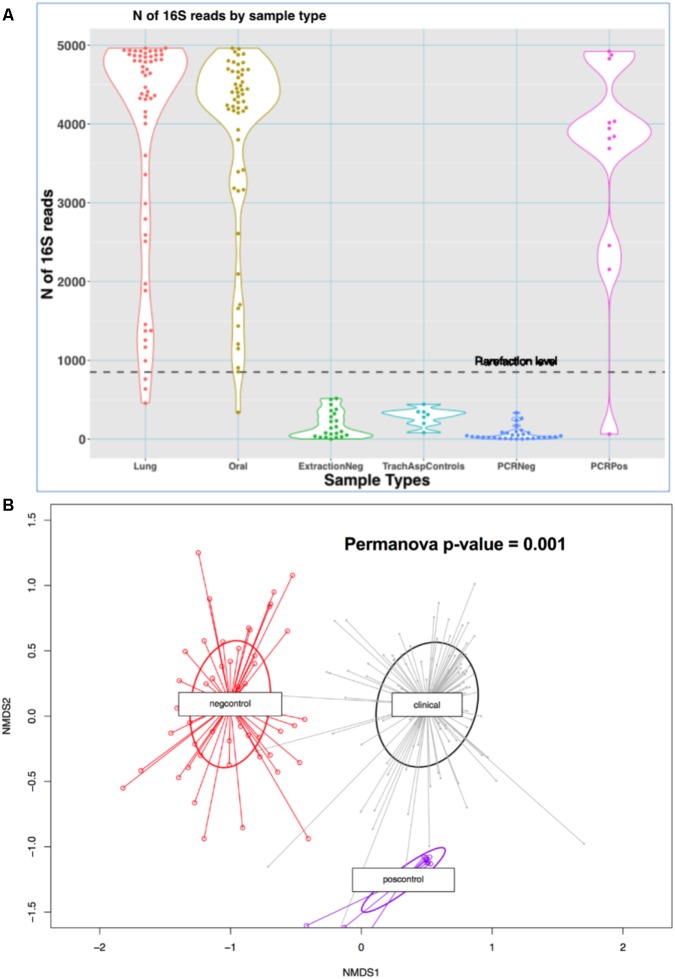
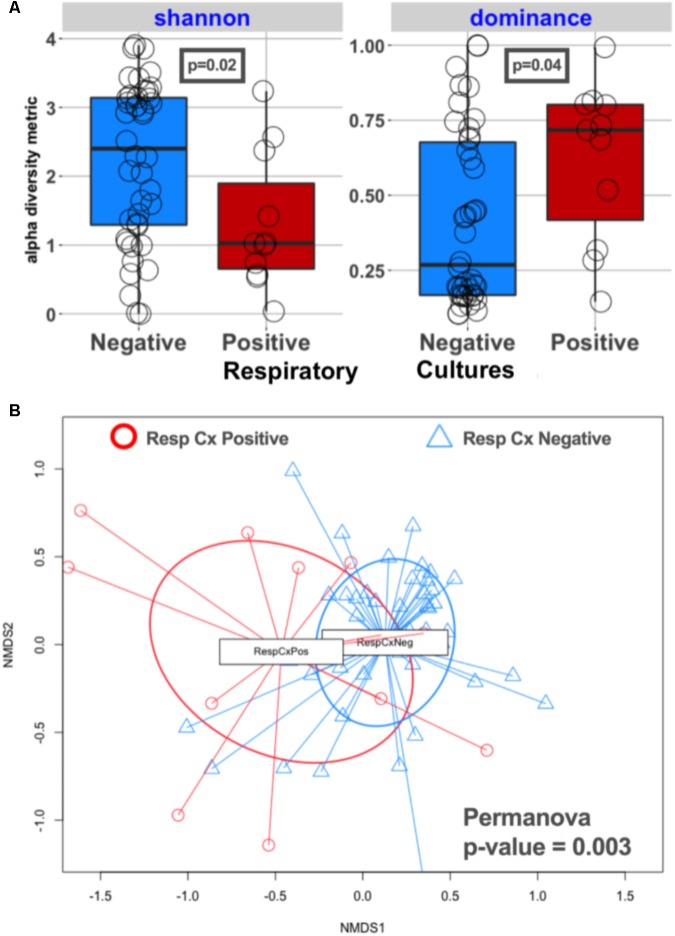
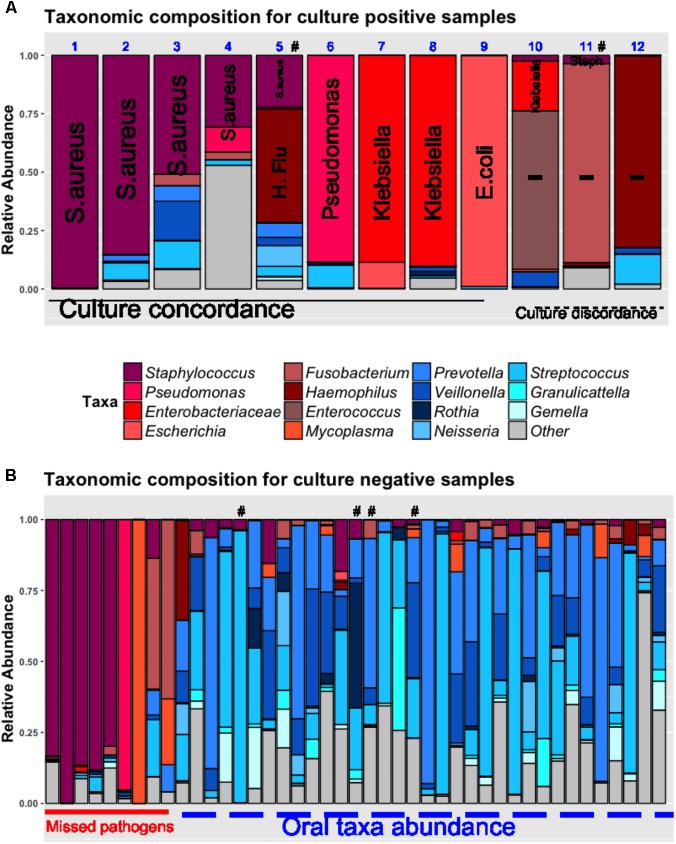
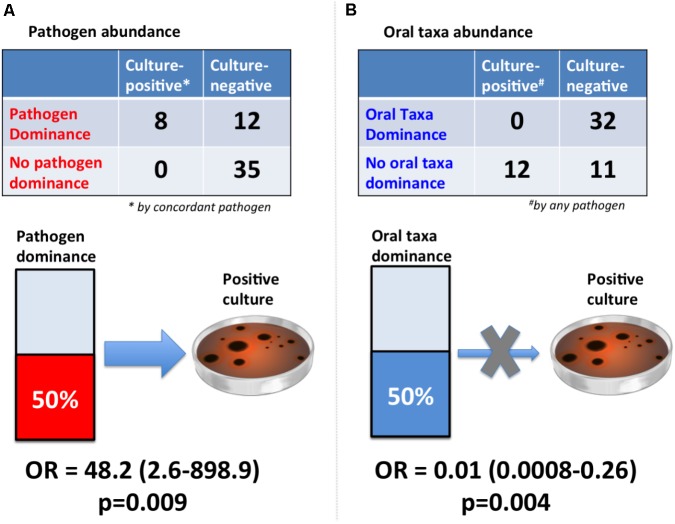
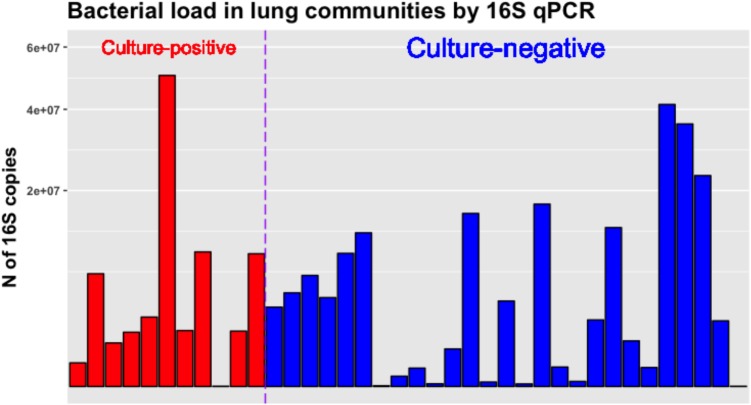
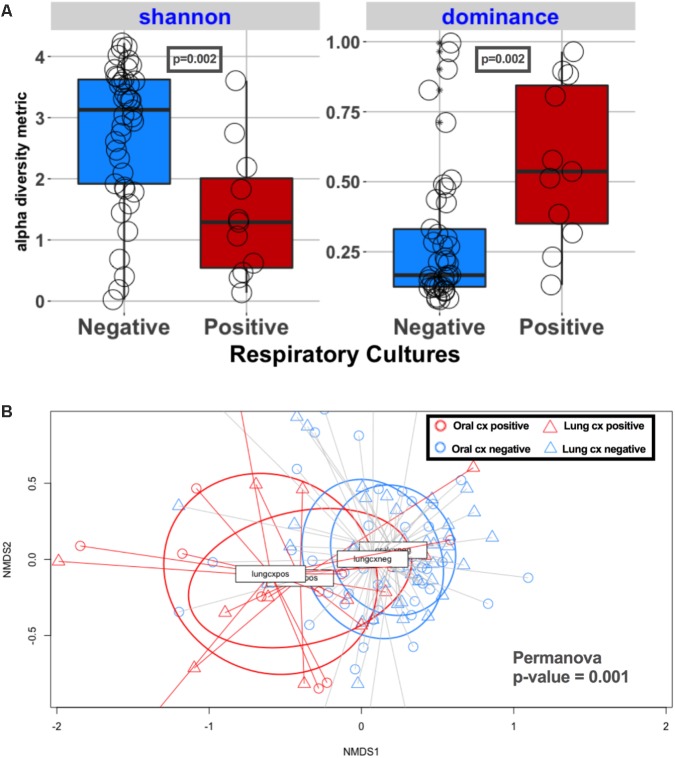
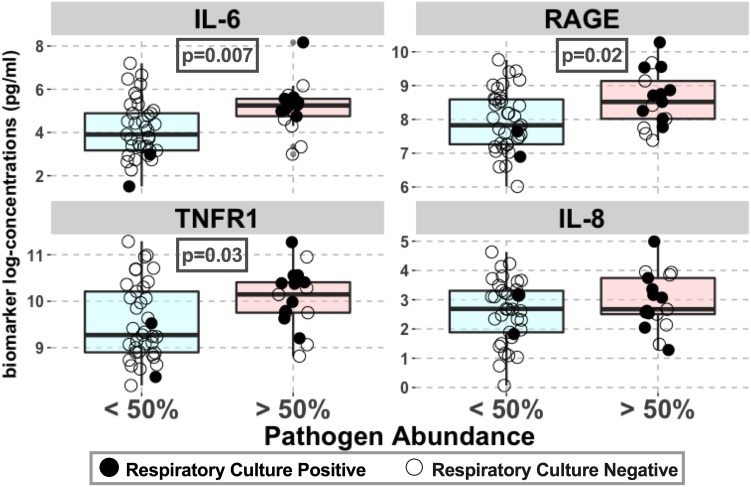
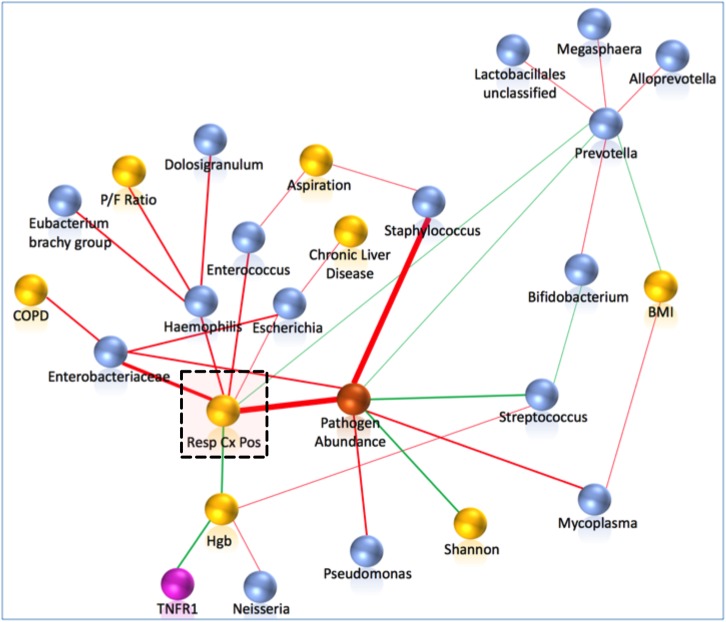
Etiologic diagnosis of bacterial pneumonia relies on identification of causative pathogens by cultures, which require extended incubation periods and have limited sensitivity. Next-generation sequencing of microbial DNA directly from patient samples may improve diagnostic accuracy for guiding antibiotic prescriptions. In this study, we hypothesized that enhanced pathogen detection using sequencing can improve upon culture-based diagnosis and that certain sequencing profiles correlate with host response. We prospectively collected endotracheal aspirates and plasma within 72 h of intubation from patients with acute respiratory failure. We performed 16S rRNA gene sequencing to determine pathogen abundance in lung samples and measured plasma biomarkers to assess host responses to detected pathogens. Among 56 patients, 12 patients (21%) had positive respiratory cultures. Sequencing revealed lung communities with low diversity (p < 0.02) dominated by taxa (>50% relative abundance) corresponding to clinically isolated pathogens (concordance p = 0.009). Importantly, sequencing detected dominant pathogens in 20% of the culture-negative patients exposed to broad-spectrum empiric antibiotics. Regardless of culture results, pathogen dominance correlated with increased plasma markers of host injury (receptor of advanced glycation end-products-RAGE) and inflammation (interleukin-6, tumor necrosis factor receptor 1-TNFR1) (p < 0.05), compared to subjects without dominant pathogens in their lung communities. Machine-learning algorithms identified pathogen abundance by sequencing as the most informative predictor of culture positivity. Thus, enhanced detection of pathogenic bacteria by sequencing improves etiologic diagnosis of pneumonia, correlates with host responses, and offers substantial opportunity for individualized therapeutic targeting and antimicrobial stewardship. Clinical translation will require validation with rapid whole meta-genome sequencing approaches to guide real-time antibiotic prescriptions.

Keywords: 16S rRNA gene sequencing; antibiotic stewardship; microbiome; pneumonia; respiratory failure.


Figures

FIGURE 1
FIGURE 1
Comparisons of sequencing results between clinical samples and experimental controls. (A) N of reads by sample type in the MICALIR study. Clinical samples (lung and oral) produced about 30 times more reads than negative control samples (p < 10-16) [ExtractionNeg: negative control for DNA extraction experiments; TrachAspControls: sterile left-over saline from the one used to instill into the endotracheal tube for suctioning endotracheal aspirates; PCRNeg: PCR negative controls]. A rarefaction level of 850 reads was selected for alpha diversity analyses, which excluded small numbers of clinical samples for these analyses. (B) Non-metric multidimensional scaling (NMDS) plot of Bray–Curtis dissimilarity indices between clinical samples (lung and oral) versus negative controls (extraction, PCR and tracheal sampling procedure controls) and positive controls. Experimental control samples were compositionally markedly dissimilar to clinical samples by Bray–Curtis indices (Permanova p-value = 0.001). No taxa detected in negative controls were filtered from downstream analyses.
FIGURE 2
FIGURE 2
Culture-positive lung communities have significantly lower alpha diversity and are compositionally distinct from culture-negative communities. (A) Alpha diversity comparisons between culture-positive and culture-negative cases showed statistically significant differences in Shannon and Dominance indices, representing richness and evenness, respectively, indicating that culture-positive communities are being dominated by fewer bacterial species. Culture-negative communities demonstrated a wide range of alpha diversity. (B) Beta diversity (Bray–Curtis dissimilarity indices) comparisons between respiratory culture-positive (Resp Cx Positive) and negative (Resp Cx negative) cases showed significant differences (Permanova p-value = 0.003), but certain culture-negative samples overlapped with the culture-positive cluster indicating underlying compositional similarity.
FIGURE 3
FIGURE 3
Pathogen dominance detection in culture-positive (A) and negative lung samples (B). Taxonomic composition is shown as stacked bar-graphs, with each bar representing a patient’s community, with taxa colored individually and heights of component bars corresponding to relative abundance of each taxon. In culture-positive samples (A), the clinically isolated organisms by routine microbiologic cultures are spelled out vertically in each bar (Methicillin-resistant S. aureus in cases 1, 2, 11; Methicillin-sensitive S. aureus in cases 3, 4, 5; Haemophilus influenza in case 5; Pseudomonas aeruginosa in case 6, Klebsiella pneumoniae in cases 7, 8, and 10, Escherichia coli in case 9; Serratia marcescens in case 12. In cases 1–9, the most abundant taxon corresponded to the clinically isolated pathogen (culture-concordance). In three cases (10–12), there was discordance between cultures and sequencing (i.e., the most abundant organism was not the one isolated by cultures. In cases 10 and 11, the clinically isolated Klebsiella pneumoniae and S. aureus corresponded to a minority of concordant reads in these communities that were dominated by Enterococcus and Fusobacterium taxa, respectively. In case 12, sequencing showed dominance by Haemophilus taxa whereas cultures isolated Serratia marcescens. Among culture-negative samples (B), 20% were dominated by pathogenic taxa similar to the ones detected in culture-positive cases, and the remaining samples showed high abundance of oral bacteria. In six cases highlighted with the “#” symbol, respiratory viral panels of the nasopharynx or respiratory specimens were positive (for influenza, respiratory syncytial virus, metapneumovirus or parainfluenza virus). The “other” taxonomic assignment corresponds to multiple genera not corresponding to “pathogens” or “oral taxa” lumped together for display purposes. H.Flu, Haemophilus Influenza.
FIGURE 4
FIGURE 4
Dominance of lung communities by pathogens or oral taxa was strongly associated with respiratory culture results. (A) Pathogen dominance (>50% abundance) was strongly associated with concordant pathogen culture-positivity [Fisher’s odds ratio (OR) with continuity correction and associated 95% confidence interval shown]. The reference standard here was chosen to be concordant pathogen positivity, as the sequencing diagnostic test would be clinically valid if able to detect the same organism as our current reference standard of cultures. (B) Oral taxa dominance (>50% abundance) practically eliminated the odds of culture-positivity by any pathogen (OR = 0.01). The reference standard here was defined as “any pathogen,” given that oral taxa are not generally considered as pathogens or speciated by routine microbiologic cultures, and this comparison aims to assess the negative predictive value of high oral abundance in a lung community for ruling out culture positivity by any pathogenic bacteria.
FIGURE 5
FIGURE 5
Bacterial load in culture-positive and negative lung communities as quantified by 16S rRNA gene qPCR. No significant differences between culture-positive and negative samples were found. The Y-axis showing number of 16S rRNA gene copies per sample is square-root transformed for visualization purposes.
FIGURE 6
FIGURE 6
Alpha and beta diversity comparisons in oral and lung communities, stratified by respiratory specimen culture positivity. (A) Alpha diversity comparisons in oral communities, showing statistically significantly lower richness and evenness in culture-positive samples compared to culture-negative ones (p = 0.002). (B) Bray–Curtis dissimilarity indices comparison in 4 groups: red circles for oral communities of culture-positive samples, blue circles for oral communities of culture-negative samples, red triangles for lung communities of culture-positive samples, blue triangles for lung communities of culture-negative samples. Permanova indicates significant differences overall, but oral and lung communities are overlapping when stratified by respiratory sample culture positivity, indicating that oral communities in culture-positive cases were taxonomically more similar to their corresponding culture-positive lung communities, rather than the oral communities of culture-negative cases.
FIGURE 7
FIGURE 7
Pathogen abundance in lung communities was associated with higher levels of lung epithelial injury and inflammation. Associations between plasma biomarkers of injury (RAGE) and inflammation (IL-6, IL-8, and sTNFR1) with pathogen dominance in lung communities (relative abundance > 50%) are shown for the entire cohort. Biomarker concentrations (pg/ml) are shown in logarithmic scale. Culture-positive and negative samples are shown with filled and open circles, respectively. Statistically significant p-values are shown in boxes. No significant association with procalcitonin levels was found.
FIGURE 8
FIGURE 8
Pathogen abundance by sequencing was the strongest correlate of culture-positivity by probabilistic graphical modeling. Network analyses included clinical (yellow), individual 16S taxa (blue), composite pathogen taxa abundance (orange) and biomarker (purple spheres) variables. First and second neighbors around the clinically important variable of respiratory culture positivity (highlighted by a dashed square) are shown. Edges (links) between variables are shown in red for positive and in green for negative correlations. The thickness of the edges is proportional to the stability metric of the detected associations. Respiratory culture positivity was positively associated with the composite variable of pathogen abundance, Enterobacteriaceae, Haemophilus, Escherichia, and Enterococcus taxa, and negatively associated with Prevotella abundance and hemoglobin levels. COPD, chronic obstructive pulmonary disease; Hgb, hemoglobin; P/F Ratio, Pa02/Fi02 ratio; BMI, body mass index.

References

    1. ARDS Definition Task Force Ranieri V. M., Rubenfeld G. D., Thompson B. T., Ferguson N. D., Caldwell E., et al. (2012). Acute respiratory distress syndrome: the Berlin definition. JAMA 307 2526–2533. 10.1001/jama.2012.5669 - DOI - PubMed
    1. Barrett M. L., Smith M. W., Elixhauser A., Honigman L. S., Pines J. M. (2014). Utilization of Intensive Care Services, 2011. HCUP Statistical Brief # 185. Rockville, MD: Agency for Healthcare Research and Quality. - PubMed
    1. Berton D. C., Kalil A. C., Teixeira P. J. Z. (2014). Quantitative versus qualitative cultures of respiratory secretions for clinical outcomes in patients with ventilator-associated pneumonia. Cochrane Database Syst. Rev. 10:CD006482. 10.1002/14651858.CD006482.pub4 - DOI - PMC - PubMed
    1. Calfee C. S., Delucchi K., Parsons P. E., Thompson B. T., Ware L. B., Matthay M. A., et al. (2014). Subphenotypes in acute respiratory distress syndrome: latent class analysis of data from two randomised controlled trials. Lancet Respir. Med. 2 611–620. 10.1016/S2213-2600(14)70097-9 - DOI - PMC - PubMed
    1. Canadian Critical Care Trials Group (2006). A randomized trial of diagnostic techniques for ventilator-associated pneumonia. N. Engl. J. Med. 355 2619–2630. 10.1056/NEJMoa052904 - DOI - PubMed