. 2018 Oct 1;75(10):1033-1042.
doi: 10.1001/jamapsychiatry.2018.2004.

Evaluation of the Concurrent Trajectories of Cardiometabolic Risk Factors in the 14 Years Before Dementia

Affiliations

Evaluation of the Concurrent Trajectories of Cardiometabolic Risk Factors in the 14 Years Before Dementia

Maude Wagner et al. JAMA Psychiatry. .

Abstract

Importance: Cardiometabolic risk factors have been associated with an increased risk of dementia; yet, the optimal targets and time window for the management of cardiometabolic health to prevent dementia remain unknown.

Objectives: To model concurrently and compare the trajectories of cardiometabolic risk factors up to 14 years preceding diagnosis in individuals with dementia and matched controls free of dementia.

Design, setting, and participants: A case-control study nested within the Three-City study, a French population-based cohort of older persons (≥65 years), included 6 home visits with neuropsychological testing between 1999 and 2014. Data analysis was performed in September 2017. A total of 785 incident dementia cases and 3140 controls matched by sex, age, educational level, and cohort center at the time of diagnosis were evaluated.

Exposures: Repeated measures of body mass index (BMI) and systolic (SBP) and diastolic (DBP) blood pressure, high-density lipoprotein (HDL-C) and low-density lipoprotein cholesterol (LDL-C), triglycerides, and glycemia levels between 1999 and 2014.

Main outcomes and measures: Incidence of dementia based on systematic detection and validated diagnosis.

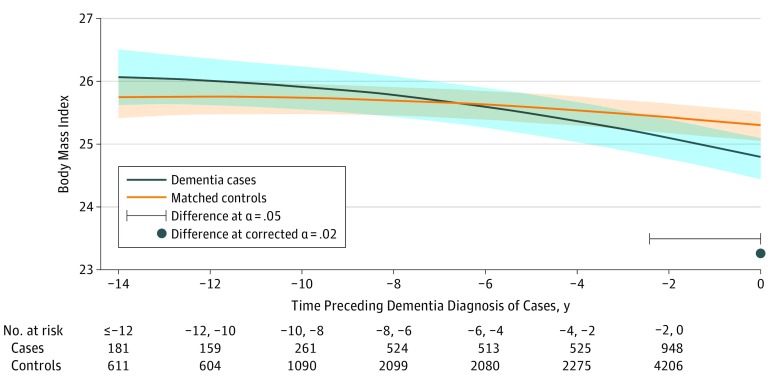
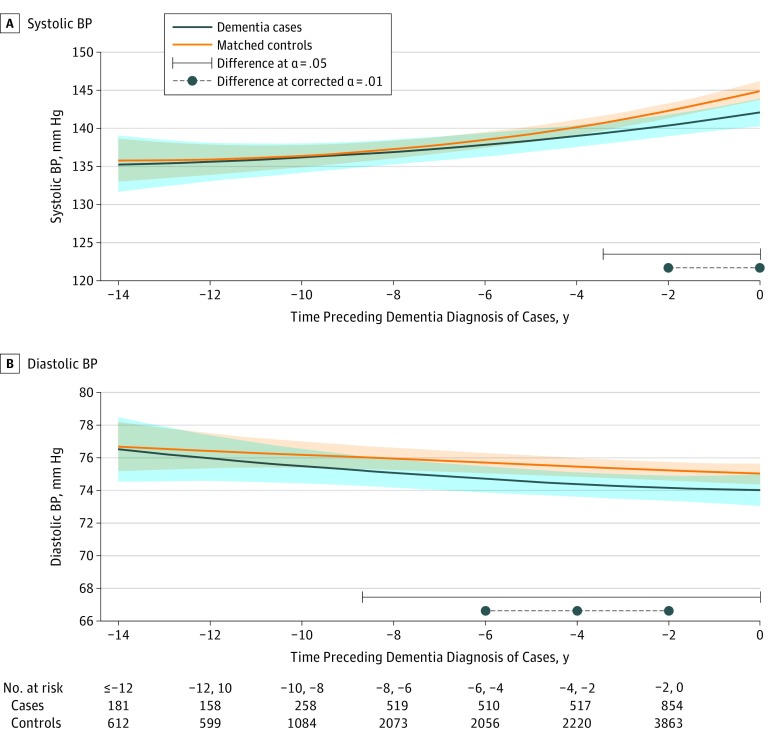
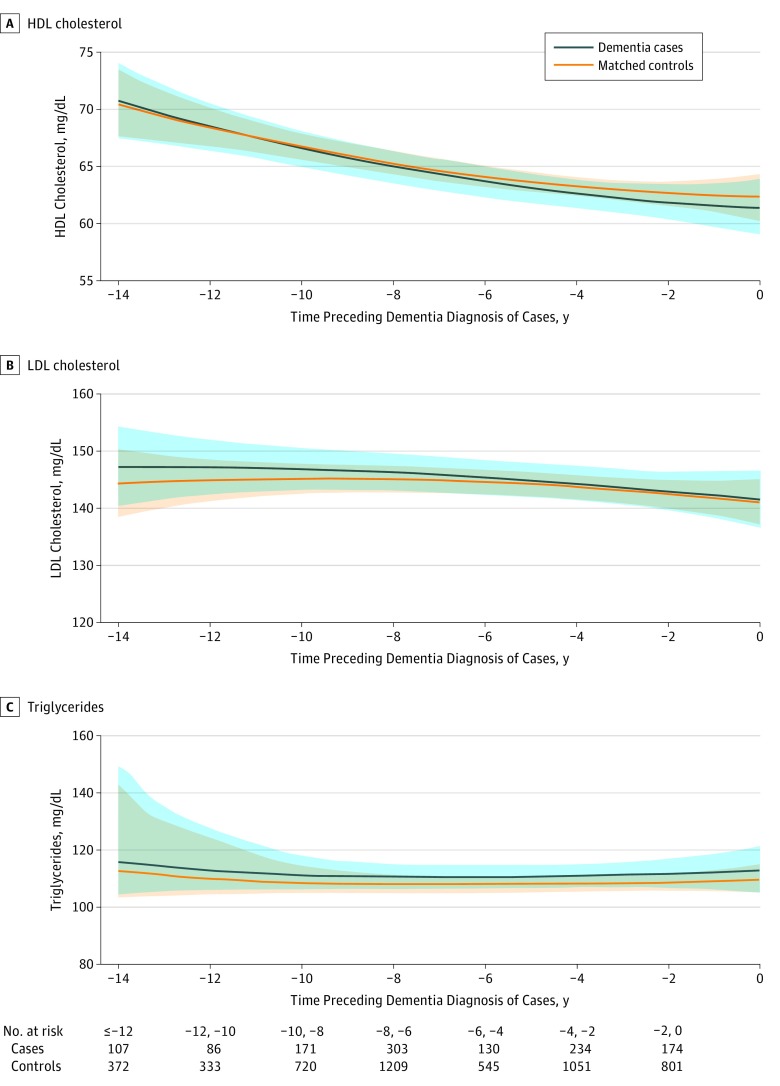
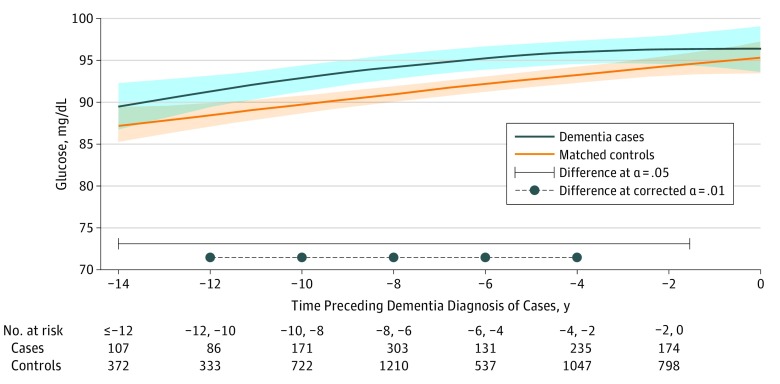
Results: A total of 785 cases and 3140 controls (2530 [65%] women; mean [SD] age, 76 [5] years) were included in the study. Cases presented a faster decline in BMI, slower increase of SBP and constantly lower DBP. Mean values (95% CI) 14 years before diagnosis (-14 years) and at diagnosis (year 0) for the most common profile were BMI, 26.1 (25.6-26.5) and 24.8 (24.5-25.1) for a case, and 25.7 (25.4-26.1) and 25.3 (25.0-25.5) for a control; for SBP, 135.2 (131.8-138.7) and 142.1 (140.3-143.9) mm Hg for a case, and 135.8 (132.9-138.6) and 144.9 (143.7-146.1) mm Hg for a control; for DBP, 76.5 (74.7-78.5) and 74.0 (73.1-74.9) mm Hg for a case, and 76.7 (75.1-78.3) and 75.0 (74.2-75.7) mm Hg for a control. In contrast, glycemia was higher among cases (mean fasting glucose values [95% CI] at -14 years and year 0: 89.4 [86.9-92.1] and 96.4 [93.7-99.3] mg/dL for a case, and 87.1 [85.1-89.2] and 95.3 [93.5-97.1] mg/dL for a control), with a significant case-control difference from -1.6 to -14 years prior to diagnosis. There were no significant case-control differences in trajectories of blood lipid levels (mean values [95% CI] at -14 years and year 0: for HDL-C, 70.6 [67.6-73.9] and 61.3 [58.9-63.8] mg/dL for a case, and 70.4 [67.5-73.3] and 62.3 [60.2-64.3] mg/dL for a control; for LDL-C: 147.2 [140.5-154.5] and 141.6 [136.6-146.7] mg/dL for a case, and 144.3 [138.7-150.4] and 141.2 [137.5-145.2] mg/dL for a control; for triglycerides: 115.5 [103.6-149.1] and 112.6 [104.8-120.9] mg/dL for a case, and 112.5 [103.8-144.4] and 109.7 [105.0-114.8] mg/dL for a control).

Conclusions and relevance: In this large cohort of older persons, BMI declined in prodromal dementia, possibly reflecting early preclinical changes. Lower BP prior to dementia may reflect both a consequence and a contributing factor for the disease, whereas higher blood glucose levels may constitute a risk factor for dementia in the older age range. Overall, these findings suggest that elevated glycemia, low BP, and weight loss may be primary targets for the management of cardiometabolic health for primary and secondary prevention of dementia in the older age range.


Conflict of interest statement

Conflict of Interest Disclosures: None reported.

Figures

Figure 1.
Figure 1.. Predicted Mean Trajectories of Body Mass Index up to 14 Years Before Dementia Diagnosis Among Dementia Cases (n = 785) and Matched Controls (n = 3140)
Mean trajectories (solid lines) with 95% pointwise CIs (indicated with shading) were predicted by a latent process linear mixed model in the retrospective time since the matching visit. The model included a quadratic function of time (t, t2); case-control status, matching variables (ie, sex, age, educational level, and cohort center), and their interactions with the quadratic function of time; and correlated random effects on the intercept, time and time2. Body mass index (calculated as weight in kilograms divided by height in meters squared) observations were normalized by I-splines with 2 internal knots. Trajectories were plotted for the most common profile of the study sample: a woman from an average study center, aged 76 years at inclusion and with educational level lower than high school. Note that the choice of the profile affects only the level of the trajectories; it does not affect the differences between cases and controls or test significance.
Figure 2.
Figure 2.. Predicted Mean Trajectories of Systolic and Diastolic Blood Pressure (BP) up to 14 Years Before Dementia Diagnosis Among Cases (n = 785) and Matched Controls (n = 3140)
Mean trajectories (solid lines) of systolic BP (A) and diastolic BP (B) with 95% pointwise CIs (indicated with shading) were predicted by a latent process linear mixed model in the retrospective time since the matching visit. The models included a quadratic function of time (t, t2); case-control status, matching parameters (ie, sex, age, educational level, and cohort center), and their interactions with the quadratic function of time; 2 binary indicators for white-coat effect (value measured at baseline vs later, and value based on mean of 2 measures vs 1 measure); and correlated random effects on the intercept, time, and time2. Blood pressure observations were normalized by I-splines with 2 internal knots. Trajectories were plotted for the most common profile of the study sample: a woman from an average study center, aged 76 years at inclusion, and with educational level lower than high school. Note that the choice of the profile affects only the level of the trajectories; it does not affect the differences between cases and controls or test significance.
Figure 3.
Figure 3.. Predicted Mean Trajectories of High-Density Lipoprotein (HDL) Cholesterol, Low-Density Lipoprotein (LDL) Cholesterol, and Triglyceride Levels up to 14 Years Before Dementia Diagnosis Among Cases (n = 785) and Matched Controls (n = 3140)
Mean trajectories (solid lines) trajectories of HDL cholesterol (A), LDL cholesterol (B), and triglyceride (C) levels with 95% pointwise CIs (indicated with shading) were predicted by a latent process linear mixed model in the retrospective time since the matching visit. The models included a quadratic function of time (t, t2); case-control status, matching variables (ie, sex, age, educational level, and cohort center), and their interactions with the quadratic function of time; and correlated random effects on the intercept, time and time2. Plasma lipid level observations were normalized by I-splines with 3 internal knots. Trajectories were plotted for the most common profile of the study sample: a woman from an average study center, aged 76 years at inclusion, and with educational level lower than high school. Note that the choice of the profile affects only the level of the trajectories; it does not affect the differences between cases and controls or test significance. To convert HDL and LDL cholesterol to millimoles per liter, multiply by 0.0259; triglycerides to millimoles per liter, 0.0113.
Figure 4.
Figure 4.. Predicted Mean Trajectories of Glucose Levels up to 14 Years Before Dementia Diagnosis Among Cases (n = 785) and Matched Controls (n = 3140)
Mean trajectories (solid lines) with 95% pointwise CIs (indicated with shading) were predicted by a latent process linear mixed model in the retrospective time since the matching visit. The model included a quadratic function of time (t, t2); case-control status, matching variables (ie, sex, age, educational level, and cohort center), and their interactions with the quadratic function of time; and correlated random effects on the intercept, time, and time2. Glucose level observations were normalized by I-splines with 3 internal knots. Trajectories were plotted for the most common profile of the study sample: a woman from an average study center, aged 76 years at inclusion, and with educational level lower than high school. Note that the choice of the profile affects only the level of the trajectories; it does not affect the differences between cases and controls or test significance. To convert glucose to millimoles per liter, multiply by 0.0555.

References

    1. Breteler MM. Vascular risk factors for Alzheimer’s disease: an epidemiologic perspective. Neurobiol Aging. 2000;21(2):153-160. doi:10.1016/S0197-4580(99)00110-4 - DOI - PubMed
    1. Stampfer MJ. Cardiovascular disease and Alzheimer’s disease: common links. J Intern Med. 2006;260(3):211-223. doi:10.1111/j.1365-2796.2006.01687.x - DOI - PubMed
    1. Norton S, Matthews FE, Barnes DE, Yaffe K, Brayne C. Potential for primary prevention of Alzheimer’s disease: an analysis of population-based data. Lancet Neurol. 2014;13(8):788-794. doi:10.1016/S1474-4422(14)70136-X - DOI - PubMed
    1. Winblad B, Amouyel P, Andrieu S, et al. . Defeating Alzheimer’s disease and other dementias: a priority for European science and society. Lancet Neurol. 2016;15(5):455-532. doi:10.1016/S1474-4422(16)00062-4 - DOI - PubMed
    1. Tolppanen AM, Ngandu T, Kåreholt I, et al. . Midlife and late-life body mass index and late-life dementia: results from a prospective population-based cohort. J Alzheimers Dis. 2014;38(1):201-209. doi:10.3233/JAD-130698 - DOI - PubMed

Publication types

MeSH terms