. 2019 Jan;221(1):371-384.
doi: 10.1111/nph.15344. Epub 2018 Jul 24.

Rice with reduced stomatal density conserves water and has improved drought tolerance under future climate conditions

Affiliations

Rice with reduced stomatal density conserves water and has improved drought tolerance under future climate conditions

Robert S Caine et al. New Phytol. 2019 Jan.

Abstract

Much of humanity relies on rice (Oryza sativa) as a food source, but cultivation is water intensive and the crop is vulnerable to drought and high temperatures. Under climate change, periods of reduced water availability and high temperature are expected to become more frequent, leading to detrimental effects on rice yields. We engineered the high-yielding rice cultivar 'IR64' to produce fewer stomata by manipulating the level of a developmental signal. We overexpressed the rice epidermal patterning factor OsEPF1, creating plants with substantially reduced stomatal density and correspondingly low stomatal conductance. Low stomatal density rice lines were more able to conserve water, using c. 60% of the normal amount between weeks 4 and 5 post germination. When grown at elevated atmospheric CO2 , rice plants with low stomatal density were able to maintain their stomatal conductance and survive drought and high temperature (40°C) for longer than control plants. Low stomatal density rice gave equivalent or even improved yields, despite a reduced rate of photosynthesis in some conditions. Rice plants with fewer stomata are drought tolerant and more conservative in their water use, and they should perform better in the future when climate change is expected to threaten food security.

Keywords: climate change; drought; epidermal pattering factor; heat stress; rice; stomata; water conservation.


Figures

Figure 1
Figure 1
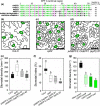
The rice EPIDERMAL PATTERNING FACTOR OsEPF1 (OSIR64_00232g011350.1) negatively regulates stomatal development in Arabidopsis thaliana and the rice cultivar ‘IR64’ (Oryza sativa ssp. indica). (a) Peptide sequence alignment of the C‐terminal region of closely related EPFs in rice, barley (Hordeum vulgare) and Arabidopsis. Rice OsEPF1, like barley HvEPF1, has nine cysteine residues (purple) in the C‐terminal region. Additional amino acid residues identical to OsEPF1 are marked green. Percentage sequence identity of other EPF peptides to OsEPF1 shown on the right. HvEPF1, HORVU2Hr1G116010.3; AtEPF2, AT1G34245.1; AtEPF1, AT2G20875.1. (b–d) Tracing of images of the mature abaxial epidermis of 56‐d‐old Arabidopsis leaves. (b) Arabidopsis Col‐0 background ecotype, (c) epf2 and (d) pAtEPF2::OsEPF1 (epf2) #1 (bars, 50 μm). (e) Stomatal density and (f) stomatal index of Col‐0, epf2 and two independent complemented lines: pAtEPF2::OsEPF1 (epf2) #1 and #2. (g) Stomatal density of the first true leaf of three independent T2 generation OsEPF1 overexpressing ‘IR64’ rice lines: OsEPF1oeW (weak), OsEPF1oeM (medium) and OsEPF1oeS (strong phenotype) at the 8‐d‐old seedling stage. For graphs (e–g), horizontal lines within boxes indicate the median and boxes indicate the upper (75%) and lower (25%) quartiles. Whiskers indicate the ranges of the minimum and maximum values, and different letters indicate a significant difference between the means (< 0.05, one‐way ANOVA). (e, f) = 7 plants; (g) = 4 plants.
Figure 2
Figure 2
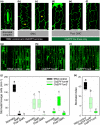
Overexpressing OsEPF1 restricts stomatal development in ‘IR64’ rice (Oryza sativa ssp. indica). Confocal images of the abaxial epidermis of the fifth fully expanded true leaf of ‘IR64’ control, OsEPF1oeW and OsEPF1oeS plants showing interdigitating pavement cells surrounding (a) a stomatal complex comprised of two outer subsidiary cells and two inner guard cells and (b–f) arrested stomatal lineage cells, comprising (b, c) guard mother cells (GMCs; yellow asterisks) and (d–f) post‐GMC arrested cells. Epidermal images of (g) ‘IR64’, (h) OsEPF1oeW and (i) OsEPF1oeS lines. Yellow asterisks denote GMCs. Bars, 25 μm. (j) Stomatal lineage cell density and (k) stomatal index. For graphs (j, k), horizontal lines within boxes indicate the median, and boxes indicate the upper (75%) and lower (25%) quartiles. Whiskers indicate the ranges of the minimum and maximum values, and different letters indicate values with a significantly different mean within graphs (< 0.05, one‐way ANOVA). = 6 plants.
Figure 3
Figure 3
Plant gas exchange and water loss in ‘IR64’ control and OsEPF1oe rice (Oryza sativa ssp. indica). (a) Infrared gas exchange analysis of carbon assimilation A and (b) stomatal conductance g s performed at a light intensity of 1000 μmol m−2 s−1 photosynthetically active radiation (PAR) akin to growth‐chamber conditions. (c) Maximum velocity of Rubisco V cmax and (d) the potential rate of electron transport J max of plants grown under saturating light conditions (2000 μmol m−2 s−1 PAR). For (a–d) measurements were performed on the fifth fully expanded true leaf of 21‐d‐old plants. (e) Cumulative weight loss over 7 d without watering, starting from 28 d post germination. (f) Total leaf area of plants 28 d post germination. For graphs (a–d, f), horizontal lines within boxes indicate the median, and boxes indicate the upper (75%) and lower (25%) quartiles. Whiskers indicate the ranges of the minimum and maximum values and different letters indicate values with a significantly different mean within graph (< 0.05, one‐way ANOVA). Error bars in (e) indicate SEM. (a–d) = 6 plants; (e) = 10 plants; (f) = 5 plants.
Figure 4
Figure 4
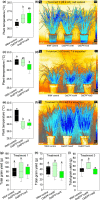
OsEPF1 overexpression affects leaf water loss and temperature, and enhances yield following flowering drought in ‘IR64’ rice (Oryza sativa ssp. indica). (a, b, g) Treatment 1: well‐watered plants. (c, d, h) Treatment 2: water withheld during vegetative growth at 28 d for 9 d and at 56 d for 7 d. (e, f, i) Treatment 3: water withheld during reproductive stage at 88 d for 3 d. Surface temperatures of (a) treatment 1 plants, well‐watered at 49 d old, (c) treatment 2 plants, 62 d old at the end of 7 d drought period, and (e) treatment 3 plants 90 d old at the end of 3 d drought period. Infrared thermal images in (b), (d) and (f) are from representative plants used to compile data in (a), (c) and (e). Dark blue denotes coolest areas, as indicated on scale on right. (g–i) Total grain yields of (g) well‐watered, (h) vegetative drought and (i) flowering drought plants. For all box plots graphs, horizontal lines within boxes indicate the median with boxes covering the upper (75%) and lower (25%) quartiles. Whiskers indicate the ranges of the minimum and maximum values, and letters indicate significantly different mean values (< 0.05, one‐way ANOVA). Owing to unequal variances, in (g) a Kruskal–Wallis one‐way ANOVA on ranks was performed: (a, b, g) = 8; (c, d, h) = 5–7; (e, f, j) = 6–7.
Figure 5
Figure 5
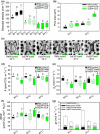
Stomatal development and physiological responses on the fully expanded true leaf 5 of ‘IR64’ control, OsEPF1oeW and OsEPF1oeS rice (Oryza sativa ssp. indica) grown at 30, 35 or 40°C. (a) Stomatal density, (b) calculated stomatal pore area at 30 and 40°C, (c) representative images of individual stomates at 30 and 40°C (bars, 10 μm), (d) carbon assimilation A, (e) stomatal conductance g s, (f) intrinsic water use efficiency (iWUE, A/g s) and (g) anatomical potential g s max with actual g s values plotted, showing the percentage of potential g s that was reached. All infrared gas exchange analysis was performed at 2000 μmol m−2 s−1 PAR. For graphs (a, b, d–f), horizontal lines within boxes indicate the median, and boxes indicate the upper (75%) and lower (25%) quartiles. Whiskers indicate the ranges of the minimum and maximum values. (a) A one‐way (ANOVA) statistical analysis was carried out to identify significant differences between temperatures within genotypes; for (b) a two‐way ANOVA was used, and for (d–f) one‐way ANOVA analyses were carried out to identify significant differences between genotypes within a given temperature treatment. Dotted lines separate the different groups for statistical analyses. Letters within a group indicate significantly different mean values (P < 0.05, one‐way ANOVA). Owing to unequal variance, in (d) a Kruskal–Wallis one‐way ANOVA on ranks was performed. n = 6–7 plants.
Figure 6
Figure 6
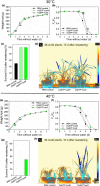
Increased survival rate of OsEPF1oe plants following severe drought at 30 or 40°C in ‘IR64’ rice (Oryza sativa ssp. indica). (a, e) Cumulative water loss over drought period imposed on 28‐d‐old ‘IR64’ control, OsEPF1oeW and OsEPF1oeS plants grown at (a) 30°C or (e) 40°C in 0.88 l pots. Dark‐adapted F v/F m over drought period at (b) 30°C or (f) 40°C. Percentage of plants surviving 10 d after rewatering following (c) 8 d (30°C) or (g) 7 d (40°C) of total water withdrawal. Thermal images of plants 10 d after rewatering grown at (d) 30°C or (h) 40°C. Dark blue represents the coolest areas, as shown on scales on right. One‐way ANOVAs were performed to compare values for each day in each of the experiments conducted in (a, b, e, f). Asterisks indicate < 0.05 significance groups. = 10 plants. Error bars are plus/minus SEM. Owing to unequal variance, in (d) a Kruskal–Wallis one‐way ANOVA on ranks was performed.

References

    1. Ainsworth EA. 2008. Rice production in a changing climate: a meta‐analysis of responses to elevated carbon dioxide and elevated ozone concentration. Global Change Biology 14: 1642–1650.
    1. Alexandrov N, Tai S, Wang W, Mansueto L, Palis K, Fuentes RR, Ulat Victor J, Chebotarov D, Zhang G, Li Z et al 2015. SNP‐Seek database of SNPs derived from 3000 rice genomes. Nucleic Acids Research 43(D1): D1023–D1027. - PMC - PubMed
    1. Bouman B. 2009. How much water does rice use? Rice today 8: 28–29.
    1. van Campen JC, Yaapar MN, Narawatthana S, Lehmeier C, Wanchana S, Thakur V, Chater C, Kelly S, Rolfe SA, Quick WP et al 2016. Combined chlorophyll fluorescence and transcriptomic analysis identifies the P3/P4 transition as a key stage in rice leaf photosynthetic development. Plant Physiology 170: 1655–1674. - PMC - PubMed
    1. Casson S, Gray JE. 2008. Influence of environmental factors on stomatal development. New Phytologist 178: 9–23. - PubMed

Publication types