. 2019 Jun;21(6):1896-1915.
doi: 10.1111/1462-2920.14362. Epub 2018 Sep 18.

The mutual interplay between calcification and coccolithovirus infection

Affiliations

The mutual interplay between calcification and coccolithovirus infection

Christopher T Johns et al. Environ Microbiol. 2019 Jun.

Abstract

Two prominent characteristics of marine coccolithophores are their secretion of coccoliths and their susceptibility to infection by coccolithoviruses (EhVs), both of which display variation among cells in culture and in natural populations. We examined the impact of calcification on infection by challenging a variety of Emiliania huxleyi strains at different calcification states with EhVs of different virulence. Reduced cellular calcification was associated with increased infection and EhV production, even though calcified cells and associated coccoliths had significantly higher adsorption coefficients than non-calcified (naked) cells. Sialic acid glycosphingolipids, molecules thought to mediate EhV infection, were generally more abundant in calcified cells and enriched in purified, sorted coccoliths, suggesting a biochemical link between calcification and adsorption rates. In turn, viable EhVs impacted cellular calcification absent of lysis by inducing dramatic shifts in optical side scatter signals and a massive release of detached coccoliths in a subpopulation of cells, which could be triggered by resuspension of healthy, calcified host cells in an EhV-free, 'induced media'. Our findings show that calcification is a key component of the E. huxleyi-EhV arms race and an aspect that is critical both to the modelling of these host-virus interactions in the ocean and interpreting their impact on the global carbon cycle.


Figures

Figure 1
Figure 1
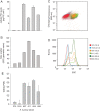
Calcification state of E. huxleyi strains grown in replete f/2‐Si media. (A) Cellular PIC quota, (B–D) side scatter (SSC) and (E) CaCO3:POC ratios were used as different proxies of calcification. SSC is represented in a variety of ways in order to show the geometric mean of the population (B), its relationship to cellular chlorophyll (692 nm; C) across strains and its frequency distribution across a range of SSC values. Strains are colour coded in panels (C) and (D). Numbers in parentheses correspond to the geometric mean in SSC. CaCO3:POC ratios in (E) are derived from data shown in (A). Error bars in (A), (B) and (E) represent the standard error for triplicate measurements (SD/n).
Figure 2
Figure 2
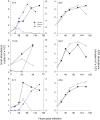
Host–virus infection dynamics for E. huxleyi strains grown in replete f/2‐Si media. Time course of host (circles) and virus (blue triangles) abundance for uninfected (closed circles; solid line) and EhV86‐infected (open circles; dotted line). No EhV86 production was detected for strains DHB607, DHB624 and DHB659, indicative of resistance. Host–virus dynamics shown were representative of experiments (n = 3) performed on different dates.
Figure 3
Figure 3
Calcification state of various E. huxleyi strains grown in defined ESAW media at different Ca2+ concentrations. (A) Cellular PIC quota for strains grown with either 0.1 mM or 10 mM Ca2+ concentrations. Error bars represent the standard error (SD/n) among triplicate measurements for one experiment; host–virus dynamics shown were representative of experiments (n = 3) performed on different dates. (B) Representative flow cytometry plot showing the SSC and chlorophyll (692 nm) signals for DHB607 grown in 10 mM or 0.1 mM Ca2+ compared to canonical naked strain CCMP374 grown in 10 mM Ca2+. Note the prominent shift to a lower SSC for DHB607 cells grown in 0.1 mM, matching that of the low SSC for CCMP374. (C) Percentage (%) decrease in both the mean cellular PIC quota and geometric mean of SSC for cells grown in 10 mM Ca2+ compared to those grown in 0.1 mM Ca2+ (asterisk for strain CCMP374 denotes that the % decrease in PIC derives from a 0 pg PIC cell−1 at 0.1 mM Ca2+). (D) CaCO3:POC ratios derived from the data in panel (A). We noted that growth in the ESAW artificial seawater medium at 10 mM Ca2+ did generally lower the total calcification state for all DHB strains compared to cells grown in f/2‐Si media (Figs 1A and 3A), likely due to the presence of additional factors in seawater‐based media that are required for maximum calcification. Nonetheless, these strains clearly calcified in ESAW media, maintained similar growth rates, and possessed similar cellular chlorophyll signatures, indicative of healthy cells. SEM images confirmed that there was plenty of calcite production in culture under these conditions, with the formation of fully formed coccospheres and detached coccoliths (Supporting Information Fig. S2).
Figure 4
Figure 4
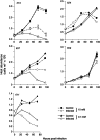
Host–virus infection dynamics for various E. huxleyi strains at different calcification states. Time course of host abundance for uninfected (closed circles; solid line) and EhV86‐infected (open circles; dotted line) E. huxleyi cells that were grown in ESAW with either 0.1 or 10 mM Ca2+. Data for EhV86 production for strains that showed evidence of infection (CCMP374, DHB607 and DHB611) are shown in Supporting Information Fig. S3; no EhV86 production was detected for strains DHB624 and DHB659. Error bars represent the standard deviation among triplicate measurements for one experiment; host–virus dynamics shown without error bars were representative of experiments (n = 3 for DHB607 and DHB624; n = 2 for DHB611) performed on different dates. Where not visible, error bars are smaller than symbol size.
Figure 5
Figure 5
Glycosphingolipid composition of various E. huxleyi strains grown in defined ESAW media at different Ca2+ concentrations. The cell quotas of (A) sialic acid GSL (sGSL), (B) host GSL (hGSL) and (C) sGSL:hGSL ratio for host cells acclimated and grown under either 0.1 or 10 mM Ca2+ are shown. Both sGSLs and hGSLs represent distinct families of GSLs, with the former having a hypothesized connection to infectivity, Ca2+ and calcification (Fulton et al., 2014) and the later serving as a more general lipid biomarker for E. huxleyi cells (Vardi et al., 2012). Asterisks indicate statistical differences (P < 0.05; n = 3) between low and high Ca2+ conditions. Error bars denote standard deviation among biological triplicates. Where error bars are not visible, they are smaller than bar line thickness.
Figure 6
Figure 6
Adsorption of EhVs to E. huxleyi and detached coccoliths. (A) Measured adsorption coefficients for naked CCMP374, naked DHB607 and calcified DHB607 (P < 0.001, n = 3). (B) Measured adsorption coefficients for sorted coccoliths from calcified DHB607 compared to calcified DHB607 cells (P < 0.001, n = 3). Error bars represent calculated standard error (SD/n) for triplicate measurements in one experiment. Panel (A) is shown with error bars, but the calculated standard error is smaller than bar line. Asterisks indicate statistical significance based on Student's t‐test.
Figure 7
Figure 7
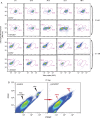
Dynamics of E. huxleyi calcification during EhV infection. (A) Time course of chlorophyll fluorescence (692 nm) and side scatter (SSC) for uninfected, control E. huxleyi cells (DHB607) and those challenged with EhV207. Cells were grown in ESAW with either 0.1 mM Ca2+ (naked cells) or 10 mM Ca2+ (calcified) and followed via flow cytometry for 96 hpi. Note the prominent shift to a lower SSC in the 10 mM Ca2+ cells at 24–48 hpi, indicative that a significant population of cells (~ 23%–45%) had shifted to a non‐calcified state. This is in contrast to cells grown in 0.1 mM Ca2+, which retain a very low SSC and are sensitive to infection (note decrease in cell number over the 96 h time period). Similar observations were seen when this same host was challenged with EhV86, with a somewhat delayed shift at 48–72 hpi (Supporting Information Fig. S8). (B) Relationship between PFSC light and OFSC light for EhV207‐infected cells at 72 hpi compared to controls. The former was characterized by prominent increases in detached coccoliths and reductions in calcified cells (indicated by red text and arrows).
Figure 8
Figure 8
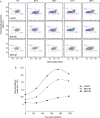
EhV‐induced media shifts host calcification. (A) Time course of chlorophyll fluorescence (692 nm) and side scatter (SSC) for uninfected E. huxleyi DHB607 cells that had been resuspended in different dilutions of ‘induced media’ (IM). IM was generated by infecting a calcifying culture (10 mM Ca2+) until a prominent shift in SSC was detected by flow cytometry (as per Fig. 7 at 72 hpi), at which point, all cells and viruses were removed by sequential filtration through 0.22 and 0.02 μm pore size filters. Healthy calcified cells were then resuspended in IM, and both chlorophyll and SSC dynamics were followed. Note that resuspension in 83% IM induced a similar shift in SSC by 72–96 h to that seen when cells were challenged with EhVs alone (Fig. 7 and Supporting Information Fig. S8), with no change in chlorophyll fluorescence. Control cells were resuspended in IM derived from uninfected control cells harvested at 72 h. (B) Time course of host abundance (measured by flow cytometry) for each aforementioned treatment. Note that no treatments resulted in the death of the cultures, but instead resulted in net growth, albeit to different levels and at different rates.

References

    1. Armstrong, R. A. , Lee, C. , Hedges, J. I. , Honjo, S. , and Wakeham, S. G. (2002) A new, mechanistic model for organic carbon fluxes in the ocean based don the quantitative association of POC with ballast minerals. Deep Sea Res Pt II: Top Stud Oceanogr 49: 219–236.
    1. Balch, W. M. , Kilpatrick, K. A. , Holligan, P. , Harbour, D. , and Fernandez, E. (1996) The 1991 coccolithophore bloom in the Central North Atlantic. 2. Relating optics to coccolith concentration. Limnol Oceanogr 41: 1684–1696.
    1. Balch, W. , D., D , Bowler, W. , and Booth, E. (2007) Prediction of pelagic calcification rates using satellite measurements. Deep Sea Res II: Top Stud Oceanogr 54: 478–495.
    1. Berelson, W. M. , Balch, W. M. , Najiar, R. , Feely, R. A. , Sabine, C. , and Lee, K. (2007) Relating estimates of CaCO3 production, export and dissolution in the water column to measurements of CaCO3 rain into sediment traps and dissolution on the sea floor: a revised global carbonate budget. Global Biogeochem Cycles 21: GB1024.
    1. Berges, J. A. , Franklin, D. J. , and Harrison, P. J. (2001) Evolution of an artificial seawater medium: improvements in enriched seawater, artificial water over the past two decades. J Phycol 37: 1138–1145.

Publication types

MeSH terms

LinkOut - more resources