. 2018 Sep 4;28(3):369-382.e5.
doi: 10.1016/j.cmet.2018.06.005. Epub 2018 Jun 28.

Inosine Monophosphate Dehydrogenase Dependence in a Subset of Small Cell Lung Cancers

Affiliations

Inosine Monophosphate Dehydrogenase Dependence in a Subset of Small Cell Lung Cancers

Fang Huang et al. Cell Metab. .

Abstract

Small cell lung cancer (SCLC) is a rapidly lethal disease with few therapeutic options. We studied metabolic heterogeneity in SCLC to identify subtype-selective vulnerabilities. Metabolomics in SCLC cell lines identified two groups correlating with high or low expression of the Achaete-scute homolog-1 (ASCL1) transcription factor (ASCL1High and ASCL1Low), a lineage oncogene. Guanosine nucleotides were elevated in ASCL1Low cells and tumors from genetically engineered mice. ASCL1Low tumors abundantly express the guanosine biosynthetic enzymes inosine monophosphate dehydrogenase-1 and -2 (IMPDH1 and IMPDH2). These enzymes are transcriptional targets of MYC, which is selectively overexpressed in ASCL1Low SCLC. IMPDH inhibition reduced RNA polymerase I-dependent expression of pre-ribosomal RNA and potently suppressed ASCL1Low cell growth in culture, selectively reduced growth of ASCL1Low xenografts, and combined with chemotherapy to improve survival in genetic mouse models of ASCL1Low/MYCHigh SCLC. The data define an SCLC subtype-selective vulnerability related to dependence on de novo guanosine nucleotide synthesis.

Keywords: IMPDH; lung cancer; metabolism; metabolomics; therapeutics.


Conflict of interest statement

DECLARATION OF INTERESTS

R.J.D. is an advisor for Agios Pharmaceuticals.

Figures
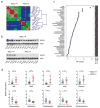
Figure 1
Figure 1. Distinct metabolomic subsets of human SCLC cell lines
a, Non-negative matrix factorization clustering of microarray gene expression shows two major clusters, designated as ASCL1High and ASCL1Low (ASCL1-H and ASCL1-L) in 29 SCLC lines. The ordered linkage tree demonstrates the relationship of gene expression patterns among these lines. b, ASCL1 abundance in 28 of the cell lines analyzed in a. c, Metabolites discriminating between 13 ASCL1High and 13 ASCL1Low cell lines subjected to metabolomic profiling. These metabolites have variable importance in the projection (VIP) scores of 1.0 or higher. The bar on the right indicates whether each metabolite is enhanced (red) or depleted (green) in each class. d, Relative abundance of intermediates from purine and methionine metabolism in ASCL1High and ASCL1Low cell lines. Individual data points are shown along with mean abundance values and S.D. for three independent cultures of each line.
Figure 2
Figure 2. Enhanced expression of enzymes involved in purine biosynthesis in ASCL1Low SCLC
a, Relative mRNA abundance of genes involved in purine metabolism. ASCL1High and ASCL1Low SCLC cell lines from Figure 1a were used in the analysis. b, Relative mRNA and protein abundance of IMPDH1 and IMPDH2 in 7 ASCL1High and 7 ASCL1Low cell lines. Individual data points are shown together with mean and S.D. for three independent cultures of each line. c, d, Heatmap and non-negative matrix factorization clustering of RNA-seq gene expression data from 81 SCLC primary tumors. Cluster 4 corresponds to the ASCL1Low subset. The heatmap highlights representative transcripts including MYC and several purine metabolic genes (in red). e, Gene set enrichment analysis reveals enrichment of the “REACTOME_purine metabolism” gene set in cluster 4 compared to the other three clusters in d. f, Relative mRNA abundance of IMPDH1 and IMPDH2 in clusters 1–3 versus cluster 4 tumors.
Figure 3
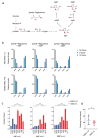
Figure 3. ASCL1Low SCLC cell lines have high rates of de novo purine biosynthesis
a, Schematic of de novo purine synthesis, illustrating labeling from [amide-15N]glutamine. b, Fractional labeling of IMP, GMP and AMP in H82 cells (ASCL1Low) and H2029 cells (ASCL1High) with [amide-15N]glutamine for 6 or 12 hours. “No tracer” indicates the mass distribution of cells cultured with unlabeled glutamine. c, Fractional labeling of IMP, GMP and AMP in 4 ASCL1High and 4 ASCL1Low lines cultured in medium containing [amide-15N]glutamine for 6 hours. Data are the average and S.D. of three cultures. d, Doubling time of five ASCL1High and five ASCL1Low lines, including all eight subjected to isotope labeling. Each cell line was cultured in triplicate to determine doubling time. Individual data points are shown together with mean and S.D. Abbreviation of metabolites: Ribose-5-P, Ribose 5-phosphate; 5-PRPP, 5-Phosphoribosyl pyrophosphate; PRA, 5-Phosphoribosylamine; FGAM, 5′-Phosphoribosylformylglycinamidine; IMP, Inosine 5′-monophosphate; XMP, Xanthosine 5′-monophosphate; GMP, Guanosine 5′-monophosphate; sAMP, Adenylosuccinate; AMP, Adenosine 5′-monophosphate; Gln, Glutamine; Glu, Glutamate; Asp, Aspartate.
Figure 4
Figure 4. ASCL1Low SCLC cell lines have high rates of de novo purine biosynthesis
a, Schematic of de novo purine synthesis, illustrating labeling from [U-13C]glucose. b, Fractional labeling of IMP, GMP and AMP in four ASCL1High and four ASCL1Low lines cultured in medium containing [U-13C]glucose for 1, 3, 6, 24 and 48 hours. Data are the average and S.D. of three cultures. The m+5 and m+6 isotopologues were the two most prominent labeled forms of these purines.
Figure 5
Figure 5. MYC regulates de novo purine nucleotide synthesis in ASCL1Low SCLC
a, b, Relative abundance of ASCL1 and MYC mRNA and protein in seven ASCL1High and seven ASCL1Low cell lines. Individual data points are shown along with mean abundance values and S.D. for two independent cultures of each line. c, Relative abundance of IMPDH1 and IMPDH2 mRNA and protein in ASCL1Low H82 cells after CRISPR/Cas9-mediated MYC knockout (MYC KO). d, Fractional labeling of GMP and IMP in empty vector control (EV) and MYC KO H82 cells after 4 hours of labeling in medium containing [amide-15N]glutamine. Data are the average and S.D. of three cultures. e, Relative mRNA abundance of ASCL1, IMPDH1, IMPDH2 and GMPS in RPR2 and RPM tumors. Gene expression data from GSE89660. f, Protein abundance of MYC, ASCL1, IMPDH1, IMPDH2 and GMPS in RPP and RPM tumors. g, Relative abundance of purine intermediates in RPP and RPM tumors. Individual data points are shown together with mean and S.D. for three independent tumor fragments from 9 mice in each group.
Figure 6
Figure 6. IMPDH is required for ASCL1Low SCLC cell growth
a, IC50 of IMPDH inhibitor MPA, MAT inhibitor cycloleucine and 5-Fluorouracil in ASCL1High and ASCL1Low cells. Individual data points are shown together with mean and S.D. of 14 lines for MPA and 10 lines for cycloleucine. Sensitivity of 60 cell lines to 5-Fluorouracil is from the Genomics of Drug Sensitivity in Cancer database. b, Relative growth of H345 (ASCL1High) and H526 (ASCL1Low) cells upon CRISPR/Cas9-mediated IMPDH1 knockout. c, Relative growth of H526 (ASCL1Low) cells treated with 1 μM MPA with or without 50 μM guanosine for 72 hours. d, Purine metabolite abundance in H524 (ASCL1Low) cells treated with 1 μM MPA for 12 hours. e, qPCR for transcripts of pre-rRNA, ATF4, E2F4, SDHB, IMPDH2, MYC and 5S rRNA in H524 cells treated with 1 μM MPA with or without 50 μM guanosine for 12 hours.
Figure 7
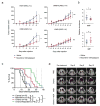
Figure 7. IMPDH is a druggable target required for ASCL1Low SCLC growth
a, Growth of subcutaneous xenografts in NSG mice derived from two ASCL1High and two ASCL1Low cell lines treated with the IMPDH inhibitor mizoribine (100 mg/kg every other day). Mean tumor volume and SEM are shown for each group (n=5 mice). The arrow indicates initiation of mizoribine dosing. b, Effect of mizoribine on XMP and IMP abundance in H524 xenografts. Individual data points are shown together with mean and S.D. for three independent tumor fragments from 5 mice in each group. c, Kaplan-Meier survival analysis of RPM mice treated with chemotherapy (cisplatin and etoposide) in combination with mizoribine. Cisplatin: 5 mg/kg once a week; etoposide: 10 mg/kg once a week; mizoribine: 100 mg/kg every other day. Dashed lines indicate chemotherapy treatment. From the 5th round of chemotherapy onwards, mice were treated with etoposide but not cisplatin. d, Representative microCT images from RPM mice pseudo-colored to differentiate tumors (yellow) from normal tissues/airway (purple).

References

    1. Akiyama T, Okazaki H, Takahashi K, Hasegawa A, Tanabe K, Uchida K, Takahara S, Toma H. Mizoribine in combination therapy with tacrolimus for living donor renal transplantation: analysis of a nationwide study in Japan. Transplant Proc. 2005;37:843–845. - PubMed
    1. Antonia SJ, Lopez-Martin JA, Bendell J, Ott PA, Taylor M, Eder JP, Jager D, Pietanza MC, Le DT, de Braud F, et al. Nivolumab alone and nivolumab plus ipilimumab in recurrent small-cell lung cancer (CheckMate 032): a multicentre, open-label, phase 1/2 trial. The Lancet Oncology. 2016;17:883–895. - PubMed
    1. Augustyn A, Borromeo M, Wang T, Fujimoto J, Shao C, Dospoy PD, Lee V, Tan C, Sullivan JP, Larsen JE, et al. ASCL1 is a lineage oncogene providing therapeutic targets for high-grade neuroendocrine lung cancers. Proceedings of the National Academy of Sciences of the United States of America. 2014;111:14788–14793. - PMC - PubMed
    1. Barretina J, Caponigro G, Stransky N, Venkatesan K, Margolin AA, Kim S, Wilson CJ, Lehar J, Kryukov GV, Sonkin D, et al. The Cancer Cell Line Encyclopedia enables predictive modelling of anticancer drug sensitivity. Nature. 2012;483:603–607. - PMC - PubMed
    1. Ben-Sahra I, Hoxhaj G, Ricoult SJ, Asara JM, Manning BD. mTORC1 induces purine synthesis through control of the mitochondrial tetrahydrofolate cycle. Science (New York, NY) 2016;351:728–733. - PMC - PubMed

Publication types

MeSH terms