. 2018 Oct 1;120(4):1753-1764.
doi: 10.1152/jn.00363.2018. Epub 2018 Jul 25.

M current regulates firing mode and spike reliability in a collision-detecting neuron

Affiliations

M current regulates firing mode and spike reliability in a collision-detecting neuron

Richard B Dewell et al. J Neurophysiol. .

Abstract

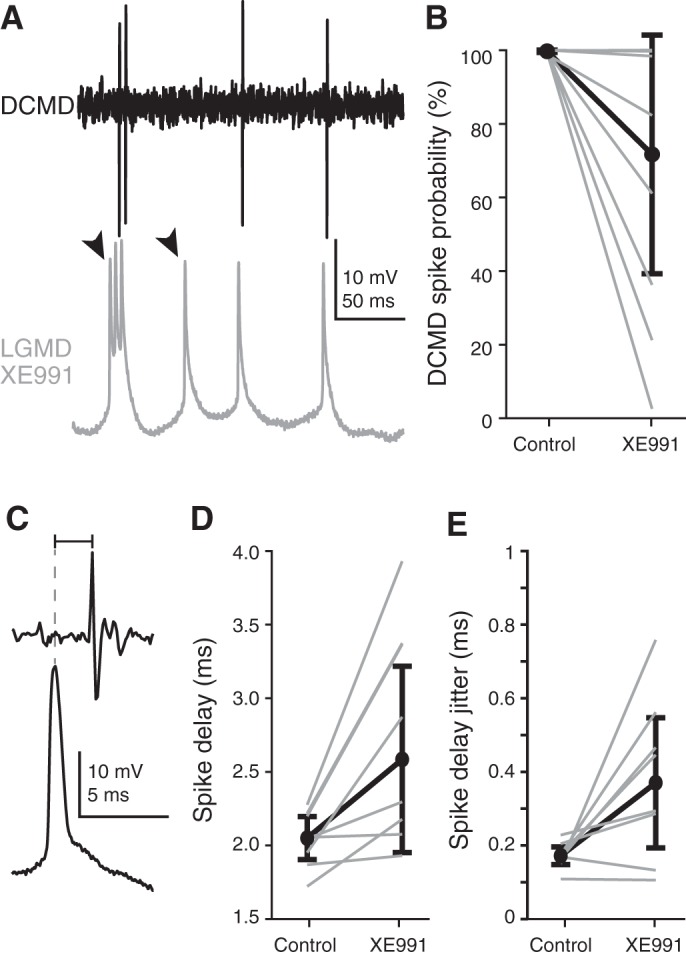
All animals must detect impending collisions to escape and reliably discriminate them from nonthreatening stimuli, thus preventing false alarms. Therefore, it is no surprise that animals have evolved highly selective and sensitive neurons dedicated to such tasks. We examined a well-studied collision-detection neuron in the grasshopper ( Schistocerca americana) using in vivo electrophysiology, pharmacology, and computational modeling. This lobula giant movement detector (LGMD) neuron is excitable by inputs originating from each ommatidia of the compound eye. It possesses many intrinsic properties that increase its selectivity to objects approaching on a collision course, including switching between burst and nonburst firing. In this study, we demonstrate that the LGMD neuron exhibits a large M current, generated by noninactivating K+ channels, that shortens the temporal window of dendritic integration, regulates a firing mode switch between burst and isolated spiking, increases the precision of spike timing, and increases the reliability of spike propagation to downstream motor centers. By revealing how the M current increases the LGMD's ability to detect impending collisions, our results suggest that similar channels may play an analogous role in other collision detection circuits. NEW & NOTEWORTHY The ability to reliably detect impending collisions is a critical survival skill. The nervous systems of many animals have developed dedicated neurons for accomplishing this task. We used a mix of in vivo electrophysiology and computational modeling to investigate the role of M potassium channels within one such collision-detecting neuron and show that through regulation of burst firing and enhancement of spiking reliability, the M current increases the ability to detect impending collisions.

Keywords: M current; burst firing; collision avoidance; lobula giant movement detector; spike timing.


Figures

Fig. 1.
Fig. 1.
Intracellular lobula giant movement detector (LGMD) recordings reveal a resting M conductance (gM). A, top: a schematic illustration of the LGMD. The recordings were taken from the region illustrated in black. SIZ, spike initiation zone. Bottom, a micrograph of the LGMD stained with Alexa 594 and the intracellular recording pipette. Scale bar, 100 µm. B: current steps were injected before (left) and after (right) application of the gM blocker XE991. Both hyperpolarizing and depolarizing currents generated larger changes in membrane potential after gM blockade. Traces have been median filtered to remove spikes. C: resting membrane potential (Vm) increased after gM blockade by XE991 (P = 0.0013; control, 11 recordings from 8 animals; XE991, 12 recordings from 8 animals). D: input resistance increased after gM blockade by XE991 (P = 1.9 × 10⁻⁷; control, 79 recordings from 59 animals; XE991, 13 recordings from 8 animals). E: membrane time constant (τm) increased after gM blockade by XE991 (P = 4.3 × 10⁻⁴; control, 83 recordings from 59 animals; XE911, 13 recordings from 8 animals). In C–E, central lines are medians, top and bottom box edges are 75th and 25th percentiles, whiskers denote the extent of data up to 1.5 times the interquartile range, and crosses denote outliers.
Fig. 2.
Fig. 2.
Injection of simulated excitatory postsynaptic potential (sEPSP) currents shows that M conductance (gM) reduces temporal summation. A: example traces before (control) and after block of gM with XE991. Each trace shows the lobula giant movement detector (LGMD) membrane potential in response to 5 sEPSP currents (dashed traces; Stim) with delays of either 5 (bottom) or 10 ms (top). After gM blockade, the summation of theses sEPSPs increased for both delays (measured as %change from peak of first to peak of fifth sEPSP). B: summation decreased exponentially with longer sEPSP delays. Summation was higher for delays of 5 (P = 0.006), 10 (P = 0.001), and 20 ms (P = 0.003); data were recorded after XE991 application with a delay of 15 ms for only 1 animal. C: measuring the mean input resistance (Ri) associated with sEPSP revealed a 50% increase in total sEPSP response after gM blockade by XE991 (P = 3.5 × 10⁻⁷). For B and C, control data originate from 10 recordings from 6 animals and XE991 data from 5 recordings from 3 animals. In C, central lines are medians, top and bottom box edges are 75th and 25th percentiles, and whiskers denote the extent of data.
Fig. 3.
Fig. 3.
Blockade of M conductance (gM) increased burst firing. A: example responses to looming stimuli (l/|v| = 50 ms) before and after gM blockade by XE991. Top, schematic of looming stimulus where l is half-size; v is approach speed, and θ is half-angular subtense at the eye. Black line shows the nonlinear increase in angular subtense (2θ), characteristic of looming stimuli. Bottom, example responses from 2 animals after XE991 addition show an increase in bursting with clear pauses in firing that were not seen in control looming responses. Dashed vertical line indicates the projected time of collision. B: depolarizing step currents generated rhythmic bursting after application of XE991 instead of the isolated spikes generated in control. C: a probability histogram of the interspike intervals (ISIs) exhibits a large increase in intervals of ~4 ms after XE991 addition. D: the prevalence of burst spikes (those with ISIs of 2–5 ms) increased after XE991. Gray lines show data from individual animals (n = 8). Black lines show the population response; circles are medians, error bars are ± median average deviation (mad). Analyses in C and D included 4,684 spikes for control and 14,865 spikes after XE991 application from 8 animals.
Fig. 4.
Fig. 4.
Reliability of spike timing in the lobula giant movement detector (LGMD) decreased after M channel blockade. A: Illustration of the spike phase measurement. Spikes that occurred at the peaks (dashed red lines) and troughs of the input chirp current were considered to be at 0° and ±180°, respectively. Spikes occurring during the rising slope of the current have a negative phase, and those occurring during the falling slope have a positive phase. B: an example trace showing high firing elicited by a chirp current superposed on a depolarizing holding current (2 nA). C: expanded regions of the same trace as in B plus a simultaneous recording from another dendritic location (gray) show spiking during low (top) and high (bottom) input frequencies. Dashed red lines mark 0° phase. At low input frequencies most spikes are generated on the rising (negative) phase, but at high frequencies they come on the falling (positive) phase. The measured spike phase was independent of the recording location (although not necessarily of the current injection location) due to the high synchrony of backpropagating action potentials across dendritic locations. D: scatter plot showing the spike phase progression over the chirp current. Linear fits for the population and individual animals are shown in red and blue, respectively, and illustrate the consistency across animals. The 0° phase crossing (dashed line) was 6.2 ± 1.2 Hz. Analysis includes 1,074 spikes from 9 animals (r = 0.63, P = 5.7 × 10−120). Red line fit: y = a + bx, where a = −20.4° and b = 3.33°/Hz. E: the spike phase probability distribution for control data (gray bars) shows that spikes cluster around 0° with high phase coherence. If the M current is blocked (green bars; 3,666 spikes from 5 animals), a large reduction in phase coherence is seen (P = 1.2 × 10−56, F-test). Spike phase coherence was >0.65 for all control animals, and median spike phase was 5.2°. F: spike phase was converted to the time domain by dividing by the stimulus frequency (see materials and methods). This revealed that in control conditions, spikes were grouped near 0°, with 65% within 10 ms of 0° [median ± median average deviation (mad) = 1.95 ± 5.94 ms]. After XE991, the spike timing was less consistent and more spikes trailed the input current peak (10% within 10 ms of 0°; median ± mad = 16.9 ± 38.1 ms). G: for control data there was no clear preferred frequency for spike generation. After blocking of the M current, a large proportion of spikes were generated at 2–5 Hz.
Fig. 5.
Fig. 5.
Blocking M conductance (gM) in the lobula giant movement detector (LGMD) causes failures in descending contralateral movement detector (DCMD) spike initiation. A: example trace of a LGMD-DCMD recording pair after gM blockade by XE991 (300 mM). Arrowheads mark LGMD spikes that fail to initiate DCMD spikes. B: under control conditions, LGMD spikes reliably initiate DCMD spikes (average of 99.7% of LGMD spikes had clear matched DCMD spikes with 1.3- to 4.8-ms delay). After gM blockade by XE991, this was substantially reduced. Data from individual animals are displayed with gray lines; 6 of 8 animals had significant reductions in DCMD spike initiations (P < 0.05). On average, only 62.7% of LGMD spikes initiated DCMD spikes after gM block; black circles and lines are median ± median average deviation (mad) of individual percentages. C: for LGMD-DCMD spike pairs, the spike delay was measured from the peak of the intracellular LGMD spike (dashed line) to the peak of the extracellular DCMD spike. D: in all 8 animals tested, the spike delay significantly increased after gM blockade with an average increase of 0.7 ms (P < 0.01). Individual animal data are shown in gray; black circles and lines are median ± mad of individual means. E: in 6 of 8 animals there was also a reduction in the consistency of the spike delay (P = 0.039, sign rank test) with an average increase in the SD of the spike delay of 0.2 ms (P = 0.032, paired t-test).
Fig. 6.
Fig. 6.
A multicompartmental model of the lobula giant movement detector (LGMD) reproduced the subthreshold effects of M conductance (gM). A: illustration of the model morphology from 2 orientations. The LGMD’s 3 dendritic fields (shown in blue) had an average gM density of 26 µS/cm2 at resting membrane potential (Vrest; −65 mV). The LGMD’s primary neurite (shown in black), which connects the dendritic fields to the spike initiation zone (SIZ; red) and continues because the axon (green) had an average conductance density of 93 µS/cm2 at Vrest. The axon extends farther than shown and had a total length of 463 µm. B: the gM value used for simulations had a broad steady-state activation curve with steepness of 12 mV. C: the time constant of gM activation (τm) had a minimum and maximum of 2.5 and 21 ms. D: removal of gM to simulate XE991 application increased the resting membrane potential (resting Vm) by 2.7–3.5 mV. For all simulations, data ranges and variability are from measurements of different model sections. E: measured input resistance (Ri) to step currents increased by 25–42% after gM reduction. F: membrane time constant also increased after simulated XE991 application, by 41–55%. In D–F, central lines are medians, top and bottom box edges are 75th and 25th percentiles, and whiskers denote the extent of data. G: measured summation to simulated excitatory postsynaptic potentials (sEPSPs) increased for all delays after simulated XE991 application; circles and error bars are medians ± mad. Inset shows traces of injected current and membrane potential for sEPSPs with delays of 10 ms. H: median effective Ri to sEPSPs increased from 5.0 to 8.7 MΩ after gM blockade.
Fig. 7.
Fig. 7.
Model lobula giant movement detector (LGMD) reproduced the role of M conductance (gM) in the LGMD’s spiking pattern. A and B: simulated effect of gM blockade on depolarizing current steps (A) and chirp currents (B) injected into different dendritic sections to induce spiking. For control chirp currents, a constant depolarizing current was superposed (2.5 nA in example trace in B, left). C: after gM blockade, there was a shift in the interspike interval (ISI) distribution, with the proportion of spikes with ISIs of 2–5 ms increasing from 13% to 44%. D: as in the experimental data, a spike phase progression occurred with increasing chirp frequency. Data are displayed as in Fig. 4D but with each line representing data recorded from different model compartments instead of different recordings. E: a broadening of the spike phase distribution produced a 37% reduction in spike phase coherence after gM blockade. F: the decreased reliability in spike time is shown after conversion of the phase to time from peak current. The spikes occurring within 10 ms of 0° decreased from 62% to 19% after gM blockade (compare with Fig. 4F). G: the model LGMD also produced a shift to a larger percentage of spikes being generated by low-frequency inputs.

References

    1. Adams PR, Brown DA. Synaptic inhibition of the M-current: slow excitatory post-synaptic potential mechanism in bullfrog sympathetic neurones. J Physiol 332: 263–272, 1982. doi:10.1113/jphysiol.1982.sp014412. - DOI - PMC - PubMed
    1. Allen KM, Marsat G. Task-specific sensory coding strategies are matched to detection and discrimination performance. J Exp Biol 221: jeb170563, 2018. doi:10.1242/jeb.170563. - DOI - PubMed
    1. Barrow AJ, Wu SM. Low-conductance HCN1 ion channels augment the frequency response of rod and cone photoreceptors. J Neurosci 29: 5841–5853, 2009. doi:10.1523/JNEUROSCI.5746-08.2009. - DOI - PMC - PubMed
    1. Battefeld A, Tran BT, Gavrilis J, Cooper EC, Kole MHP. Heteromeric Kv7.2/7.3 channels differentially regulate action potential initiation and conduction in neocortical myelinated axons. J Neurosci 34: 3719–3732, 2014. doi:10.1523/JNEUROSCI.4206-13.2014. - DOI - PMC - PubMed
    1. Brown DA, Adams PR. Muscarinic suppression of a novel voltage-sensitive K+ current in a vertebrate neurone. Nature 283: 673–676, 1980. doi:10.1038/283673a0. - DOI - PubMed

Publication types

Substances

LinkOut - more resources