. 2018 Jul 25;16(7):e2005769.
doi: 10.1371/journal.pbio.2005769. eCollection 2018 Jul.

Blindsight relies on a functional connection between hMT+ and the lateral geniculate nucleus, not the pulvinar

Affiliations

Blindsight relies on a functional connection between hMT+ and the lateral geniculate nucleus, not the pulvinar

Sara Ajina et al. PLoS Biol. .

Abstract

When the primary visual cortex (V1) is damaged, the principal visual pathway is lost, causing a loss of vision in the opposite visual field. While conscious vision is impaired, patients can still respond to certain images; this is known as 'blindsight'. Recently, a direct anatomical connection between the lateral geniculate nucleus (LGN) and human motion area hMT+ has been implicated in blindsight. However, a functional connection between these structures has not been demonstrated. We quantified functional MRI responses to motion in 14 patients with unilateral V1 damage (with and without blindsight). Patients with blindsight showed significant activity and a preserved sensitivity to speed in motion area hMT+, which was absent in patients without blindsight. We then compared functional connectivity between motion area hMT+ and a number of structures implicated in blindsight, including the ventral pulvinar. Only patients with blindsight showed an intact functional connection with the LGN but not the other structures, supporting a specific functional role for the LGN in blindsight.


Conflict of interest statement

The authors have declared that no competing interests exist.

Figures

Fig 1
Fig 1. fMRI responses to motion for patients with V1 lesions and controls.
Results are shown separately for (A) blindsight-positive patients, (B) blindsight-negative patients, and (C) healthy controls. (i) Significant activity for moving versus static dots in the blind right hemifield of patients with left V1 lesions and (ii) the blind left hemifield of patients with right V1 lesions. Mixed effects analyses, P < 0.001 uncorrected for a priori regions of interest, elsewhere cluster-corrected p < 0.01. Shaded blue areas are binarized Jülich-defined probabilistic maps of hMT+, radiological convention. (iii) Mean contralateral hMT+ signal change averaged across all five stimulus conditions, comparing sighted (blue) and blind (red) hemifields ± SEM. In controls, ‘Left HF’ refers to left hemifield, ‘Right HF’ is right hemifield. * significant activity above baseline p < 0.05, ψ p ≤ 0.001, ns = not significant. P values are from t tests. (iv) Mean signal change in contralateral hMT+ as a function of stimulus speed, shown separately for each hemifield (blue squares are sighted hemifield, red diamonds are blind hemifield). Responses to static stimuli are dotted (left/sighted hemifield) or dashed (right/blind hemifield) lines. Underlying data for iii and iv can be found in S1 Data. fMRI, functional MRI; SEM, standard error of the mean; V1, primary visual cortex.
Fig 2
Fig 2. Functional connectivity of the visual pathways in patients and controls.
(A) Correlation of LGN and V1 in the same (undamaged) hemisphere over the entire fMRI timeseries, after stimulus-evoked activity has been regressed out. (B) Correlation of hMT+ bilaterally. Box plots show Fischer-corrected mean correlation coefficients comparing participant group ± SEM. Statistical symbols represent significance levels for one sample t-tests against baseline (zero): ε p ≤ 0.0001, * p < 0.001. Scatterplots are individual examples of fMRI signal in ROI1 versus ROI2. Each point represents a single fMRI volume. Plots for patients in panel A are correlations in the contralesional hemisphere. BS+ is blindsight positive, and BS- blindsight negative. Underlying data can be found in S2 Data. fMRI, functional MRI; LGN, lateral geniculate nucleus; ROI, region of interest; SEM, standard error of the mean; V1, primary visual cortex.
Fig 3
Fig 3. Functional connectivity of subcortical hMT+ pathways in patients and controls.
(A) Correlation of LGN and hMT+. (B) Correlation of ventral pulvinar and hMT+. (C) Correlation of SC and hMT+. Box plots show Fischer-corrected mean correlation coefficients comparing each participant group ± SEM. Results are shown separately for the intact (solid boxes) and damaged hemispheres (striped boxes), and for left (striped) and right (solid) hemispheres in controls. Underlying data can be found in S3 Data. LGN, lateral geniculate nucleus; SC, superior colliculus; SEM, standard error of the mean.
Fig 4
Fig 4. Seed region correlation maps for LGN and ventral pulvinar, in patients and controls.
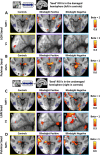
‘Seed regions’ are (A) LGN in the damaged hemisphere (left in controls), (B) ventral pulvinar in the damaged hemisphere (left in controls), (C) LGN in the undamaged hemisphere (right in controls), (D) ventral pulvinar in the undamaged hemisphere (right in controls). Results are shown separately for controls (left column), blindsight-positive patients (middle column), and blindsight-negative patients (right column). Mixed effects analyses, displayed on average high-resolution structural scans transformed to MNI space (radiological convention). Shaded blue areas are binarized Jülich-defined probabilistic maps of hMT+. LGN, lateral geniculate nucleus; MNI, Montreal Neurological Institute.
Fig 5
Fig 5. Seed region correlation maps for human motion area (hMT+), in patients and controls.
‘Seed region’ is (A) hMT+ in the damaged hemisphere (left in controls) and (B) hMT+ in the undamaged hemisphere (right in controls). Results shown separately for controls (left column), blindsight-positive patients (middle column), and blindsight-negative patients (right column). Upper rows show axial slices through early visual cortex and hMT+; lower rows show coronal slices through LGN. Mixed effects analyses, displayed on average high-resolution structural scans, transformed to MNI space (radiological convention). Shaded green areas are binarized Jülich-defined probabilistic maps of LGN. LGN, lateral geniculate nucleus; MNI, Montreal Neurological Institute.

References

    1. Zhang X, Kedar S, Lynn MJ, Newman NJ, Biousse V. Homonymous hemianopias. Clinical–anatomic correlations in 904 cases. Neurology. 2006; 66: 906–910. 10.1212/01.wnl.0000203913.12088.93 - DOI - PubMed
    1. Weiskrantz L, Warrington EK, Sanders MD, Marshall J. Visual capacity in the hemianopic field following a restricted occipital ablation. Brain. 1974; 97: 709–28. - PubMed
    1. Ajina S, Pestilli F, Rokem A, Kennard C, Bridge H. Human blindsight is mediated by an intact geniculo-extrastriate pathway. eLife. 2015; 4, e08935 10.7554/eLife.08935 - DOI - PMC - PubMed
    1. Le Bihan D, Johansen-Berg H. Diffusion MRI at 25: Exploring brain tissue structure and function. Neuroimage. 2012; 61(2): 324–341. 10.1016/j.neuroimage.2011.11.006 - DOI - PMC - PubMed
    1. Leh SE, Johansen-Berg H, Ptito A. Unconscious vision: new insights into the neuronal correlate of blindsight using diffusion tractography. Brain. 2006; 129, 1822–1832. 10.1093/brain/awl111 - DOI - PubMed

Publication types

LinkOut - more resources