. 2018 Jul 25;13(7):e0199621.
doi: 10.1371/journal.pone.0199621. eCollection 2018.

A microRNA signature and TGF-β1 response were identified as the key master regulators for spaceflight response

Affiliations

A microRNA signature and TGF-β1 response were identified as the key master regulators for spaceflight response

Afshin Beheshti et al. PLoS One. .

Abstract

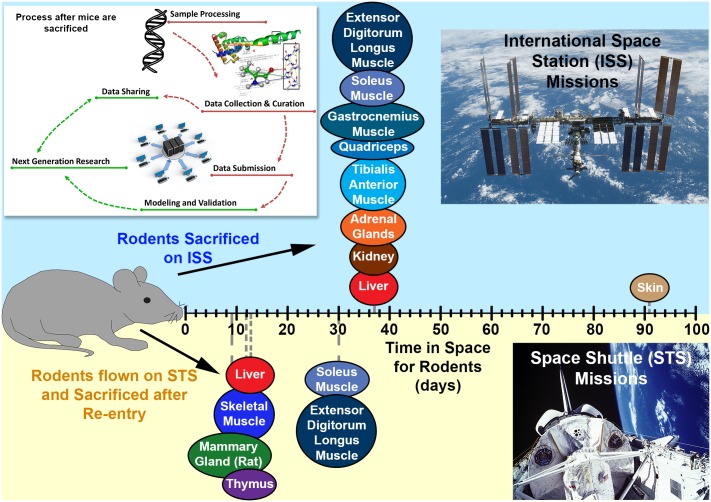
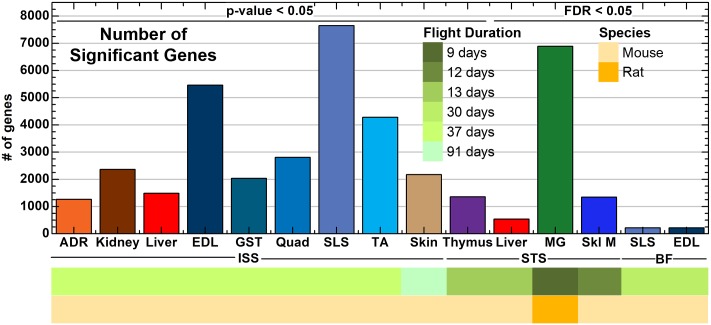
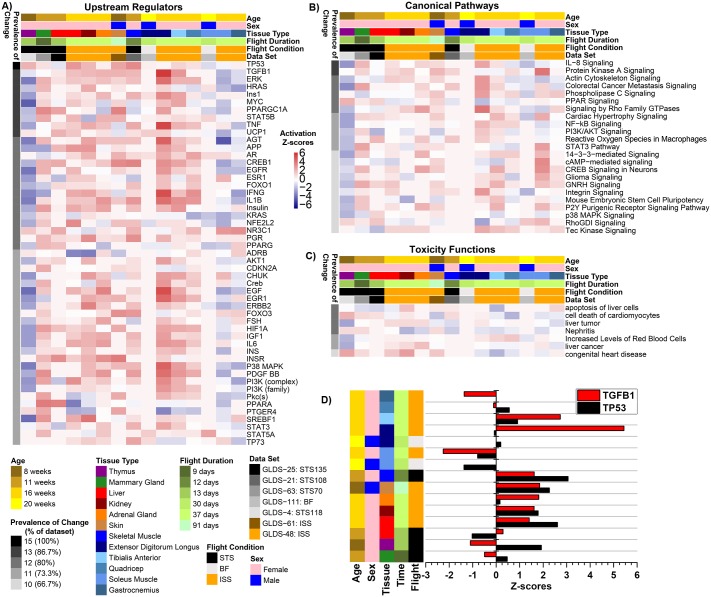
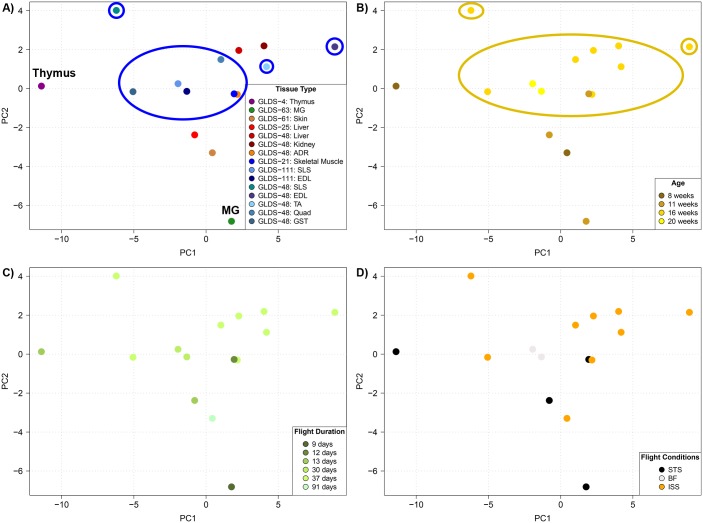
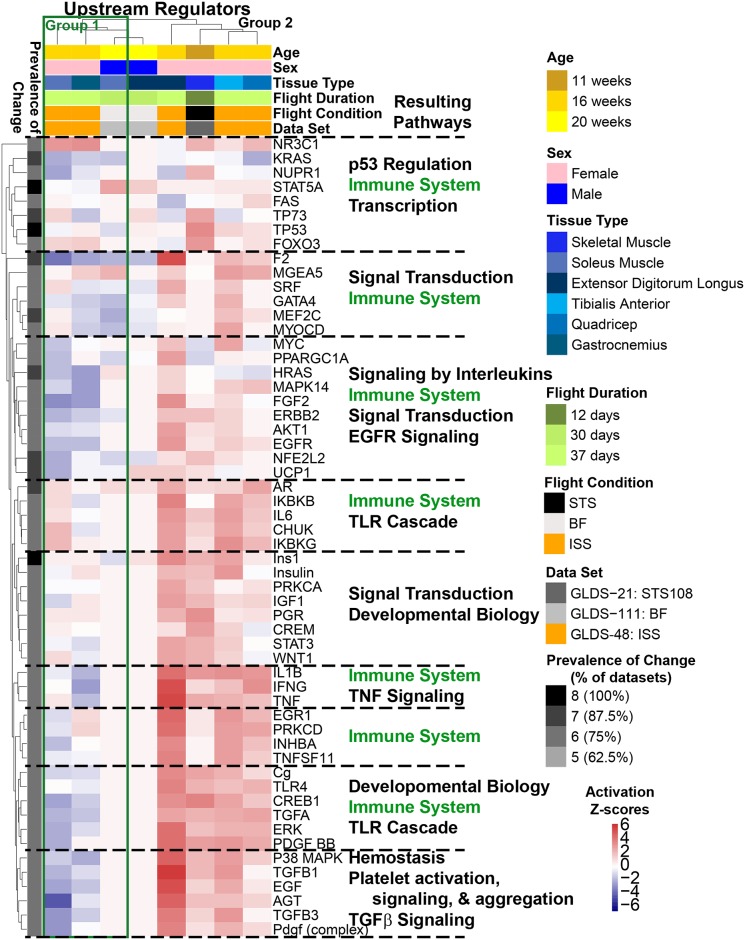
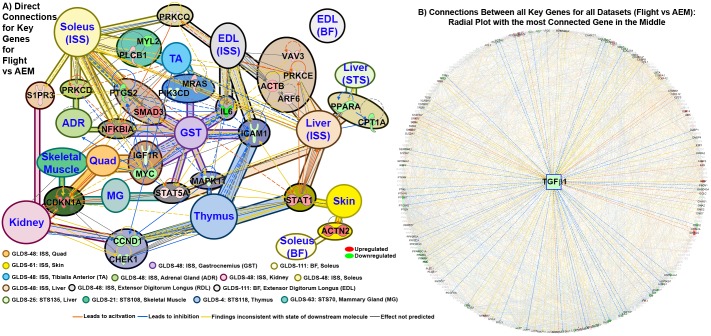
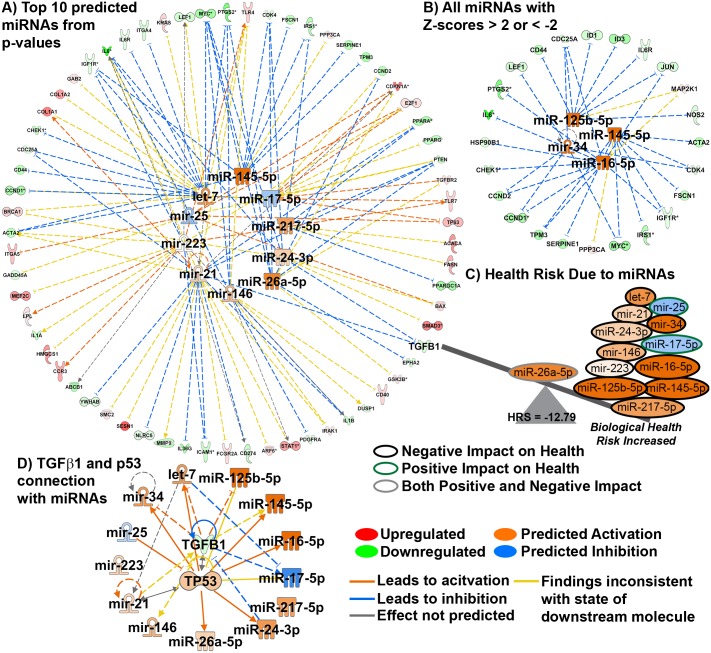
Translating fundamental biological discoveries from NASA Space Biology program into health risk from space flights has been an ongoing challenge. We propose to use NASA GeneLab database to gain new knowledge on potential systemic responses to space. Unbiased systems biology analysis of transcriptomic data from seven different rodent datasets reveals for the first time the existence of potential "master regulators" coordinating a systemic response to microgravity and/or space radiation with TGF-β1 being the most common regulator. We hypothesized the space environment leads to the release of biomolecules circulating inside the blood stream. Through datamining we identified 13 candidate microRNAs (miRNA) which are common in all studies and directly interact with TGF-β1 that can be potential circulating factors impacting space biology. This study exemplifies the utility of the GeneLab data repository to aid in the process of performing novel hypothesis-based research.


Conflict of interest statement

All authors declare no competing financial interests and conflict of interest with the data and information in this manuscript.

Figures

Fig 1
Fig 1. Illustration of methodology and tissues used for analysis.
A schematic representation of the process flow in obtaining the omics dataset from GeneLab database from the tissues used for analyses in this manuscript is shown on the top left. The different tissues have been plotted along an x-axis for the amount of the time the rodents were in space before sacrificing. The upper panel (blue) represents tissues from rodents on the international space station (ISS) and the lower panel (yellow) represents the tissues from rodents on space shuttle missions (STS).
Fig 2
Fig 2. The number of statistically significant genes determined for each tissue and dataset.
A bar plot representing the number of significant genes for each tissue from all datasets either determined by t-test with p-value ≤ 0.05 or with FDR ≤ 0.05. The tissues are separated by the flight conditions for the rodents with ISS = International Space Station, STS = Space Shuttle Mission, and BF = Bion. The color-coded bar on the bottom of the plot represents datasets associated with Flight Duration and Rodent Species.
Fig 3
Fig 3. Predicted functions and upstream regulators affected by microgravity.
The predicted statistically significant upstream regulators (A), canonical pathways (B), and toxicity functions (C) determined through IPA from data for each individual tissue/dataset using activation Z-score statistics. Heat map representation of the activation Z-score values (red = positive activation Z-score for activation and blue = negative activation Z-score for inhibition) were used to display the data. The prevalence of change (or % of dataset) on the left side of the heat maps represents how common that factor is throughout all datasets/tissues with the darkest color representing factors with the highest degree in common. Age, sex, tissue type, time in flight, flight conditions, and gene lab dataset reference is color coded on the top of the heat maps. For the upstream regulators (A) each major cluster of upstream regulators is further analyzed for the major functions it will impact represented by the Resulting Pathways. D) A bar graph representing predicted activity of TGF-β1 and TP53 through z-score statistics comparing tissue type, time of flight, and flight conditions, age and sex of the animals.
Fig 4
Fig 4. Global clustering of the upstream regulators for all tissue types.
Principle Component Analysis (PCA) on the upstream regulators for each A) tissue type, B) age, C) flight duration, and D) flight condition. In A) the Thymus and Mammary Gland (MG) are specifically labeled for clarity in and the muscle data points are circles in blue. In B) a dark yellow circles all date points representing ≥ 16 weeks of age.
Fig 5
Fig 5. Predicted upstream regulators for muscle tissue affected by microgravity.
The statistically significant predicted upstream regulators determined by IPA from data for each individual tissue/dataset using activation Z-score statistics. Heat map representation with hierarchical clustering of the activation Z-score values (red = positive activation Z-score for activation and blue = negative activation Z-score for inhibition) were used to display the data. The prevalence of change (or % of dataset) on the left side of the heat maps represents how common that factor is throughout all datasets/tissues with the darkest color representing factors with the highest degree in common. Age, sex, tissue type, time in flight, flight conditions, and gene lab dataset reference is color coded on the top of the heat maps. Each major cluster of upstream regulators is further analyzed for the major functions it will impact represented by the Resulting Pathways. The green box represents the division between group 1 of muscles (consisting of Soleus and Gastrocnemius) and group 2 (consisting of Extensor Digitorum Longus, Tibialis Anterior, and Quadriceps) having an overall opposite regulation for most of the upstream regulators.
Fig 6
Fig 6. Key genes and master regulators driving pan-tissue microgravity response.
A) A connectivity network for each set of key genes determined independently for each tissue/dataset. The key genes associated with each individual tissue/dataset are represented by different background colors as indicated in the legend. Overlapping key genes (blue font) between each tissue type is represented by background colors and is considered as central nodes. The cluster of key genes for each dataset that are not connected are grouped and shown as one circle. Details for each of these clusters of key genes for each dataset can be seen in S2 Fig. The color of the gene represents whether the gene is upregulated (red) or downregulated (green) with the shade signifying the degree of regulation. The different line colors represent the predicted effect of each gene on each other. B) A radial plot of all connections between all key genes with the most connected gene displayed in the middle (TGFβ1). The key genes with direct connections to TGFβ1 are shown with all other connections shown with faded color.
Fig 7
Fig 7. A microgravity associated circulating miRNA signature.
A) A radial plot showing the top 10 predicted miRNAs with p-values ≤ 1.17 × 10⁻⁸ determined from all key genes and the key genes directly related the miRNAs. B) All statistical significant miRNAs predicted from all key genes with activation Z-score ≥ 2 or ≤ -2 and the corresponding key genes associated with these miRNAs. The predicted activity of each miRNA (blue = inhibition and orange = activation) was determined through activation Z-score statistics through IPA. C) A graphical representation of the health risk score (HRS) illustrating how each miRNA contributes to the calculation. The outline for each miRNA represents if the miRNA has a negative impact on health (black), positive impact on health (olive), and has both positive and negative impact on health (grey). D) Radial plot connecting TGFβ1 with p53 and all miRNAs. Through activation Z-score statistics in IPA it was determined that p53 will be activated due to the impact of TGFβ1 and the miRNAs.

References

    1. Gambara G, Salanova M, Ciciliot S, Furlan S, Gutsmann M, Schiffl G, et al. Gene Expression Profiling in Slow-Type Calf Soleus Muscle of 30 Days Space-Flown Mice. PLoS One. 2017;12(1):e0169314 10.1371/journal.pone.0169314 . - DOI - PMC - PubMed
    1. Andreev-Andrievskiy A, Popova A, Boyle R, Alberts J, Shenkman B, Vinogradova O, et al. Mice in Bion-M 1 space mission: training and selection. PLoS One. 2014;9(8):e104830 10.1371/journal.pone.0104830 . - DOI - PMC - PubMed
    1. Mao XW, Pecaut MJ, Stodieck LS, Ferguson VL, Bateman TA, Bouxsein ML, et al. Biological and metabolic response in STS-135 space-flown mouse skin. Free Radic Res. 2014;48(8):890–7. 10.3109/10715762.2014.920086 . - DOI - PubMed
    1. Allen DL, Bandstra ER, Harrison BC, Thorng S, Stodieck LS, Kostenuik PJ, et al. Effects of spaceflight on murine skeletal muscle gene expression. J Appl Physiol (1985). 2009;106(2):582–95. 10.1152/japplphysiol.90780.2008 . - DOI - PMC - PubMed
    1. Jonscher KR, Alfonso-Garcia A, Suhalim JL, Orlicky DJ, Potma EO, Ferguson VL, et al. Spaceflight Activates Lipotoxic Pathways in Mouse Liver. PLoS One. 2016;11(4):e0152877 10.1371/journal.pone.0152877 . - DOI - PMC - PubMed

Publication types

LinkOut - more resources