. 2018 Jul 25;13(7):e0201076.
doi: 10.1371/journal.pone.0201076. eCollection 2018.

Cerebral blood perfusion deficits using dynamic susceptibility contrast MRI with gadolinium chelates in rats with post-ischemic reperfusion without significant dynamic contrast-enhanced MRI-derived vessel permeabilities: A cautionary note

Affiliations

Cerebral blood perfusion deficits using dynamic susceptibility contrast MRI with gadolinium chelates in rats with post-ischemic reperfusion without significant dynamic contrast-enhanced MRI-derived vessel permeabilities: A cautionary note

Seokha Jin et al. PLoS One. .

Abstract

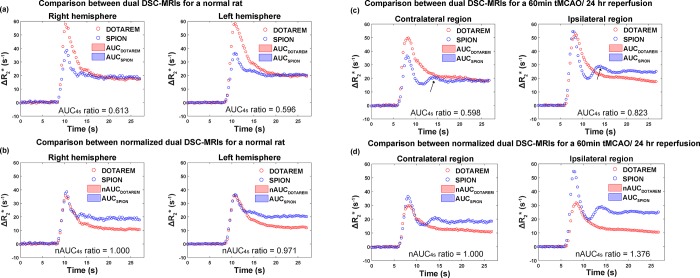
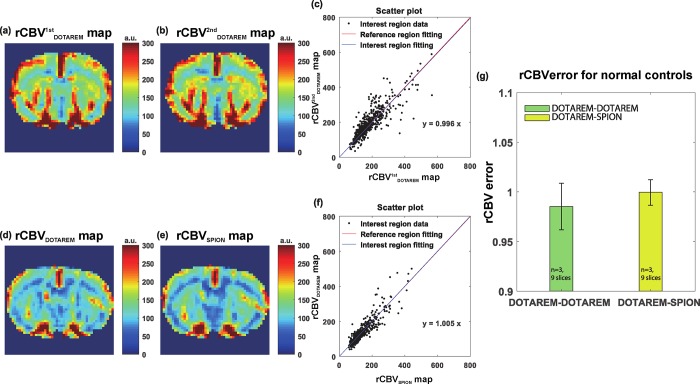
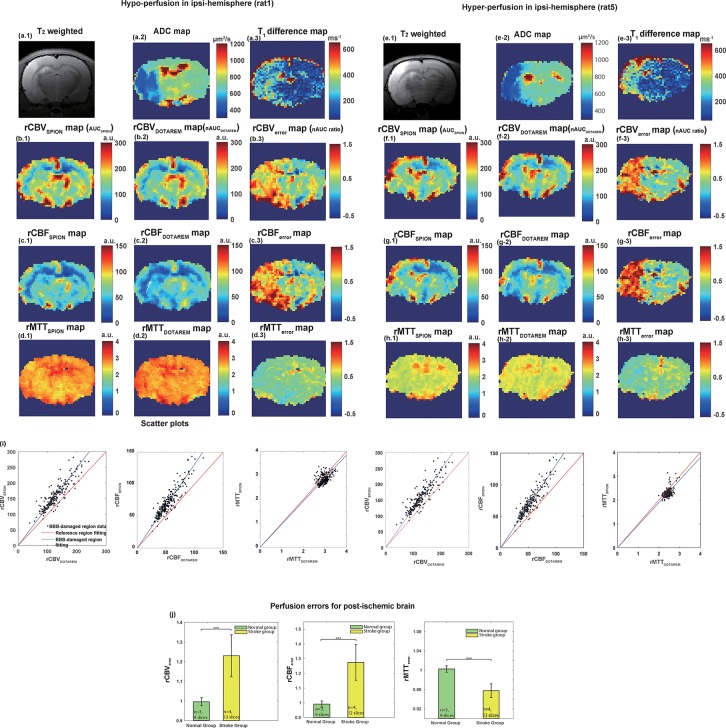
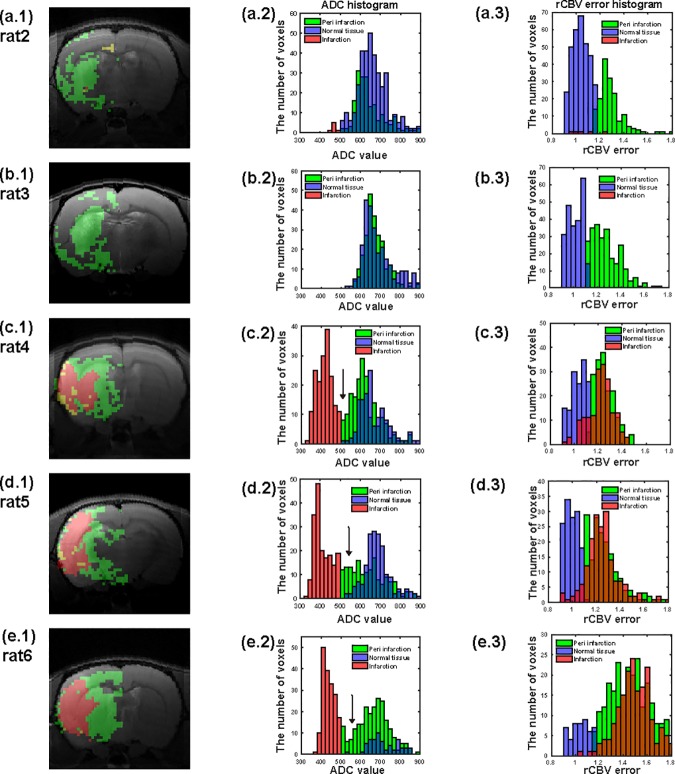
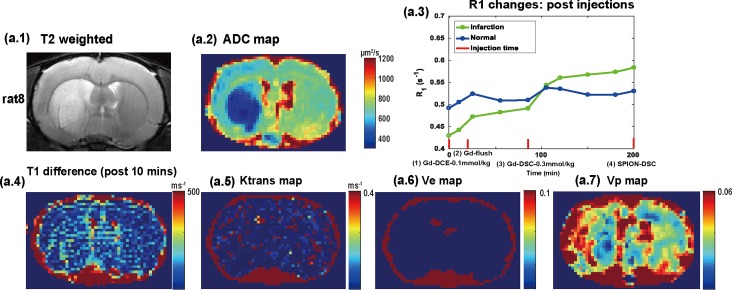
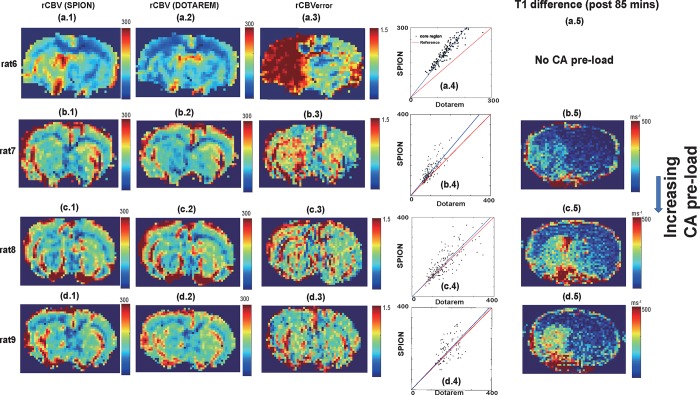
In this study, we quantified perfusion deficits using dynamic susceptibility contrast magnetic resonance imaging (DSC-MRI) with an extravasating contrast agent (CA). We also investigated the efficacy of leakage compensation from CA pre-load in brains from post-ischemic rat models without significant dynamic contrast-enhanced MRI (DCE-MRI)-derived vessel wall permeability. DSC measurements were obtained using fast (0.3 s) echo-planar imaging in both normal rats and rats with transient middle carotid artery occlusion (MCAO) (1-h MCAO, 24-h reperfusion) after successive administrations of gadoterate meglumine (Dotarem) and intravascular superparamagnetic iron oxide nanoparticles (SPION). The relative cerebral blood volume (CBV) and cerebral blood flow (CBF) values acquired using Dotarem were significantly underestimated (~20%) when compared to those acquired using SPION in ipsilesional post-ischemic brain regions. A slight overestimation of relative mean transit time was observed. Areas with underestimated CBV and CBF values from the corresponding error maps encompassed the area of infarcted tissue (apparent diffusion coefficient < 500 μm2/s) and mostly coincided with the area wherein conspicuous longitudinal relaxation time differences were observed pre- vs. post-injection of Dotarem. The DSC measurements with significant pre-load (0.3 mmol·kg-1) of Dotarem displayed minimal perfusion deficits when compared to those determined using the reference intravascular SPION.


Conflict of interest statement

The authors have declared that no competing interests exist.

Figures

Fig 1
Fig 1. The process of nAUC ratio value estimation.
(a) ΔR2* curve and AUC of SPION and Dotarem for unnormalized DSC-MRI signal of normal rat. Corresponding AUC ratio values were 0.613 and 0.596 for right and left hemispheres, respectively. (b) ΔR2* curve and AUC of SPION and Dotarem for normalized DSC-MRI signals of normal rat. Corresponding nAUC ratio values were 1 and 0.971 for right and left hemispheres, respectively. (c) ΔR2* curve and AUC of SPION and Dotarem for unnormalized DSC-MRI signal of tMCAO rat. Corresponding AUC ratio values were 0.598 and 0.823 for contralateral and ipsilateral hemisphere, respectively. (d) ΔR2* curve and AUC of SPION and Dotarem for normalized DSC-MRI signal of tMCAO rat. Corresponding nAUC ratio values were 1 and 1.376 for right and left hemispheres, respectively. Black arrows in (c) represent the second peak from recirculation from SPION DSC-MRI times curves.
Fig 2
Fig 2. Results of in vivo experiment with normal rats (control experiments).
(a) and (b) show the normalized AUC from the first injection (nAUCDotarem) and the AUC from the second injection (AUCDotarem), respectively. (c) Scatter plot of nAUCDotarem and AUCDotarem in the left hemisphere (black dots). The red and blue lines are fitted lines to the right- and left-hemisphere scatter plots, respectively. (d) and (e) show the normalized AUC from the first Dotarem injection (nAUCDotarem) and the AUC from the second SPION injection (AUCSPION), respectively. (f) Scatter plot of nAUCDotarem and AUCSPION in the left hemisphere (black dots). The red and blue lines are the corresponding fitted lines to the right- and left-hemisphere scatter plots. (g) Statistical analysis of nAUC ratio. The statistical unit nsl is the number of slices. The green and yellow bar graphs show the nAUC ratio values in the Dotarem-Dotarem and Dotarem-SPION cases, respectively, in normal rats (green bar: 0.990 ± 0.023 [mean ± standard deviation, n = 3, with 9 slices], yellow bar: 1.002 ± 0.017 [n = 3 with 9 slices], p > 0.05 [p = 0.136]). a.u. means arbitrary unit.
Fig 3
Fig 3. Results of in vivo experiment on two stroke rats with local hypo- and hyper-perfusion.
(a.1, e.1) T2-weighted images, (a.2, e.2) ADC maps, and (a.3, e.3) T1 map difference between pre- and post-Dotarem injection. (b.1, f.1) and (b.2, f.2) show the rCBVSPION (AUCSPION) and rCBVDotarem (nAUCDotarem), respectively. (b.3, f.3) show the associated rCBVerror (nAUC ratio). (c.1, g.1) and (c.2, g.2) show the rCBFSPION and rCBFDotarem, respectively. (c.3, g.3) show the associated rCBFerror. (d.1, h.1) and (d.2, h.2) show the rMTTSPION and rMTTDotarem, respectively. (d.3, h.3) show the associated rMTTerror. (i) Respective scatter plots of rCBVSPION/rCBVDotarem, rCBFSPION/rCBFDotarem, and rMTTSPION/rMTTDotarem in the damaged BBB ipsi-lesional hemisphere of stroke (black dots). The red and blue lines are fitted lines for the contralateral hemisphere and the BBB-disrupted lesion, respectively. (j) Respective statistical analysis of corresponding perfusion parameters. The green and yellow bar graphs represent the values from the normal (n = 3 with 9 slices) and stroke groups (n = 4 with 12 slices), respectively. a.u. means arbitrary unit.
Fig 4
Fig 4
(a.1), (b.1), (c.1), (d.1), (e.1) show infarcted areas with BBB damage (ADC < 500 μm2/s and rCBVerror > threshold) in red and peri-infracted areas with BBB damage (ADC > 500 μm2/s and rCBVerror > threshold) in green. Infarcted area without BBB damage (ADC < 500 μm2/s and rCBVerror < threshold) is shown in yellow, but scarce. (a.2), (b.2), (c.2), (d.2), (e.2) show histograms of ADC values of corresponding infarcted (red), per-infarcted with BBB-damage (green), and normal (purple) areas. The normal region satisfies the condition of ADC > 500 μm2/s and rCBVerror < threshold. The overlapping ADC values between peri-infarcted (green) and normal (purple) areas are shown in dark blue. (a.3), (b.3), (c.3), (d.3), (e.3) show histograms of rCBVerror values corresponding to infarcted (red), per-infarcted with BBB damage (green), and normal (purple) areas. The overlapping rCBVerror values between infarcted (red) and peri-infarcted (green) areas are shown in dark orange.
Fig 5
Fig 5
(a.1) T2-weighted image. (a.2) ADC map. (a.3) T1 changes were shown for infarction (green) and normal (blue) region as a function of post-injection time, where injection time-points were marked with red lines. No significant T1 difference between infarction and normal region were observed from (a.4) T1 difference map (post-10 mins) after the injection of DOTAREM (0.1 mmol·kg-1). (a.5) Ktrans map. (a.6) Ve map. (a.7) Vp map.
Fig 6
Fig 6
(a.1-d.1) rCBV maps from SPION. (a.2-d.2) rCBV maps from DOTAREM (a.3-d.3) rCBVerror map. (a.4-d.4) Scatter plots of rCBVSPION/rCBVDOTAREM values in core region normalized to each normal area. (a.5-d.5) T1 difference maps (post 85 mins) with increasing CA pre-load. No T1 difference map was available for no CA pre-load case and not available.

References

    1. Garcia JH, Experimental ischemic stroke: A review. Stoke 1984;15: 5–14. - PubMed
    1. Hossmann K-A, Animal models of cerebral ischemia: I. Review of literature. Cerebrovascular Diseases. 1991;1: 2–15.
    1. Shen Q, Du F, Huang S, Duong TQ. Spatiotemporal characteristics of post-ischemic hyper-perfusion with respect to changes in T1, T2, diffusion, angiography, and blood–brain barrier permeability. Journal of Cerebral Blood Flow & Metabolism. 2011;31(10): 2076–2085. - PMC - PubMed
    1. Shen Q, Duong TQ. Magnetic resonance imaging of cerebral blood flow in animal stroke models. Brain Circulation. 2016;2(1): 20 10.4103/2394-8108.178544 - DOI - PMC - PubMed
    1. Calamante F, Thomas DL, Pell GS, Wiersma J, Turner R. Measuring cerebral blood flow using magnetic resonance imaging techniques. Journal of Cerebral Blood Flow & Metabolism. 1999;19(7): 701–735. - PubMed

Publication types