. 2018 Jul 24;24(4):791-800.
doi: 10.1016/j.celrep.2018.06.093.

The HAUS Complex Is a Key Regulator of Non-centrosomal Microtubule Organization during Neuronal Development

Affiliations

The HAUS Complex Is a Key Regulator of Non-centrosomal Microtubule Organization during Neuronal Development

Inês Cunha-Ferreira et al. Cell Rep. .

Abstract

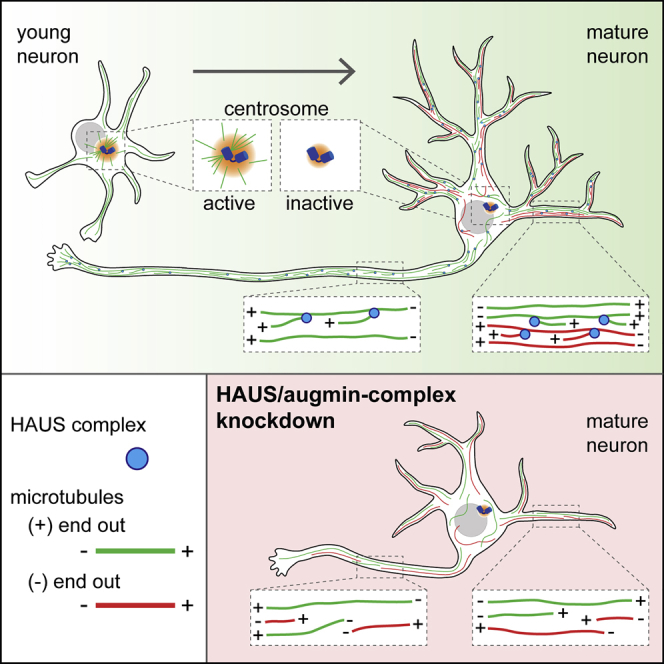
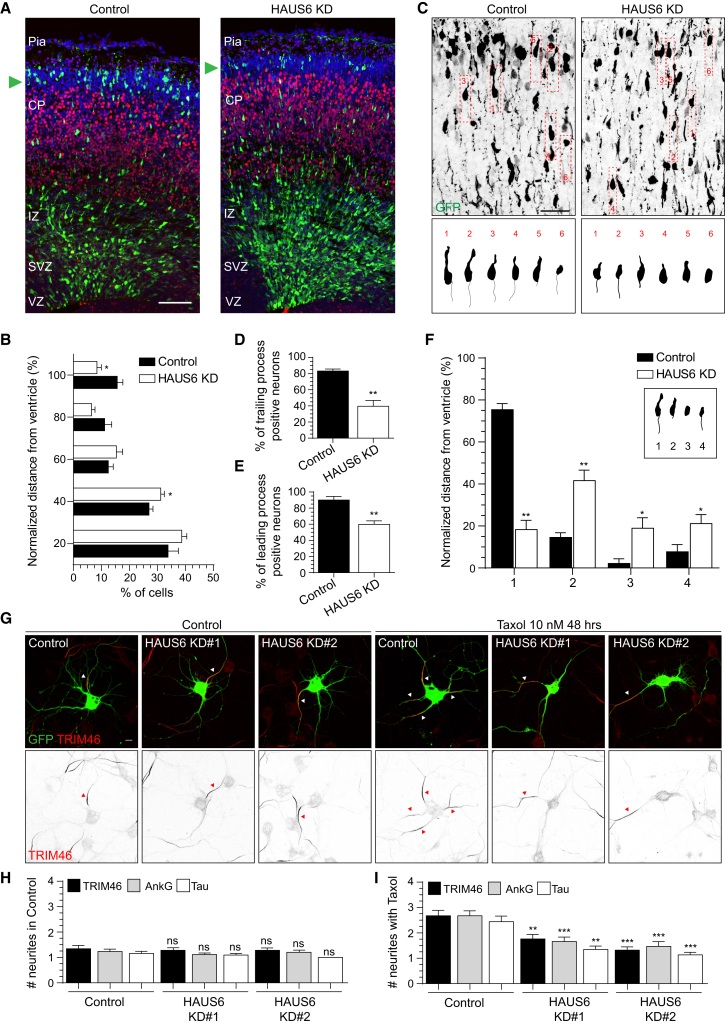
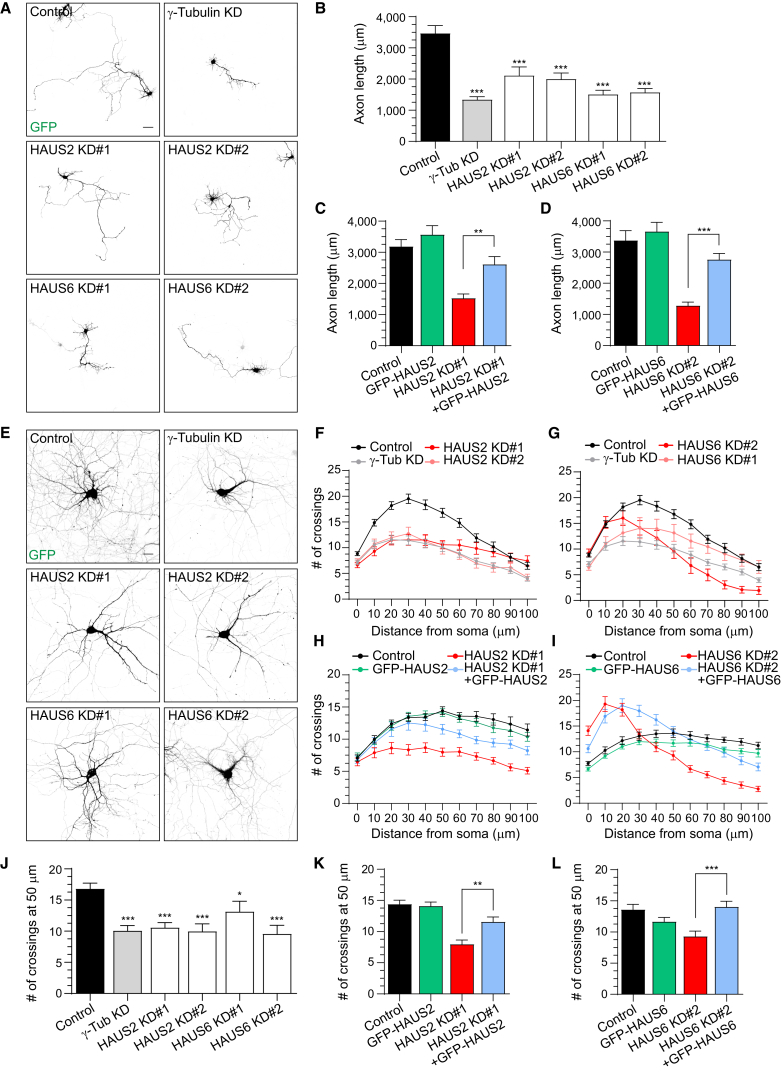
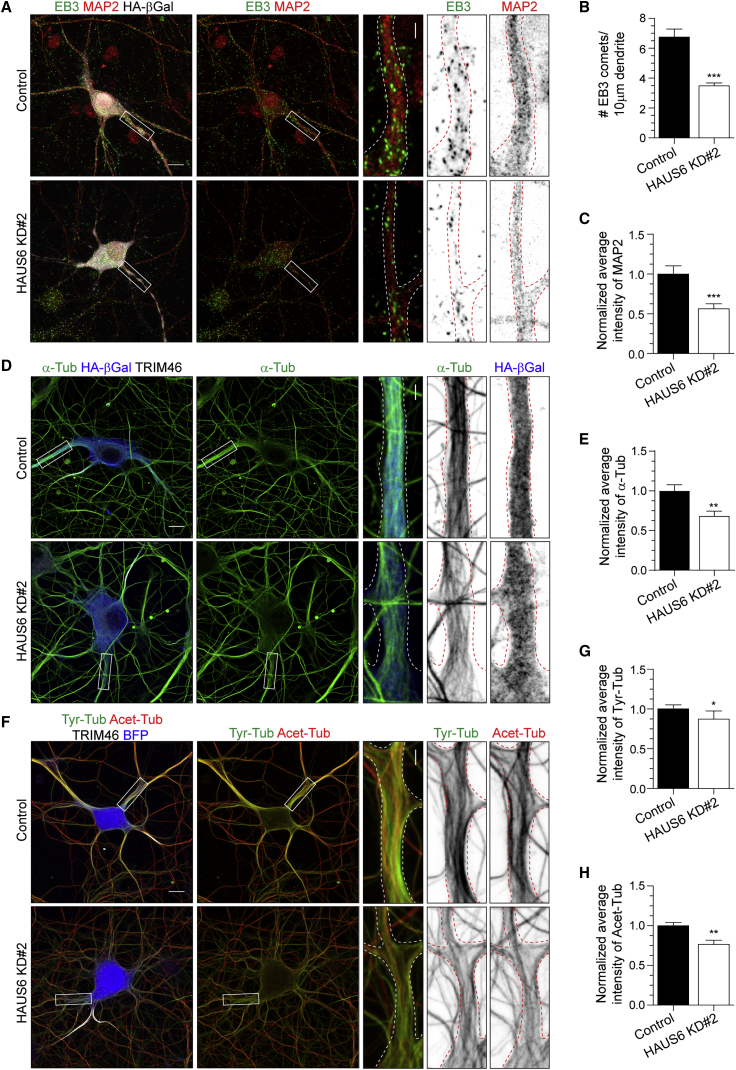
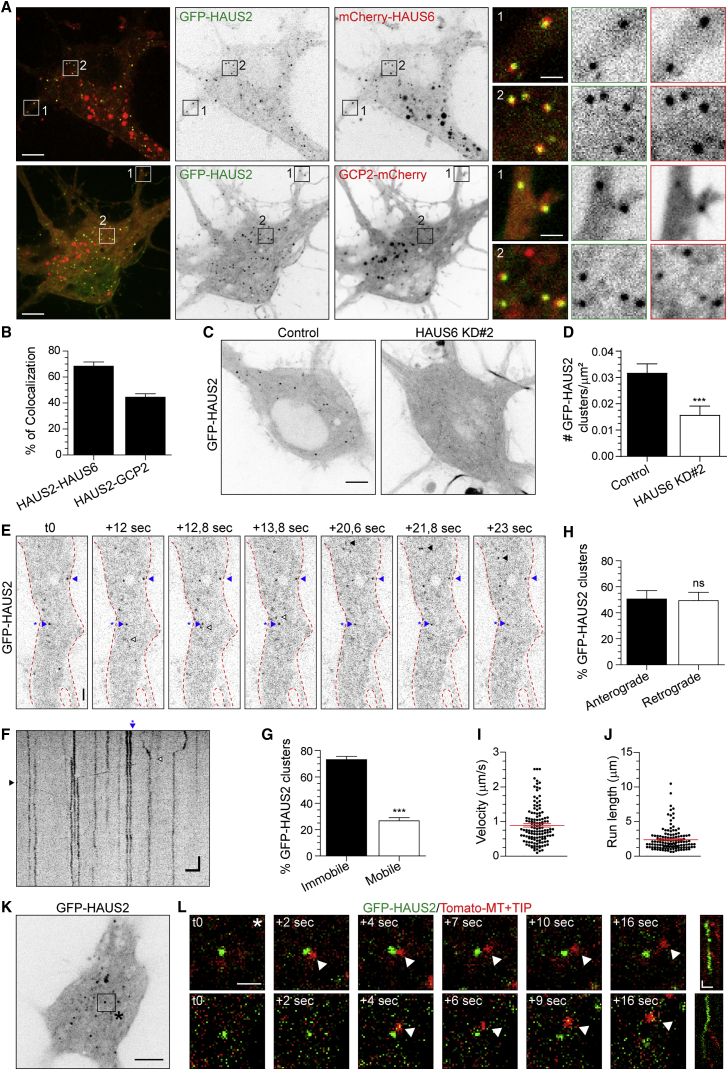
Neuron morphology and function are highly dependent on proper organization of the cytoskeleton. In neurons, the centrosome is inactivated early in development, and acentrosomal microtubules are generated by mechanisms that are poorly understood. Here, we show that neuronal migration, development, and polarization depend on the multi-subunit protein HAUS/augmin complex, previously described to be required for mitotic spindle assembly in dividing cells. The HAUS complex is essential for neuronal microtubule organization by ensuring uniform microtubule polarity in axons and regulation of microtubule density in dendrites. Using live-cell imaging and high-resolution microscopy, we found that distinct HAUS clusters are distributed throughout neurons and colocalize with γ-TuRC, suggesting local microtubule nucleation events. We propose that the HAUS complex locally regulates microtubule nucleation events to control proper neuronal development.

Keywords: actin; centrosome; development; microtubule; migration; neuron; nucleation.


Figures

None
Graphical abstract
Figure 1
Figure 1
The HAUS Complex Regulates Neuronal Migration and Polarization In Vivo (A) Low magnification stitched maximum-intensity projection and quantification of migrating neurons in E17.5 mouse cortex positively electroporated in utero at E14.5 with GFP and pSuper control or HAUS6 shRNAs. CP, cortical plate; IZ, intermediate zone; Pia, Pial surface; SVZ, sub-ventricular zone; VZ, ventricular zone. Green, GFP; red, Ctip2; blue, DAPI. GFP-positive neurons at the pial surface are indicated with a green arrowhead. (B) Normalized migration distribution along the radial axis from the ventricle to the pial surface of GFP-positive neurons (n = 15 or 16, N = 6). (C) High-magnification maximum-intensity projections of E17.5 mouse cortical neurons positively electroporated in utero at E14.5 with GFP and pSuper control or HAUS6 shRNAs. (D and E) Percentage of trailing (D) or leading process-positive (E) neurons in pSuper control and HAUS6 shRNAs electroporated brains (n = 51–92, N = 3). (F) Quantification of neuronal morphology in pSuper control and HAUS6 shRNAs electroporated brains (n = 51–92, N = 3). (G) DIV6 hippocampal neurons co-transfected with pSuper control, HAUS6 knockdown (KD) #1, 2 shRNAs and GFP at DIV2 and treated at DIV4 with control vehicle (DMSO) or Taxol. Green, GFP; red, TRIM46. TRIM46-positive processes are highlighted with a white arrowhead in merged images and red arrowhead in gray-scale inverted images. (H and I) Average number of processes positive for TRIM46, AnkG, and Tau in control (H) and Taxol treatment (I) (n = 18–34, N = 3 for TRIM46 and AnkG; N = 2 for Tau). Graphs represent the mean ± SEM. p < 0.05, ∗∗p < 0.01, ∗∗∗p < 0.001. Scale bars, 100 μm in (A), 40 μm in (C), and 10 μm in (G). See also Figure S1 and Table S1.
Figure 2
Figure 2
The HAUS Complex Regulates Axonal and Dendritic Development In Vitro (A) DIV5 hippocampal neurons co-transfected with GFP and pSuper control, HAUS2 KD#1, 2, HAUS6 KD#1, 2 or γ-tubulin shRNAs. (B) Axon arborization related to (A) (n = 18–20, N = 2). (C and D) Axon arborization of DIV5 neurons co-transfected with HA-β-galactosidase and pSuper control, HAUS2 KD#1 (C) or HAUS6 KD#2 (D) with GFP, GFP-HAUS2 or GFP HAUS6 shRNA resistant (n = 18–24 in C, n = 19–22 in D, N = 2). (E) DIV12 hippocampal neurons co-transfected with GFP and pSuper control, HAUS2 KD#1, 2, HAUS6 KD#1, 2 or γ-tubulin shRNAs. (F and G) Sholl analysis related to (E) (n = 20–46, N = 2; the control in F and G is the same because these are data from one common set of experiments). (H and I) Sholl analysis of DIV12 hippocampal neurons co-transfected with HA-β-galactosidase and pSuper control, HAUS2 KD#1 (H) or HAUS6 KD#2 (I) with GFP, GFP-HAUS2 or GFP HAUS6 shRNA resistant (n = 20, N = 2 in H; n = 30, N = 3 in I). (J) Average number of crossings at 50 μm distance from the cell body related to (F) and (G). (K and L) Average number of crossings at 50 μm distance from the cell body related to (H) and (I). Graphs represent the mean ± SEM. p < 0.05, ∗∗p < 0.01, ∗∗∗p < 0.001. Scale bars, 50 μm in (A) and 20 μm in (E). See also Figure S2 and Table S1.
Figure 3
Figure 3
The HAUS Complex Regulates MT Organization in Hippocampal Neurons (A) DIV12 hippocampal neurons co-transfected with HA-β-galactosidase and pSuper control or HAUS6 KD#2 shRNAs. Insets depict dendrite areas. Green, EB3; red, MAP2; and gray, HA-β-galactosidase. (B) Average number of EB3 comets per 10 μm proximal dendrite in DIV12 neurons related to (A) (n = 20, N = 2). (C) Normalized average intensity of MAP2 at 10 μm proximal dendrite in DIV12 neurons related to (A) (n = 20, N = 2). (D) DIV11 hippocampal neurons co-transfected with HA-β-galactosidase and pSuper control or HAUS6 KD#2 shRNAs. Insets depict dendrite areas. Green, α-tubulin; gray, TRIM46; and blue, HA-β-galactosidase. (E) Normalized average intensity of α-tubulin at 10 μm proximal dendrite in DIV11 neurons related to (D) (n = 17, N = 2). (F) DIV12 hippocampal neurons co-transfected with BFP and pSuper control or HAUS6 KD#2 shRNAs. Insets depict dendrite areas. Green, tyrosinated tubulin; red, acetylated tubulin; gray, TRIM46; blue, BFP. (G and H) Normalized average intensity of tyrosinated (G) and acetylated (H) tubulin at 10 μm proximal dendrites of DIV11–12 neurons related to (F) (n = 17–19, N = 2). Graphs represent the mean ± SEM. p < 0.05, ∗∗p < 0.01, ∗∗∗p < 0.001. Scale bars, 10 μm in panels and 2 μm in insets in (A), (D), and (F). See also Figure S2 and Table S1.
Figure 4
Figure 4
The HAUS Complex Colocalizes with the γ-Tubulin Complex at Acentrosomal Clusters in Hippocampal Neurons (A) Average intensity projections of stream acquisitions of DIV10 hippocampal neurons expressing GFP-HAUS2 (green) and mCherry-HAUS6 (top) or GCP2-mCherry (bottom) (red). Insets depict indicated areas. (B) Percentage of GFP-HAUS2 clusters colocalizing with mCherry-HAUS6 or GCP2-mCherry in DIV10–11 neurons (n = 28–51, N = 4). (C) Average intensity projection of stream acquisition of DIV12 hippocampal neurons co-transfected with GFP-HAUS2 and pSuper control or HAUS6 KD#2 shRNAs. (D) Density of GFP-HAUS2 clusters in DIV12–15 neurons (n = 43, N = 2). (E and F) Stills (E) and kymograph (F) of GFP-HAUS2 in a proximal dendrite of a DIV10 neuron from 1 min stream acquisition. Time is in seconds. Anterograde and retrograde GFP-HAUS2 events are indicated with black and white arrowheads, respectively, and stationary events with blue arrowhead. (G) Percentage of mobile and immobile GFP-HAUS2 clusters in DIV10–11 neurons (n = 24, N = 3). (H) Percentage of anterograde and retrograde GFP-HAUS2 clusters in DIV10–11 neurons (n = 22, N = 3). (I and J) Average velocity and run length of GFP-HAUS2 clusters in DIV10–11 neurons (n = 22, N = 3). (K and L) Average intensity projection, stills (K) and kymographs (L) of 10 min time-lapse acquisitions of DIV17 neurons co-transfected with GFP-HAUS2 (green) and Tomato-MT+TIP (red). Top insets in (L) depict the area indicated in (K); bottom insets are from another neuron. Graphs represent mean ± SEM. ∗∗∗p < 0.001. Scale bar, 5 μm in panels and 1 μm in insets in (A), 5 μm in (C), 2 μm in (E) and (F), 5 s in (F), 5 μm in (K), 1 μm in stills in (L), and 1 μm and 10 s in kymographs in (L). See also Figures S3 and S4 and Table S1.

References

    1. Akhmanova A., Hoogenraad C.C. Microtubule minus-end-targeting proteins. Curr. Biol. 2015;25:R162–R171. - PubMed
    1. Baas P.W., Karabay A., Qiang L. Microtubules cut and run. Trends Cell Biol. 2005;15:518–524. - PubMed
    1. Barnes A.P., Polleux F. Establishment of axon-dendrite polarity in developing neurons. Annu. Rev. Neurosci. 2009;32:347–381. - PMC - PubMed
    1. Conde C., Cáceres A. Microtubule assembly, organization and dynamics in axons and dendrites. Nat. Rev. Neurosci. 2009;10:319–332. - PubMed
    1. Goshima G., Wollman R., Goodwin S.S., Zhang N., Scholey J.M., Vale R.D., Stuurman N. Genes required for mitotic spindle assembly in Drosophila S2 cells. Science. 2007;316:417–421. - PMC - PubMed

Publication types

Substances

LinkOut - more resources