

Humeral Head Ossification Predicts Peak Height Velocity Timing and Percentage of Growth Remaining in Children
- PMID: 30045360
- PMCID: PMC6135469
- DOI: 10.1097/BPO.0000000000001232
Humeral Head Ossification Predicts Peak Height Velocity Timing and Percentage of Growth Remaining in Children
Abstract
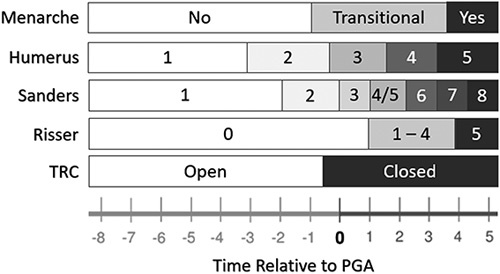
Background: Understanding skeletal maturity is important in the management of idiopathic scoliosis. Iliac apophysis, triradiate cartilage, hand, and calcaneal ossification patterns have previously been described to assess both peak height velocity (PHV) and percent growth remaining; however, these markers may not be present on standard spine radiographs. The purpose of this study was to describe a novel maturity assessment method based on proximal humeral epiphyseal ossification patterns.
Methods: Ninety-four children were followed at least annually throughout growth with serial radiographs and physical examinations. The PHV of each child was determined by measuring the change in height observed at each visit and adjusting for the interval between visits. Percent growth remaining was determined by comparing current to final standing height. The humeral head periphyseal ossification was grouped into stages by 8 investigators ranging from medical student to attending surgeon.
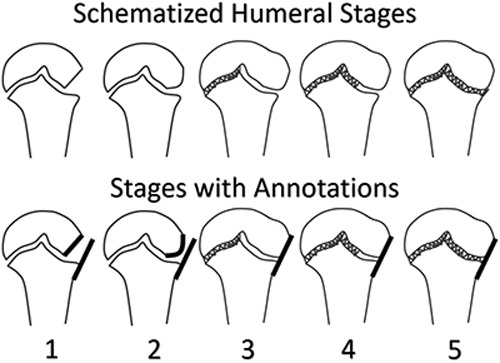
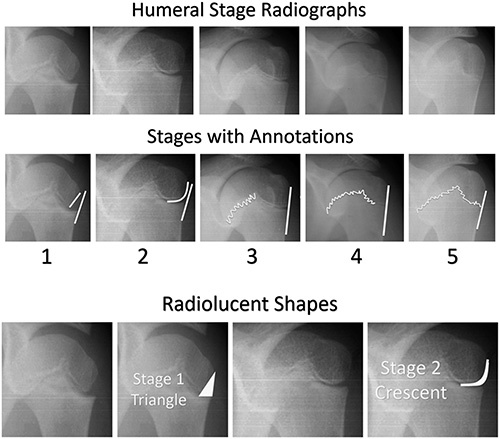
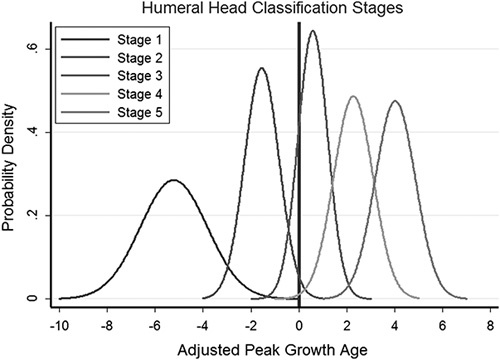
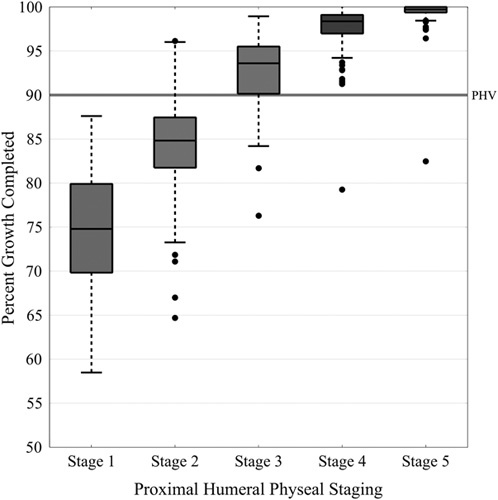
Results: The morphologic changes involving the proximal humeral physis were categorized into 5 stages based on development of the humeral head epiphysis and fusion of the lateral margin of the physis. Our novel classification scheme was well distributed around the PHV and reliably correlated with age of peak growth and percent growth remaining with >70% nonoverlapping interquartile ranges. Furthermore, the scheme was extremely reliable with intraclass correlation coefficients of 0.96 and 0.95 for intraobserver and interobserver comparisons, respectively.
Conclusions: The humeral head classification system described here was strongly correlated with age of PHV as well as percentage growth remaining. Furthermore, the staging system was extremely reliable in both interobserver and intraobserver correlations suggesting that it can be easily generalized.
Clinical relevance: As a view of the humeral head is almost always present on standard scoliosis spine x-ray at our institution, our classification can be easily adapted by surgeons to gain additional insight into skeletal maturity of patients with scoliosis. We believe that our method will significantly improve the evaluation of the child with scoliosis without increasing radiation exposure, time, or cost.
Conflict of interest statement
The authors declare no conflicts of interest.
Figures
Similar articles
-
The Proximal Humeral Ossification System Improves Assessment of Maturity in Patients with Scoliosis.J Bone Joint Surg Am. 2019 Oct 16;101(20):1868-1874. doi: 10.2106/JBJS.19.00296. J Bone Joint Surg Am. 2019. PMID: 31626012 Free PMC article.
-
Bone Age.2023 Jan 16. In: StatPearls [Internet]. Treasure Island (FL): StatPearls Publishing; 2025 Jan–. 2023 Jan 16. In: StatPearls [Internet]. Treasure Island (FL): StatPearls Publishing; 2025 Jan–. PMID: 30725736 Free Books & Documents.
-
Relationship of calcaneal and iliac apophyseal ossification to peak height velocity timing in children.J Bone Joint Surg Am. 2015 Jan 21;97(2):147-54. doi: 10.2106/JBJS.N.00671. J Bone Joint Surg Am. 2015. PMID: 25609442
-
Predicting Growth Quantitatively Through Proximal Tibia Radiograph Markers.J Pediatr Orthop. 2020 Oct;40(9):e889-e893. doi: 10.1097/BPO.0000000000001587. J Pediatr Orthop. 2020. PMID: 32404656
-
Approach to skeletal maturation.Hand Clin. 1991 Feb;7(1):53-62. Hand Clin. 1991. PMID: 2037639 Review.
Cited by
-
The Interrater and Intrarater Reliability of the Humeral Head Ossification System and the Proximal Femur Maturity Index Assessments for Patients with Adolescent Idiopathic Scoliosis.Front Pediatr. 2023 Mar 9;11:1131618. doi: 10.3389/fped.2023.1131618. eCollection 2023. Front Pediatr. 2023. PMID: 36969277 Free PMC article.
-
Texture Analysis for the Bone Age Assessment from MRI Images of Adolescent Wrists in Boys.J Clin Med. 2023 Apr 7;12(8):2762. doi: 10.3390/jcm12082762. J Clin Med. 2023. PMID: 37109098 Free PMC article.
-
An Examination of the Number of Adolescent Scoliotic Curves That Are Braceable at First Presentation to a Scoliosis Service.Healthcare (Basel). 2023 Feb 3;11(3):445. doi: 10.3390/healthcare11030445. Healthcare (Basel). 2023. PMID: 36767020 Free PMC article.
-
Substantial mismatch of skeletal maturity assessment between Risser sign and Simplified Skeletal Maturity Scale/Thumb Ossification Composite Index in patients with adolescent idiopathic scoliosis.Spine Deform. 2023 Jul;11(4):853-860. doi: 10.1007/s43390-023-00680-3. Epub 2023 Apr 1. Spine Deform. 2023. PMID: 37004693
-
Adolescent idiopathic scoliosis: is there a relationship between Risser staging and the proximal humerus ossification system?Spine Deform. 2024 May;12(3):629-633. doi: 10.1007/s43390-023-00812-9. Epub 2024 Feb 5. Spine Deform. 2024. PMID: 38316729
References
-
- Lonstein JE, Carlson JM. The prediction of curve progression in untreated idiopathic scoliosis during growth. J Bone Joint Surg Am. 1984;66:1061–1071. - PubMed
-
- Peterson LE, Nachemson AL. Prediction of progression of the curve in girls who have adolescent idiopathic scoliosis of moderate severity. Logistic regression analysis based on data from The Brace Study of the Scoliosis Research Society. J Bone Joint Surg Am. 1995;77:823–827. - PubMed
-
- Ylikoski M. Growth and progression of adolescent idiopathic scoliosis in girls. J Pediatr Orthop B. 2005;14:320–324. - PubMed
-
- Popejoy D, Emara K, Birch J. Prediction of contralateral slipped capital femoral epiphysis using the modified Oxford bone age score. J Pediatr Orthop. 2012;32:290–294. - PubMed
-
- Stasikelis PJ, Sullivan CM, Phillips WA, et al. Slipped capital femoral epiphysis. Prediction of contralateral involvement. J Bone Joint Surg Am. 1996;78:1149–1155. - PubMed
MeSH terms
LinkOut - more resources
Full Text Sources
Other Literature Sources
Research Materials
