. 2018 Jul 25;37(1):170.
doi: 10.1186/s13046-018-0843-y.

SWATH-MS based quantitative proteomics analysis reveals that curcumin alters the metabolic enzyme profile of CML cells by affecting the activity of miR-22/IPO7/HIF-1α axis

Affiliations

SWATH-MS based quantitative proteomics analysis reveals that curcumin alters the metabolic enzyme profile of CML cells by affecting the activity of miR-22/IPO7/HIF-1α axis

Francesca Monteleone et al. J Exp Clin Cancer Res. .

Abstract

Background: Chronic myelogenous leukemia (CML) is a myeloproliferative disorder caused by expression of the chimeric BCR-ABL tyrosine kinase oncogene, resulting from the t(9;22) chromosomal translocation. Imatinib (gleevec, STI-571) is a selective inhibitor of BCR-ABL activity highly effective in the treatment of CML. However, even though almost all CML patients respond to treatment with imatinib or third generation inhibitors, these drugs are not curative and need to be taken indefinitely or until patients become resistant. Therefore, to get a definitive eradication of leukemic cells, it is necessary to find novel therapeutic combinations, for achieving greater efficacy and fewer side effects. Curcumin is an Indian spice with several therapeutic properties: anti-oxidant, analgesic, anti-inflammatory, antiseptic and anti-cancer. In cancer disease, it acts by blocking cell transformation, proliferation, and invasion and by inducing cell apoptosis.

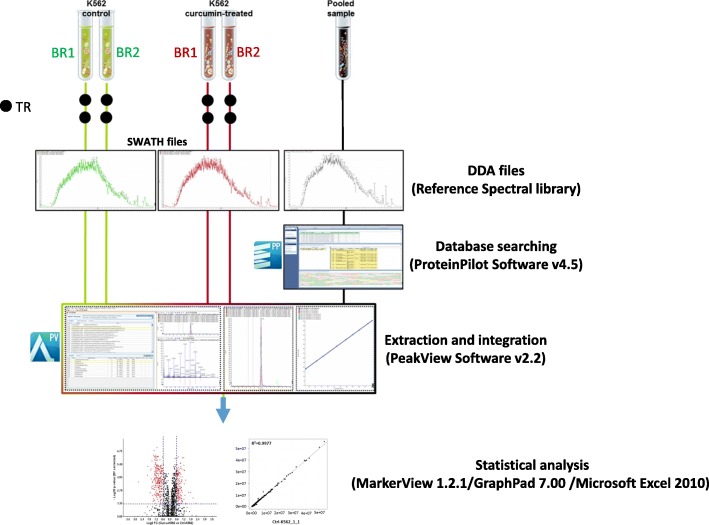
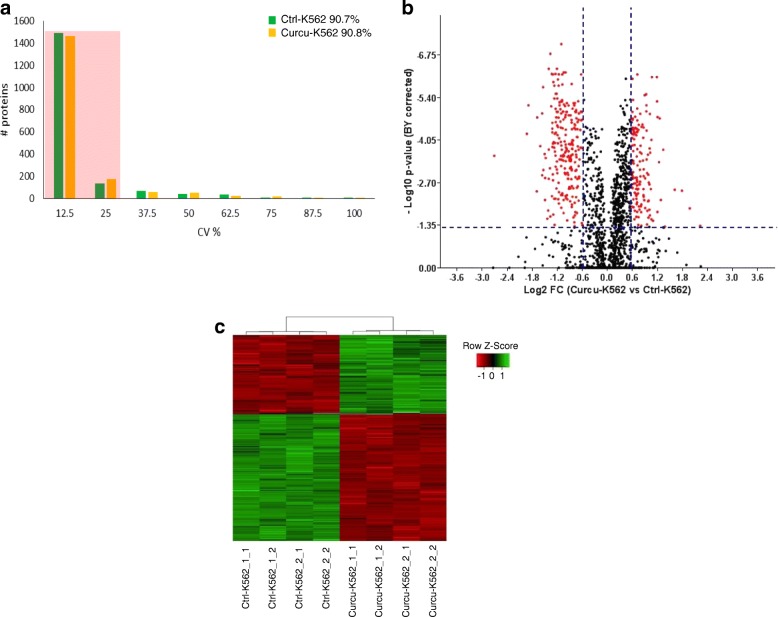
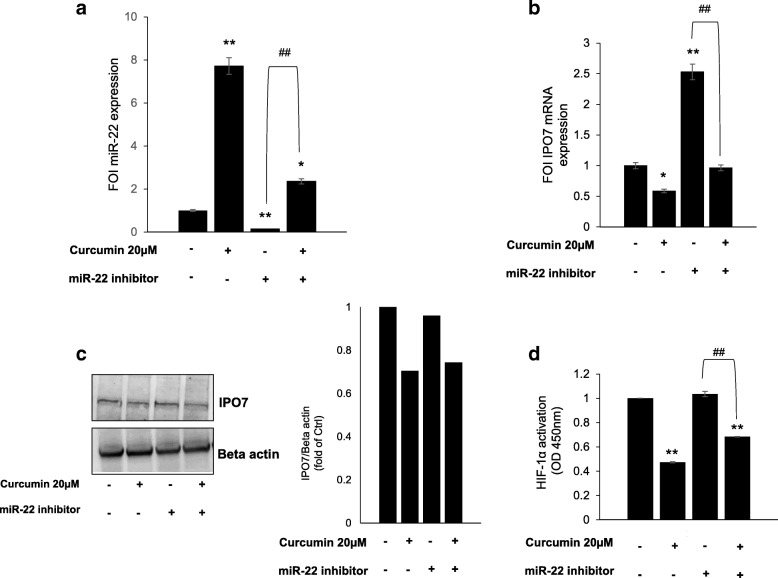
Methods: In the present study, the effect of a sub-toxic dose of curcumin on K562 cells was evaluated by using the technique of Sequential Window Activation of All Theoretical Mass Spectra (SWATH-MS). Bioinformatic analysis of proteomic data was performed to highlight the pathways mostly affected by the treatment. The involvement of Hypoxia inducible factor 1 α (HIF-1α) was assayed by evaluating its activation status and the modulation of importin 7 (IPO7) and miR-22 was assessed by quantitative PCR and western blot analysis. Finally, K562 cells transfected with miR-22 inhibitor were used to confirm the ability of curcumin to elicit miR-22 expression.

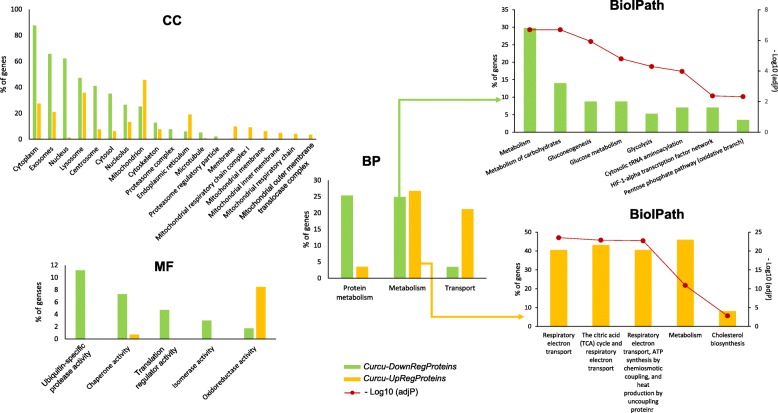
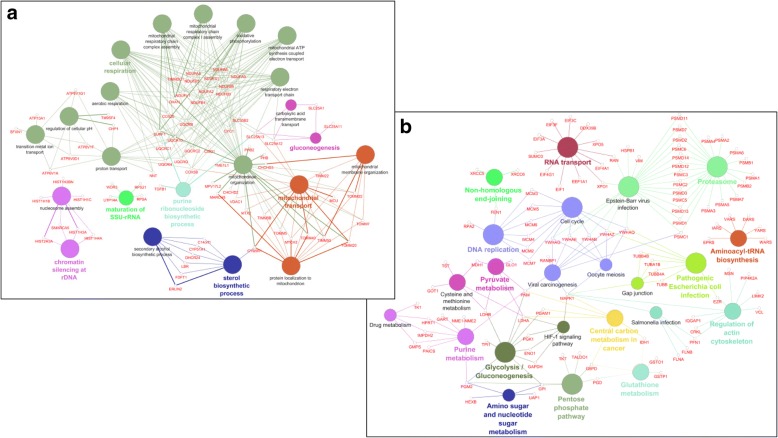
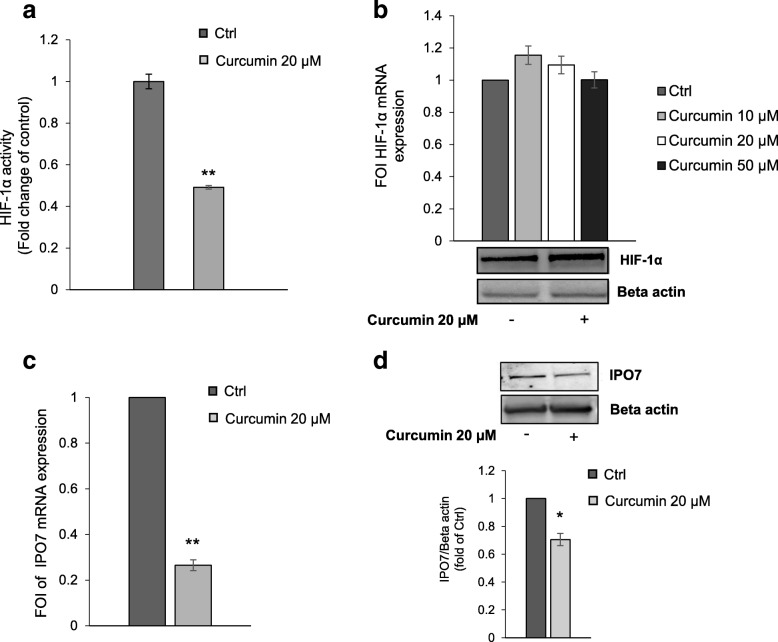
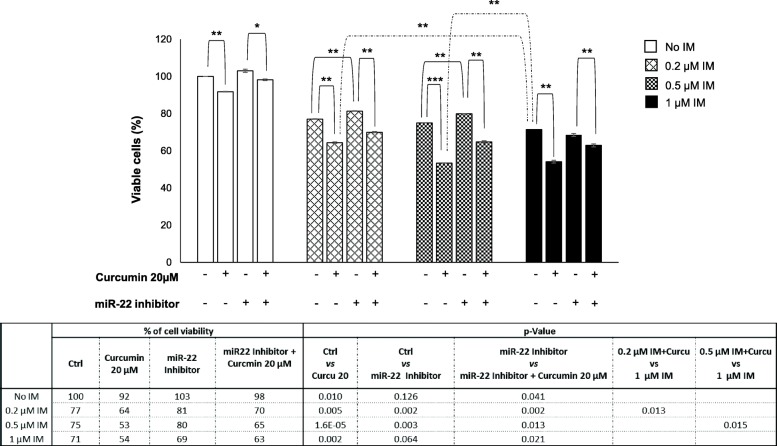
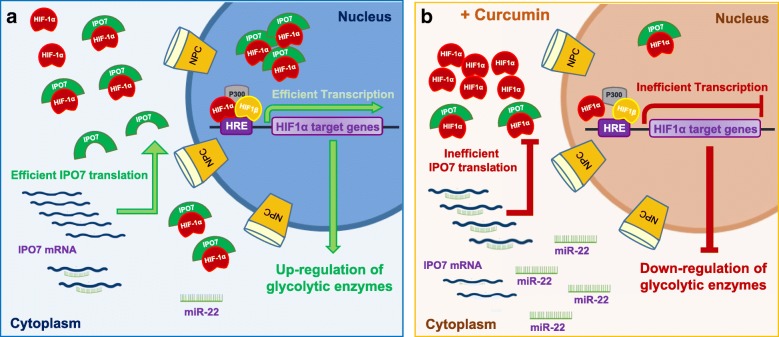
Results: Our findings revealed that the most relevant effect induced by curcumin was a consistent decrease of several proteins involved in glucose metabolism, most of which were HIF-1α targets, concomitant with the up-regulation of functional and structural mitochondrial proteins. The mechanism by which curcumin affects metabolic enzyme profile was associated with the reduction of HIF-1α activity, due to the miR-22-mediated down-regulation of IPO7 expression. Finally, the ability of curcumin to enhance in vitro the efficiency of imatinib was reported.

Conclusions: In summary, our data indicates that the miR-22/IPO7/HIF-1α axis may be considered as a novel molecular target of curcumin adding new insights to better define therapeutic activity and anticancer properties of this natural compound. The MS proteomic data have been deposited to the ProteomeXchange with identifier <PXD007771>.

Keywords: CML cells; Curcumin; SWATH-MS; miR-22/IPO7/HIF-1α axis.


Conflict of interest statement

Ethics approval and consent to participate

Not applicable.

Consent for publication

Not applicable.

Competing interests

The authors declare that they have no competing interests.

Publisher’s Note

Springer Nature remains neutral with regard to jurisdictional claims in published maps and institutional affiliations.

Figures

Fig. 1
Fig. 1
Experimental design and workflow for quantitative proteomics analysis of Ctrl-K562 and Curcu-K562 cells. The SWATH-MS analysis was performed using a Triple TOF 5600+ system equipped with a Nanospray III interface and coupled to an Eksigent nanoLC 425. For quantitative analysis, 1 μg of each sample was subjected to SWATH acquisition (34 swaths of 25 Da); two mass spectrometric technical replicates were acquired for each of the two biological replicates. To generate the spectral reference library, 2 μg of the pooled sample were subjected to traditional data-dependent acquisition (DDA). A library of 1967 proteins was created. After performing the extraction and integration processes using PeakView Software v2.2, 1796 proteins were exported into MarkerView 1.2.1 that together with GraphPad7.0 and Microsoft Excel 2010, was used for statistical analysis. BR: Biological Replicate; TR: Technical Replicate
Fig. 2
Fig. 2
Statistical analysis of SWATH data. a Histogram shows the distribution of coefficients of variation (CVs) among technical and biological replicates of Ctrl-K562 and Curcu-K562 cells. More than 90% of the proteins as highlighted by the shadow have CV ≤ 25%. b Volcano plot of 1796 quantified proteins illustrating expression increases and decreases following curcumin treatment. Red dots correspond to proteins showing a fold change (FC) ≥ ±1.5 in relative abundance and a corrected BY p-value < 0.05 (values indicated by vertical and horizontal dashed lines) and considered significantly differentially modulated in untreated and curcumin-treated K562 cells. c Heat map analysis of 377 modulated proteins among technical and biological replicates of Ctrl-K562 and Curcu-K562 cells. The value of the MS signal intensity is shown
Fig. 3
Fig. 3
GO and Biological Pathway enrichment analysis of Curcu-Down-Regulated and Curcu-Up-Regulated proteins by FunRich. The histograms show for each GO term, Cellular Component (CC), Biological Process (BP) and Molecular Function (MF), the most significantly enriched categories (adjP ≤10–5; see Table 2) in the differentially expressed proteins (down−/up-regulated in K562 cells treated with curcumin). Biological Pathaway histograms (BiolPath) specify the functional categories of metabolic protein group enriched in both protein datasets (BP hisograms). Extended data of GO enrichment analysis is provided in Additional file 3: Table S2 - Curcu-DownReg Proteins_FunRichGOterms and Additional file 6: Table S3 - Curcu-UpReg Proteins_FunRichGOterms
Fig. 4
Fig. 4
Enriched GO network groups using ClueGO/CluePedia-based enrichment. a Network view for KEGG pathway of CurcuUp-Regulated proteins and b Biological Process of CurcuDown-Regulated proteins. Terms (each represented as node) are functionally grouped based on shared genes (kappa score ≥ 0.4) and are shown with different colors. The specific players (proteins) of each node are highlighted with the respective gene name Node color represents the class that they belong. The size of the nodes indicates the degree of significance. Within each class, the most significant term (indicated with colored and bold characters) defines the name of the group. Ungrouped terms are not shown
Fig. 5
Fig. 5
Effects of Curcumin on HIF-1α activity and IPO7 expression. a Assay of the transcriptional activity of HIF-1α showing that in K526 cells curcumin induced a reduction of HIF-1α activity compared to control cells. The reported values are the mean of three independent experiments. b qPCR (upper panel) and representative Western blot (lower panel) show that curcumin treatment did not affect HIF-1α at both mRNA and protein level. The values (FOI: Fold of Induction) in the histogram are normalized against GAPDH and are the mean ± SD of three independent experiments. c qPCR demonstrates that in K562 cells curcumin induced a decrease of mRNA IPO7 expression. The values (FOI: Fold of Induction) in the histogram are normalized to GAPDH and are the mean ± SD of three independent experiments. d Representative western blot and corresponding densitogram showing that curcumin inhibited the protein expression of IPO7 in K562 cells. In the Western blot assay, actin was used as loading control. Intensities of proteins bands were calculated from the peak area of densitogram by using Image J software. Ctrl: control cells. Statistical significance was calculated vs Ctrl: *p < 0.05, **p < 0.01
Fig. 6
Fig. 6
Inhibition of IPO7 expression induced by curcumin is miR-22 mediated. a qRT-PCR showing the ability of curcumin to induce in K562 cells a significant increase of miR-22 expression. Ctrl: control. The values (FOI: Fold of Induction) in the histogram are normalized against RNU6–2 and are the mean ± SD of three independent experiments. b qPCR shows that in K562 cells the inhibitory effect on IPO7 mRNA expression induced by miR-22 inhibitor transfection was reverted by curcumin treatment. The values (FOI: Fold of Induction) in the histogram are normalized against GAPDH and are the mean ± SD of three independent experiments. c Representative western blot and corresponding densitogram showing that in K562 cells the inhibitory effect on IPO7 protein expression induced by miR-22 inhibitor transfection was reverted by curcumin treatment. Actin was used as loading control. Intensities of proteins bands were calculated from the peak area of densitogram by using Image J software. d Assay of the transcriptional activity of HIF-1α showing that in K562 cells transfected with miR-22 inhibitor HIF-1α activity was significantly decreased when cells were co-treated with curcumin. Ctrl: control cells. Statistical significance was calculated vs Ctrl (*p < 0.05, **p < 0.01) or as indicated by line (##p < 0.01)
Fig. 7
Fig. 7
Curcumin induces a miR-22-mediated enhancement of anti-proliferative effects of imatinib. Cell viability assay (MTT assay) of K562 cells treated as indicated for 24 h, shows that curcumin induced a miR-22-mediated sensitization to imatinib. The reported values are the mean of three independent experiments; statistical significance was calculated as specified by lines: *p < 0.05, **p < 0.01. The table reports in detail the values of the histogram. Ctrl: cells in DMSO or with increasing doses of only imatinib; IM: imatinib
Fig. 8
Fig. 8
The proposed model of miR-22/IPO7/HIF-1a axis modulation induced by curcumin in CML. a In basal condition CML cells are characterized by an efficient HIF-1α activity responsible of active transcription of several target genes some of which associated to glycolytic metabolism. b Curcumin by inducing up-regulation of miR-22 elicits the inhibition of IPO7 expression, hindering the HIF-1α translocation and causing the global down-regulation of glycolytic enzymes as highlighted by our quantitative proteomic data. NCP: Nuclear Pore Complex

References

    1. Deininger MW, Goldman JM, Melo JV. The molecular biology of chronic myeloid leukemia. Blood. 2000;96:3343–3356. - PubMed
    1. Hughes TP, Hochhaus A, Branford S, Muller MC, Kaeda JS, Foroni L, Druker BJ, Guilhot F, Larson RA, O'Brien SG, et al. Long-term prognostic significance of early molecular response to imatinib in newly diagnosed chronic myeloid leukemia: an analysis from the international randomized study of interferon and STI571 (IRIS) Blood. 2010;116:3758–3765. doi: 10.1182/blood-2010-03-273979. - DOI - PMC - PubMed
    1. Rousselot P, Huguet F, Rea D, Legros L, Cayuela JM, Maarek O, Blanchet O, Marit G, Gluckman E, Reiffers J, et al. Imatinib mesylate discontinuation in patients with chronic myelogenous leukemia in complete molecular remission for more than 2 years. Blood. 2007;109:58–60. doi: 10.1182/blood-2006-03-011239. - DOI - PubMed
    1. Ng KP, Manjeri A, Lee KL, Huang W, Tan SY, Chuah CT, Poellinger L, Ong ST. Physiologic hypoxia promotes maintenance of CML stem cells despite effective BCR-ABL1 inhibition. Blood. 2014;123:3316–3326. doi: 10.1182/blood-2013-07-511907. - DOI - PubMed
    1. Chen H, Shen Y, Gong F, Jiang Y, Zhang R. HIF-alpha promotes chronic myelogenous leukemia cell proliferation by upregulating p21 expression. Cell Biochem Biophys. 2015;72:179–183. doi: 10.1007/s12013-014-0434-2. - DOI - PubMed

MeSH terms