Comparative Study
. 2019 Jun;68(6):1014-1023.
doi: 10.1136/gutjnl-2017-315084. Epub 2018 Jul 25.

Gut microbiome analysis as a tool towards targeted non-invasive biomarkers for early hepatocellular carcinoma

Affiliations
Comparative Study

Gut microbiome analysis as a tool towards targeted non-invasive biomarkers for early hepatocellular carcinoma

Zhigang Ren et al. Gut. 2019 Jun.

Abstract

Objective: To characterise gut microbiome in patients with hepatocellular carcinoma (HCC) and evaluate the potential of microbiome as non-invasive biomarkers for HCC.

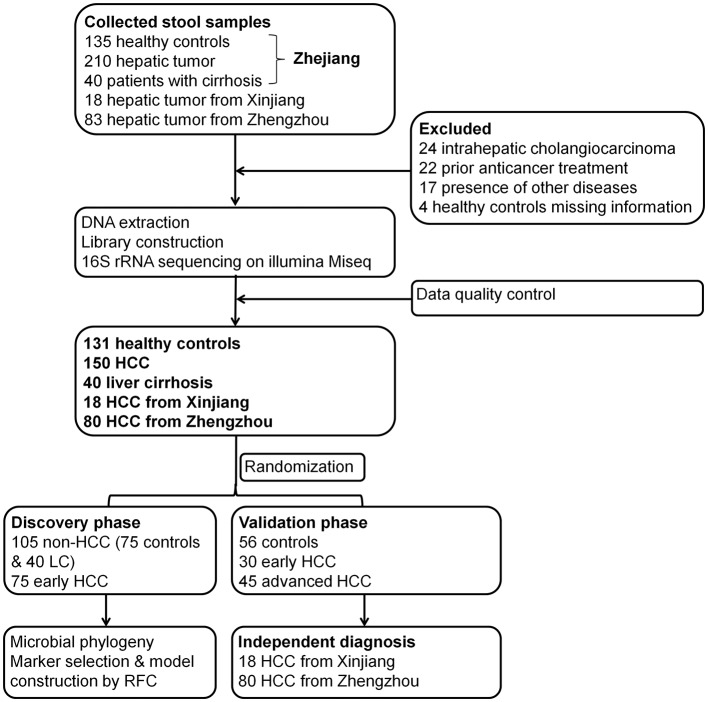
Design: We collected 486 faecal samples from East China, Central China and Northwest China prospectively and finally 419 samples completed Miseq sequencing. We characterised gut microbiome, identified microbial markers and constructed HCC classifier in 75 early HCC, 40 cirrhosis and 75 healthy controls. We validated the results in 56 controls, 30 early HCC and 45 advanced HCC. We further verified diagnosis potential in 18 HCC from Xinjiang and 80 HCC from Zhengzhou.

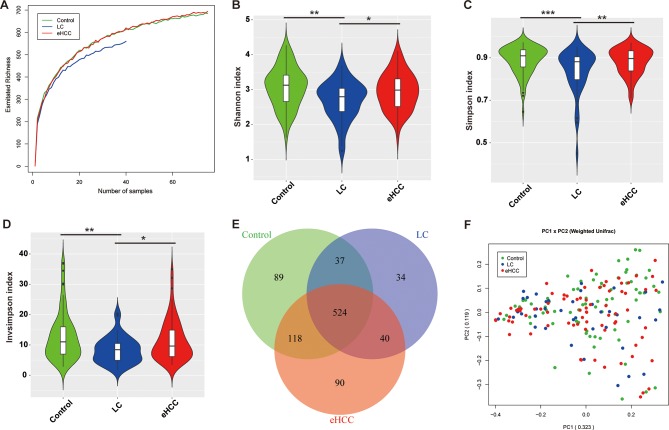
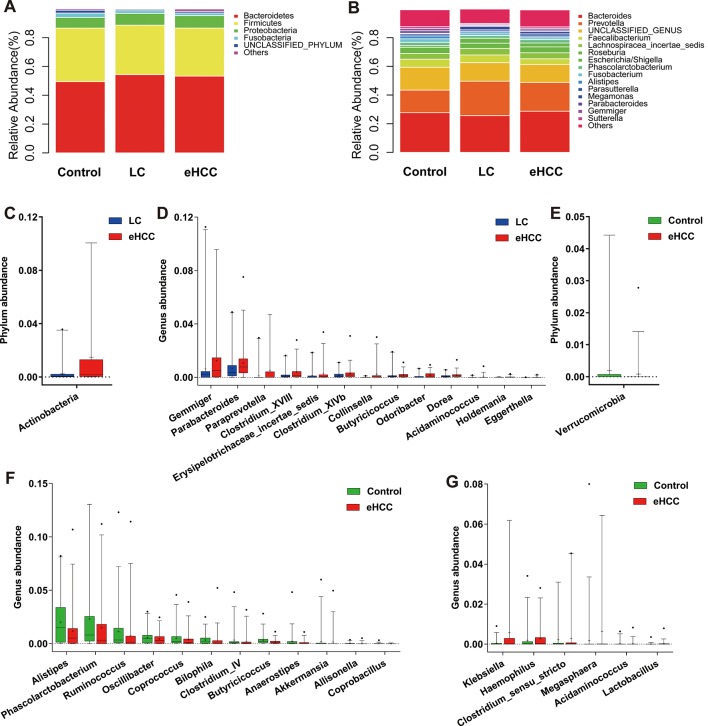
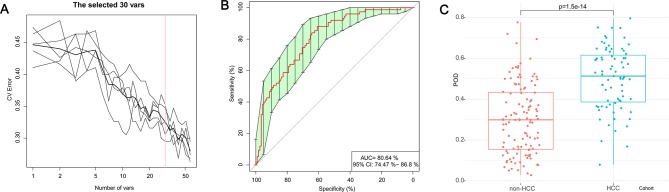
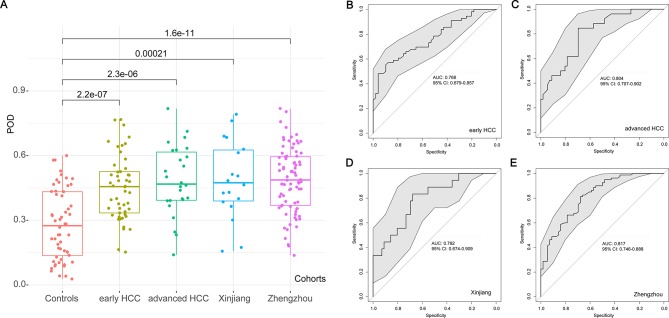
Results: Faecal microbial diversity was increased from cirrhosis to early HCC with cirrhosis. Phylum Actinobacteria was increased in early HCC versus cirrhosis. Correspondingly, 13 genera including Gemmiger and Parabacteroides were enriched in early HCC versus cirrhosis. Butyrate-producing genera were decreased, while genera producing-lipopolysaccharide were increased in early HCC versus controls. The optimal 30 microbial markers were identified through a fivefold cross-validation on a random forest model and achieved an area under the curve of 80.64% between 75 early HCC and 105 non-HCC samples. Notably, gut microbial markers validated strong diagnosis potential for early HCC and even advanced HCC. Importantly, microbial markers successfully achieved a cross-region validation of HCC from Northwest China and Central China.

Conclusions: This study is the first to characterise gut microbiome in patients with HCC and to report the successful diagnosis model establishment and cross-region validation of microbial markers for HCC. Gut microbiota-targeted biomarkers represent potential non-invasive tools for early diagnosis of HCC.

Keywords: early diagnosis; gut microbiota; hepatocellular carcinoma; liver cirrhosis.


Conflict of interest statement

Competing interests: None declared.

Figures

Figure 1
Figure 1
Study design and flow diagram. A total of 486 faecal samples from East China, Central China and Northwest China were prospectively collected. After a strict pathological diagnosis and exclusion process, 150 patients with HCC, 40 patients with cirrhosis and 131 healthy controls were included and randomly divided into the discovery phase and validation phase. In the discovery phase, we characterised gut microbiome among 75 early HCC with cirrhosis, 40 cirrhosis and 75 healthy controls and identified microbial markers and constructed HCC classifier by random forest model between the early HCC cohort and non-HCC cohort (cirrhosis and healthy controls). In validation phase, 56 controls, 30 early HCC and 45 advanced HCC were used to validate diagnosis efficacy of HCC classifier. Moreover, 18 patients with HCC from Xinjiang and 80 HCC from Zhengzhou served as independent diagnostic phase. HCC, hepatocellular carcinoma.
Figure 2
Figure 2
Increased faecal microbial diversity in patients with eHCC (n=75) versus patients with cirrhosis (n=40). (A) Shannon-Wiener curves between number of samples and estimated richness. The estimated OTUs richness basically approached saturation in all samples. Compared with the controls, faecal microbial diversity, as estimated by the Shannon index (B), Simpson index (C) and Invsimpson index (D), was significantly decreased in patients with liver cirrhosis (p=0.0011, 0.0007 and 0.0007, respectively). In contrast, microbial diversity was markedly increased in patients with eHCC versus patients with liver cirrhosis (p=0.0234, 0.0068 and 0.0068, respectively). (E) A Venn diagram displaying the overlaps between groups showed that 524 of the total richness of 932 OTUs were shared among the three groups, while 564 of 843 OTUs were shared between cirrhosis and eHCC. (F) Beta diversity was calculated using weighted UniFrac by PCoA, indicating a symmetrical distribution of faecal microbial community among all the samples. eHCC, early HCC; HCC, hepatocellular carcinoma; LC, liver cirrhosis; OTUs, Operational Taxonomy Units; PCoA, principal coordinates analysis.
Figure 3
Figure 3
Phylogenetic profiles of gut microbes among patients with eHCC with cirrhosis (n=75), patients with liver cirrhosis (n=40) and healthy controls (n=75). Composition of faecal microbiota at the phylum level (A) and genus level (B) among the three groups. The increased microbial community at the phylum level (C) and genus level (D) in eHCC with cirrhosis versus liver cirrhosis. The decreased microbial community at the phylum level (E) and genus level (F) in patients with eHCC with cirrhosis versus healthy controls. (G) The increased microbial community at the genus level in patients with eHCC with cirrhosis versus healthy controls. The box presented the 95% CIs; the line inside denotes the median, and the symbol ‘+’ denotes the mean value. eHCC, early HCC; HCC, hepatocellular carcinoma; LC, liver cirrhosis.
Figure 4
Figure 4
Identification of microbial OTUs-based markers of early HCC by random forest models. To detect unique OTUs markers of early HCC, we conducted a fivefold cross-validation on a random forest model between 75 early HCC and 105 non-HCC samples (40 cirrhosis and 75 controls) in the discovery set. (A) The 30 OTUs markers were selected as the optimal marker set by random forest models. (B) The POD index achieved an AUC value of 80.64% with 95% CI of 74.47% to 86.80% between early HCC and non-HCC cohorts in the discovery phase. (C) The POD value was significantly increased in the early HCC samples versus the non-HCC samples (p=1.5×10⁻¹⁴). AUC, area under the curve; CV Error, the cross-validation error; HCC, hepatocellular carcinoma; OTUs, Operational Taxonomy Units; POD, probability of disease.
Figure 5
Figure 5
Validation and independent diagnosis of microbial markers for HCC. (A) Each POD of each participant from the different cohorts was calculated and the average POD values were compared between the controls and the other HCC cohorts in the validation phase and the independent diagnosis phase. (B) The POD achieved an AUC value of 76.80% (95% CI 67.90% to 85.70%) between early HCC and controls in the validation phase. (C) The POD achieved an AUC value of 80.40% (95% CI 70.70% to 90.20%) between the advanced HCC and controls in the validation phase. (D) The POD achieved an AUC value of 79.20% (95% CI 67.40% to 90.90%) between the 18 HCC from Xinjiang and controls in the independent diagnosis phase. (E) The POD achieved an AUC value of 81.70% (95% CI 74.60% to 88.80%) between the 80 HCC from Zhengzhou and controls in the independent diagnosis phase. AUC, area under the curve; HCC, hepatocellular carcinoma; POD, probability of disease.

References

    1. El-Serag HB, Kanwal F. Epidemiology of hepatocellular carcinoma in the United States: where are we? Where do we go? Hepatology 2014;60:1767–75. 10.1002/hep.27222 - DOI - PMC - PubMed
    1. Yu LX, Schwabe RF. The gut microbiome and liver cancer: mechanisms and clinical translation. Nat Rev Gastroenterol Hepatol 2017;14 10.1038/nrgastro.2017.72 - DOI - PMC - PubMed
    1. Siegel RL, Miller KD, Jemal A. Cancer Statistics, 2017. CA Cancer J Clin 2017;67:7–30. 10.3322/caac.21387 - DOI - PubMed
    1. Chen W, Zheng R, Baade PD, et al. . Cancer statistics in China, 2015. CA Cancer J Clin 2016;66:115–32. 10.3322/caac.21338 - DOI - PubMed
    1. Ferlay J, Soerjomataram I, Dikshit R, et al. . Cancer incidence and mortality worldwide: sources, methods and major patterns in GLOBOCAN 2012. Int J Cancer 2015;136:E359–E386. 10.1002/ijc.29210 - DOI - PubMed

Publication types

MeSH terms

Substances