. 2018 Oct;24(10):1418-1425.
doi: 10.1261/rna.067686.118. Epub 2018 Jul 25.

"NAD-capQ" detection and quantitation of NAD caps

Affiliations

"NAD-capQ" detection and quantitation of NAD caps

Ewa Grudzien-Nogalska et al. RNA. 2018 Oct.

Abstract

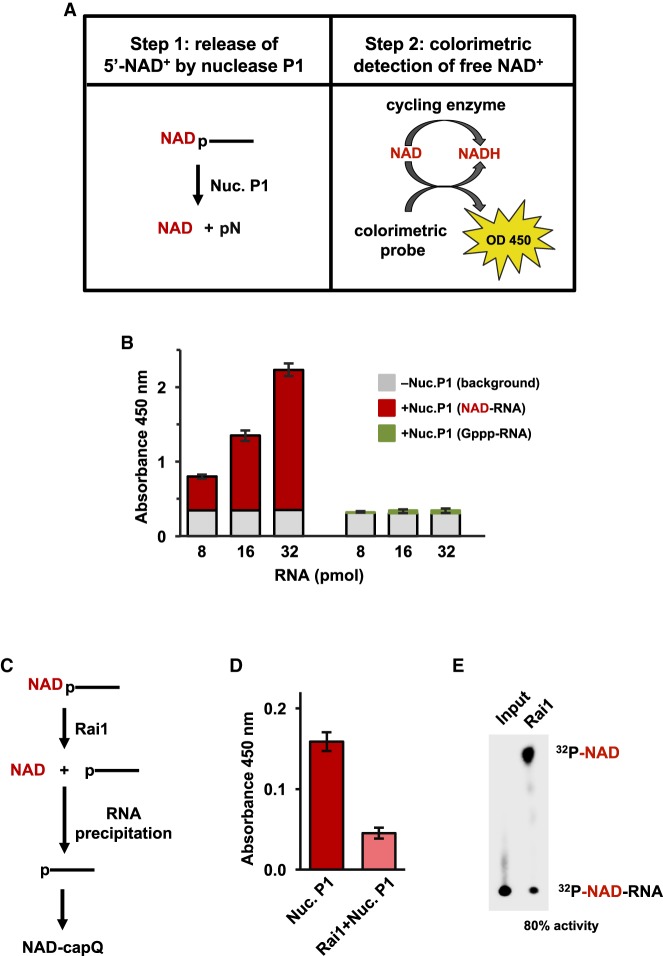
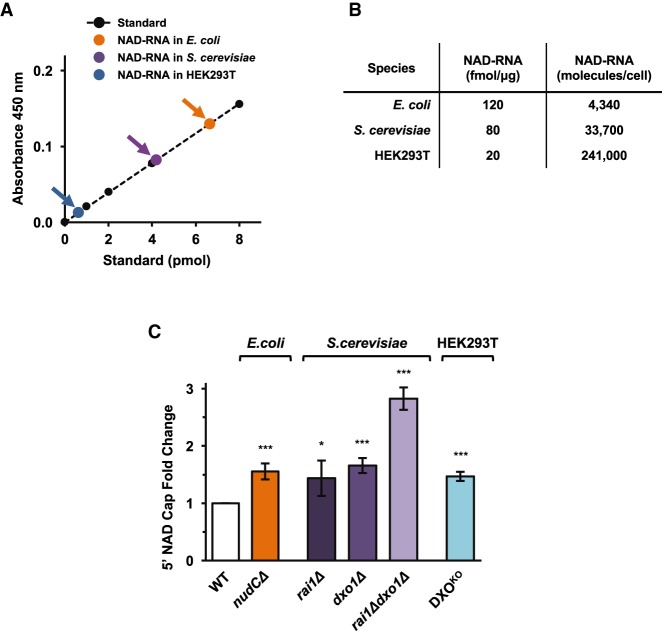
RNA 5' cap structures comprising the metabolic effector nicotinamide adenine dinucleotide (NAD) have been identified in diverse organisms. Here we report a simple, two-step procedure to detect and quantitate NAD-capped RNA, termed "NAD-capQ." By use of NAD-capQ we quantitate NAD-capped RNA levels in Escherichia coli, Saccharomyces cerevisiae, and human cells, and we measure increases in NAD-capped RNA levels in cells from all three organisms harboring disruptions in their respective "deNADding" enzymes. We further show that NAD-capped RNA levels in human cells respond to changes in cellular NAD concentrations, indicating that NAD capping provides a mechanism for human cells to directly sense and respond to alterations in NAD metabolism. Our findings establish NAD-capQ as a versatile, rapid, and accessible methodology to detect and quantitate 5'-NAD caps on endogenous RNA in any organism.

Keywords: NAD cap; NAD-capQ; mRNA deNADding; mRNA decapping.


Figures

FIGURE 1.
FIGURE 1.
NAD-cap detection and quantitation assay. (A) Steps in NAD-capQ. (B) NAD-capQ analysis of RNA generated in vitro. (Red) NAD-RNA; (green) Gppp-RNA; (gray) background signal detected without nuclease P1. Error bars represent ±SD, n ≥ 3. (C) Schematic of 5′-NAD cap removal from NAD-capped RNA using pretreatment with Rai1. (D) NAD-capQ analysis with or without pretreatment of NAD-RNA with Rai1. (Dark red) Background corrected absorbance without Rai1; (light red) background corrected absorbance with Rai1. Significance as in B. (E) Thin-layer chromatography analysis revealing 80% efficiency of Rai1 hydrolysis of 32P-5′ end labeled NAD-capped RNA spiked into 50 µg total RNA.
FIGURE 2.
FIGURE 2.
NAD-capQ detection and quantitation of RNA generated in vivo. (A) Quantitation of cellular NAD-capped RNA levels in E. coli, S. cerevisiae, or human HEK293T cells plotted on an NADH standard curve (orange data-point, E. coli; purple data-point, S. cerevisiae; blue data-point, human HEK293T; black data-points, NADH standard). n ≥ 3. (B) Values of NAD-RNA fmol/µg were calculated by dividing the calculated value of NAD-capped RNA detected by NAD-capQ in A by the amount of total cellular RNA analyzed. Quantitative values of NAD-capped RNA represented as RNA molecules/cell were calculated using total RNA concentrations per cell in E. coli (0.06 pg; Neidhardt et al. 1990), S. cerevisiae (0.7 pg; von der Haar 2008), and mammals (20 pg; Palazzo and Lee 2015), respectively. (C) Effects of disrupting deNADding enzymes on NAD-capped RNA levels in E. coli, S. cerevisiae, and human HEK293T cells. Graphs plot the fold-change in NAD-capped RNA values in the indicated mutant cells relative to the value observed in wild-type cells. (Error bars represent ±SD, n ≥ 3; [*] P < 0.05; [***] P < 0.001).
FIGURE 3.
FIGURE 3.
Cellular NAD concentrations can influence NAD cap levels. (A) The synthesis of NAD from NAM or NR. NAM is converted to NMN by the rate-limiting NAMPT, using PRPP as a cosubstrate. NMN is also the product of NR phosphorylation by NR kinases. NMN is converted to NAD by the NMNAT enzyme. FK866 is a small molecule inhibitor of NAMPT. (NAMPT) Nicotinamide phosphoribosyltransferase; (NMNAT) NMN adenylyltransferase; (NRK) NR kinase; (PRPP) phosphoribosyl pyrophosphate. (B) Quantitation of cellular total NAD following 48 h treatment with 5 nM FK866 or 5 mM NAM to decrease and increase cellular NAD levels, respectively. (C) Quantification of NAD-caps, detected with NAD-CapQ following 48 h treatment with 5 nM FK866 or 5 mM NAM. Mean values are plotted. Error bars represent ±SD. Statistical significance was calculated by one-way ANOVA with a Dunnett's multiple comparison post-test. P-values are denoted by asterisks. (*) P < 0.05; (**) P < 0.01; (***) P < 0.001.

References

    1. Bird JG, Zhang Y, Tian Y, Panova N, Barvik I, Greene L, Liu M, Buckley B, Krásný L, Lee JK, et al. 2016. The mechanism of RNA 5′ capping with NAD+, NADH and desphospho-CoA. Nature 535: 444–447. - PMC - PubMed
    1. Cahová H, Winz ML, Höfer K, Nübel G, Jäschke A. 2015. NAD captureSeq indicates NAD as a bacterial cap for a subset of regulatory RNAs. Nature 519: 374–377. - PubMed
    1. Cantó C, Gerhart-Hines Z, Feige JN, Lagouge M, Noriega L, Milne JC, Elliott PJ, Puigserver P, Auwerx J. 2009. AMPK regulates energy expenditure by modulating NAD+ metabolism and SIRT1 activity. Nature 458: 1056–1060. - PMC - PubMed
    1. Cantó C, Jiang LQ, Deshmukh AS, Mataki C, Coste A, Lagouge M, Zierath JR, Auwerx J. 2010. Interdependence of AMPK and SIRT1 for metabolic adaptation to fasting and exercise in skeletal muscle. Cell Metab 11: 213–219. - PMC - PubMed
    1. Cantó C, Menzies KJ, Auwerx J. 2015. NAD+ metabolism and the control of energy homeostasis: a balancing act between mitochondria and the nucleus. Cell Metab 22: 31–53. - PMC - PubMed

Publication types

LinkOut - more resources