. 2018 Jul 25;10(451):eaar5429.
doi: 10.1126/scitranslmed.aar5429.

LRRK2 activation in idiopathic Parkinson's disease

Affiliations

LRRK2 activation in idiopathic Parkinson's disease

Roberto Di Maio et al. Sci Transl Med. .

Abstract

Missense mutations in leucine-rich repeat kinase 2 (LRRK2) cause familial Parkinson's disease (PD). However, a potential role of wild-type LRRK2 in idiopathic PD (iPD) remains unclear. Here, we developed proximity ligation assays to assess Ser1292 phosphorylation of LRRK2 and, separately, the dissociation of 14-3-3 proteins from LRRK2. Using these proximity ligation assays, we show that wild-type LRRK2 kinase activity was selectively enhanced in substantia nigra dopamine neurons in postmortem brain tissue from patients with iPD and in two different rat models of the disease. We show that this occurred through an oxidative mechanism, resulting in phosphorylation of the LRRK2 substrate Rab10 and other downstream consequences including abnormalities in mitochondrial protein import and lysosomal function. Our study suggests that, independent of mutations, wild-type LRRK2 plays a role in iPD. LRRK2 kinase inhibitors may therefore be useful for treating patients with iPD who do not carry LRRK2 mutations.


Conflict of interest statement

Competing interests: Greenamyre briefly held an advisory position at Pfizer. Otherwise, the authors declare that they have no competing financial interests.

Figures
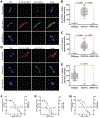
Figure 1.
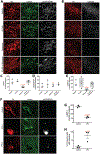
Figure 1.
Validation of assays using CRISPR/Cas9 gene-edited cells and selective LRRK2 kinase inhibitors. (A) PL assay showing LRRK2 kinase activation by means of phosphorylation of the autophosphorylation site, Ser1292 (red signal) and immunofluorescence of phosphorylation of the LRRK2 substrate Rab10 (green signal). In WT HEK cells (top row), there was little PL signal or pThr73-Rab10 immunofluorescence. In HEKG2019S/G2019S cells (2nd row) with elevated LRRK2 kinase activity, there was a bright pS1292 PL signal and strong pThr73-Rab immunofluorescence. In LRRK2 knockout HEK cells (bottom row) there was no pS1292 PL signal and very little pThr73-Rab signal. (B) Quantification of the pS1292 PL signal in WT, G2019S and knockout cells. Results reflect 3 independent experiments. Each symbol represents signal from a single cell. Statistical testing by ANOVA with post hoc Bonferroni correction. (C) Quantification of the pThr73-Rab10 signal in WT, G2019S and knockout cells. Results reflect 3 independent experiments. Each symbol represents signal from a single cell. Statistical testing by ANOVA with post hoc Bonferroni correction. (D) PL assay of 14-3-3 binding to LRRK2 and immunofluorescence of Rab10 phosphorylation at Thr73. In WT cells, there was a strong 14-3-3-LRRK2 PL signal (red) and little pThr73-Rab10 immunofluorescence (green). In HEKG2019S/G2019S cells, there was loss of 14-3-3 binding and a marked increase in pThr73-Rab10 signal. In LRRK2 knockout cells there was no 14-3-3-LRRK2 signal and little pThr73-Rab10 signal. (E) Quantification of the 14-3-3-LRRK2 PL signal in WT, G2019S and knockout cells. Results reflect 3 independent experiments. Each symbol represents signal from a single cell. Statistical testing by ANOVA with post hoc Bonferroni correction. (F) Dose-response curves of the LRRK2 kinase inhibitor GNE-7915 against the pS1292 PL signal (filled circles) and the pThr73-Rab10 signal (open circles) in HEKG2019S/G2019S cells. Cells were cultured for 24 hours with various inhibitor concentrations. Results from 3 independent experiments. Symbols show mean ± SEM. IC50 values calculated by GraphPad Prism software. (G) Dose-response curves of the LRRK2 kinase inhibitor MLi-2 against the pS1292 PL signal (filled circles) and the pThr73-Rab10 signal (open circles) in HEKG2019S/G2019S cells. Cells were cultured for 24 hours with various inhibitor concentrations. (H) Dose-response curves of the LRRK2 kinase inhibitor GNE-7915 against the pS1292 PL signal (filled circles) and the pThr73-Rab10 signal (open circles) in LCLs derived from an individual carrying the G2019S mutation. Cells were cultured for 24 hours with various inhibitor concentrations.
Figure 2.
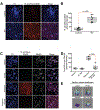
Figure 2.
Activation of LRRK2 kinase activity in nigrostriatal neurons in iPD. (A) pS1292 PL (red) and pThr73-Rab10 (gray) immunofluorescence signals in sections of substantia nigra from a control brain (top row) and a brain from an individual with iPD (bottom row). In the control brain, there was little pS1292 or pThr73-Rab10 signal, but in the iPD brain there were strong signals for both. (B) Quantification of pS1292 PL signal in 8 control brains and 7 iPD brains. Statistical comparison by unpaired 2-tail t-test. (C) Quantification of pThr73-Rab10 signal in 8 control brains and 7 iPD brains. Statistical comparison by unpaired 2-tail t-test. (D) 14-3-3-LRRK2 PL (red) and pThr73-Rab10 (gray) immunofluorescence signals in sections of substantia nigra from a control brain (top row) and a brain from an individual with iPD (bottom row). In the control brain, there was strong 14-3-3-LRRK2 PL signal and little pThr73-Rab10 signal, but in the iPD brain the opposite pattern was seen. (E) Quantification of 14-3-3-LRRK2 PL signal in 8 control brains and 7 iPD brains. Statistical comparison by unpaired 2-tail t-test.
Figure 3.
Figure 3.
Nigrostriatal LRRK2 activation is reproduced in 2 rat models of PD. (A) pS1292 PL and 14-3-3-LRRK2 PL signals in substantia nigra of control and rotenone treated rats. In the rotenone rats, there was increased pS1292 PL and loss of 14-3-3-LRRK2 PL signal indicating LRRK2 activation. (B) Quantification of pS1292 PL signal in nigrostriatal dopamine neurons from control and rotenone treated rats. Symbols represent individual animals. Statistical comparison by unpaired 2-tail t-test. (C) Quantification of 14-3-3-LRRK2 PL signal in nigrostriatal dopamine neurons from control and rotenone treated rats. Symbols represent individual animals. Statistical comparison by unpaired 2-tail t-test. (D) pS1292 PL and 14-3-3-LRRK2 PL signals in substantia nigra of rats that received a unilateral injection of AAV2-hSNCA. In the hemisphere overexpressing α-synuclein, there was increased pS1292 PL and loss of 14-3-3-LRRK2 PL signal indicating LRRK2 activation in nigrostriatal neurons. (E) Quantification of pS1292 PL signal in nigrostriatal dopamine neurons from the control and AAV-hSNCA injected hemispheres. Symbols represent mean values from each hemisphere. Statistical comparison by paired 2-tail t-test. (F) Quantification of 14-3-3-LRRK2 PL signal in nigrostriatal dopamine neurons from the control and AAV-hSNCA injected hemispheres. Symbols represent mean values from each hemisphere. Statistical comparison by paired 2-tail t-test.
Figure 4.
Figure 4.
LRRK2 is activated by reactive oxygen species. (A) pS1292 PL signal is increased dose-dependently by H2O2 (blue symbols), and the H2O2-induced increase is blocked by the antioxidant α-tocopherol (5 μM) (red symbols). Results represent 3 independent experiments. Symbols represent measurements from individual cells. Red asterisks = p<0.0001 vs no H2O2, ANOVA with Bonferroni correction; blue asterisks = p<0.0001 vs H2O2 alone at the same concentration. (B) pThr73-Rab10 signal is increased dose-dependently by H2O2 (blue symbols), and the H2O2-induced increase is blocked by the antioxidant α-tocopherol (5 μM) (red symbols). Results represent 3 independent experiments. Symbols represent measurements from individual cells. Red asterisks = p<0.0001 vs no H2O2, ANOVA with Bonferroni correction; blue asterisks = p<0.0001 vs H2O2 alone at the same concentration. ns = not significant. (C) In WT HEK cells rotenone treatment activates pS1292 signal and pThr73-Rab10 immunoreactivity. Both effects are blocked by the specific NOX2 inhibitor Nox2ds-tat. (D) Quantification of the pS1292 PL signal in vehicle- and rotenone-treated cells. Results represent 3 independent experiments. Symbols represent measurements from individual cells. Comparison by ANOVA with Bonferroni correction. (E) Quantification of the pThr73-Rab10 immunofluorescent signal in vehicle- and rotenone-treated cells. Results represent 3 independent experiments. Symbols represent measurements from individual cells. Comparison by ANOVA with Bonferroni correction.
Figure 5.
Figure 5.
Nigrostriatal LRRK2 activation and pSer129-α-synuclein accumulation can be blocked in vivo by a brain penetrant LRRK2 kinase inhibitor. (A) pS1292 PL and pThr73-Rab10 signals in rats treated with vehicle, PF-360 alone, rotenone alone and rotenone + PF-360. (B) Quantification of pS1292 PL signal in rats treated with vehicle, PF-360 alone, rotenone alone and rotenone + PF-360. Symbols represent individual rats. Comparison by ANOVA with Bonferroni correction. (C) Quantification of pThr73-Rab10 signal in rats treated with vehicle, PF-360 alone, rotenone alone and rotenone + PF-360. Symbols represent individual rats. Comparison by ANOVA with Bonferroni correction. (D) pSer129-α-Synuclein immunoreactivity in rats treated with vehicle, PF-360 alone, rotenone alone and rotenone + PF-360. (E) Quantification of pSer129-α-synuclein signal in rats treated with vehicle, PF-360 alone, rotenone alone and rotenone + PF-360. Symbols represent individual rats. Comparison by ANOVA with Bonferroni correction.
Figure 6.
Figure 6.
Rotenone induces in vivo nigrostriatal lysosomal and CMA defects that are prevented by co-treatment with a LRRK2 kinase inhibitor. (A) Nigrostriatal Lamp1 and p62/SQSTM1 immunoreactivity in rats treated with vehicle, PF-360 alone, rotenone alone and rotenone + PF-360. (B) Nigrostriatal Lamp2A immunoreactivity in rats treated with vehicle, PF-360 alone, rotenone alone and rotenone + PF-360. (C) Quantification of Lamp1 signal in rats treated with vehicle, PF-360 alone, rotenone alone and rotenone + PF-360. Symbols represent individual rats. Comparison by ANOVA with Bonferroni correction. (D) Quantification of p62/SQSTM1 signal in rats treated with vehicle, PF-360 alone, rotenone alone and rotenone + PF-360. Symbols represent individual rats. Comparison by ANOVA with Bonferroni correction. (E) Quantification of Lamp2A signal in rats treated with vehicle, PF-360 alone, rotenone alone and rotenone + PF-360. Symbols represent individual rats. Comparison by ANOVA with Bonferroni correction. (F) Substantia nigra Lamp1 and p62/SQSTM1 immunoreactivity in a control brain and 2 iPD brains. In controls, dopamine neurons contain many small punctae of Lamp1 immunoreactivity and very little detectable p62/SQSTM1, presumably reflecting efficient autophagic flux. In iPD brains, note the marked loss of Lamp1 and accumulation of p62/SQSTM1 into large inclusions (Lewy bodies) in dopamine neurons in the iPD brains. (G) Quantification of Lamp1 in control vs iPD dopamine neurons. Symbols represent individual brains. Comparison by unpaired 2-tail t-test. (H) Quantification of Lamp1 in control vs iPD dopamine neurons. Symbols represent individual brains. Comparison by unpaired 2-tail t-test.
Figure 7.
Figure 7.
Accumulated pSer129-α-synuclein binds to TOM20 in iPD and this is replicated in the rotenone rat model and is prevented by co-treatment with a LRRK2 kinase inhibitor. (A) pSer129-α-synuclein- (pS129syn)-TOM20 PL signal in human control and iPD substantia nigra brain sections. (B) Quantification of the pS129syn-TOM20 PL signal in 8 control brains and 7 iPD brains. Comparison by unpaired 2-tail t-test. (C) pS129syn-TOM20 PL signal and Ndufs3 immunoreactivity in substantia nigra of rats treated with vehicle, PF-360 alone, rotenone alone and rotenone + PF-360. In rotenone treated rats there is increased pS129syn-TOM20 PL signal and reduced levels and diffuse redistribution of the nuclear encoded and imported complex I subunit, Ndufs3. These abnormalities were prevented by treatment with PF-360. (D) Quantification of the pS129syn-TOM20 PL signal in substantia nigra of rats treated with vehicle, PF-360 alone, rotenone alone and rotenone + PF-360. Symbols represent individual rats. Comparison by ANOVA with Bonferroni correction. (E) Graphical representation of the distribution and fluorescence intensity levels of Ndufs3 in nigral dopamine neurons in rats treated with vehicle, PF-360 alone, rotenone alone and rotenone + PF-360. Note the loss of punctate, high intensity staining in the rotenone animals that is preserved by co-treatment with PF-360.
Figure 8.
Figure 8.
Activation of LRRK2 kinase activity in iPD and its downstream consequences. Our data suggest that most wildtype endogenous LRRK2 is normally in an inactive state bound to 14-3-3 protein (although the specific isoform(s) of 14-3-3 have not been defined here). ROS signaling activates LRRK2 as indicated by phosphorylation of serine 1292 and dissociation from 14-3-3. In turn, LRRK2 kinase activity phosphorylates Rab10 at threonine 73 and inhibits its function by preventing binding to Rab GDP-dissociation inhibitor factors necessary for membrane delivery and recycling. As a result, there is impairment of endosomal and lysosomal function, which leads to accumulation of pSer129-α-synuclein, a known inhibitor of mitochondrial protein import. Blockade of mitochondrial protein import leads to senescent mitochondria that produce more ROS that can feed forward to amplify this cycle. LRRK2 kinase inhibitors block the downstream effects of LRRK2 activation.

References

    1. Kalia LV, Lang AE, Parkinson disease in 2015: Evolving basic, pathological and clinical concepts in PD. Nat Rev Neurol 12, 65–66 (2016). - PubMed
    1. Paisan-Ruiz C, Jain S, Evans EW, Gilks WP, Simon J, van der Brug M, Lopez de Munain A, Aparicio S, Gil AM, Khan N, Johnson J, Martinez JR, Nicholl D, Carrera IM, Pena AS, de Silva R, Lees A, Marti-Masso JF, Perez-Tur J, Wood NW, Singleton AB, Cloning of the gene containing mutations that cause PARK8-linked Parkinson’s disease. Neuron 44, 595–600 (2004). - PubMed
    1. Zimprich A, Biskup S, Leitner P, Lichtner P, Farrer M, Lincoln S, Kachergus J, Hulihan M, Uitti RJ, Calne DB, Stoessl AJ, Pfeiffer RF, Patenge N, Carbajal IC, Vieregge P, Asmus F, Muller-Myhsok B, Dickson DW, Meitinger T, Strom TM, Wszolek ZK, Gasser T, Mutations in LRRK2 cause autosomal-dominant parkinsonism with pleomorphic pathology. Neuron 44, 601–607 (2004). - PubMed
    1. Simon-Sanchez J, Schulte C, Bras JM, Sharma M, Gibbs JR, Berg D, Paisan-Ruiz C, Lichtner P, Scholz SW, Hernandez DG, Kruger R, Federoff M, Klein C, Goate A, Perlmutter J, Bonin M, Nalls MA, Illig T, Gieger C, Houlden H, Steffens M, Okun MS, Racette BA, Cookson MR, Foote KD, Fernandez HH, Traynor BJ, Schreiber S, Arepalli S, Zonozi R, Gwinn K, van der Brug M, Lopez G, Chanock SJ, Schatzkin A, Park Y, Hollenbeck A, Gao J, Huang X, Wood NW, Lorenz D, Deuschl G, Chen H, Riess O, Hardy JA, Singleton AB, Gasser T, Genome-wide association study reveals genetic risk underlying Parkinson’s disease. Nat Genet 41, 1308–1312 (2009). - PMC - PubMed
    1. Greggio E, Jain S, Kingsbury A, Bandopadhyay R, Lewis P, Kaganovich A, van der Brug MP, Beilina A, Blackinton J, Thomas KJ, Ahmad R, Miller DW, Kesavapany S, Singleton A, Lees A, Harvey RJ, Harvey K, Cookson MR, Kinase activity is required for the toxic effects of mutant LRRK2/dardarin. Neurobiol Dis 23, 329–341 (2006). - PubMed

Publication types

MeSH terms

Substances