. 2018 Jul 26;3(14):e120422.
doi: 10.1172/jci.insight.120422.

The RUNX1/IL-34/CSF-1R axis is an autocrinally regulated modulator of resistance to BRAF-V600E inhibition in melanoma

Affiliations

The RUNX1/IL-34/CSF-1R axis is an autocrinally regulated modulator of resistance to BRAF-V600E inhibition in melanoma

Orsi Giricz et al. JCI Insight. .

Abstract

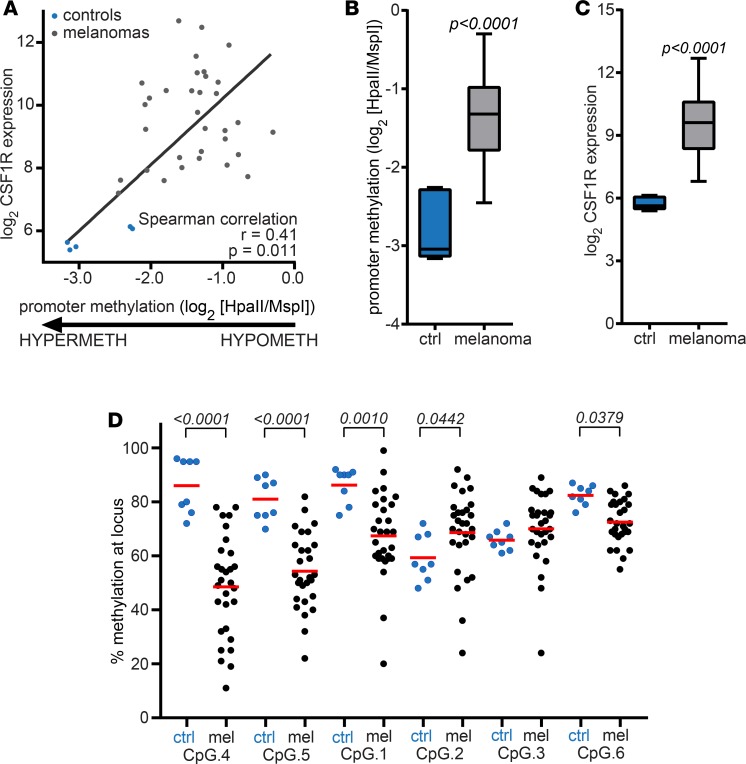
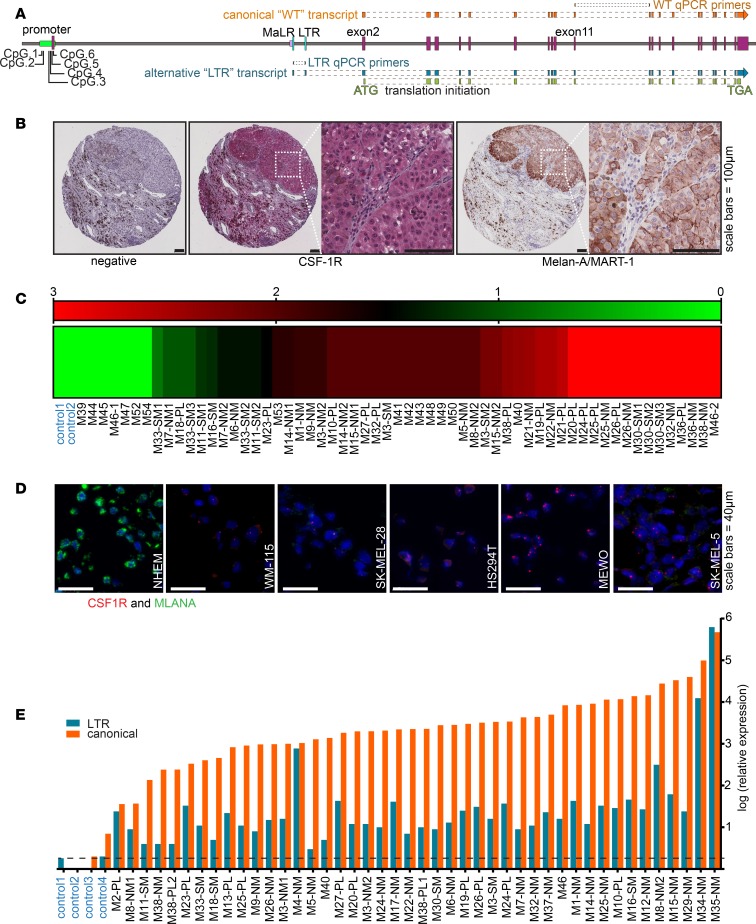
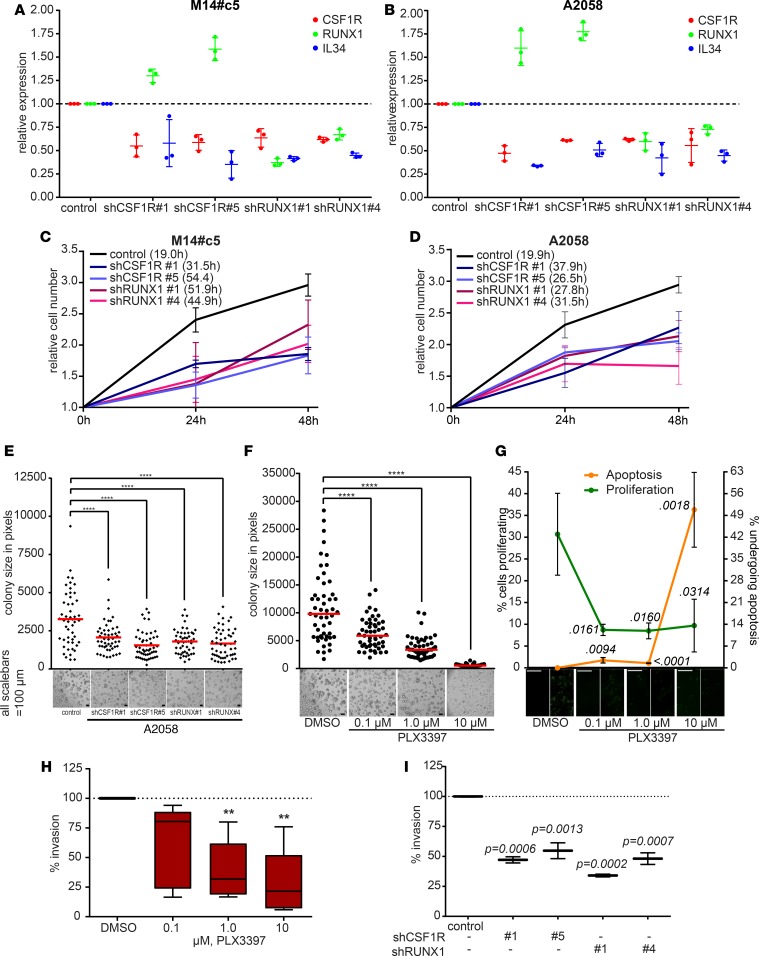
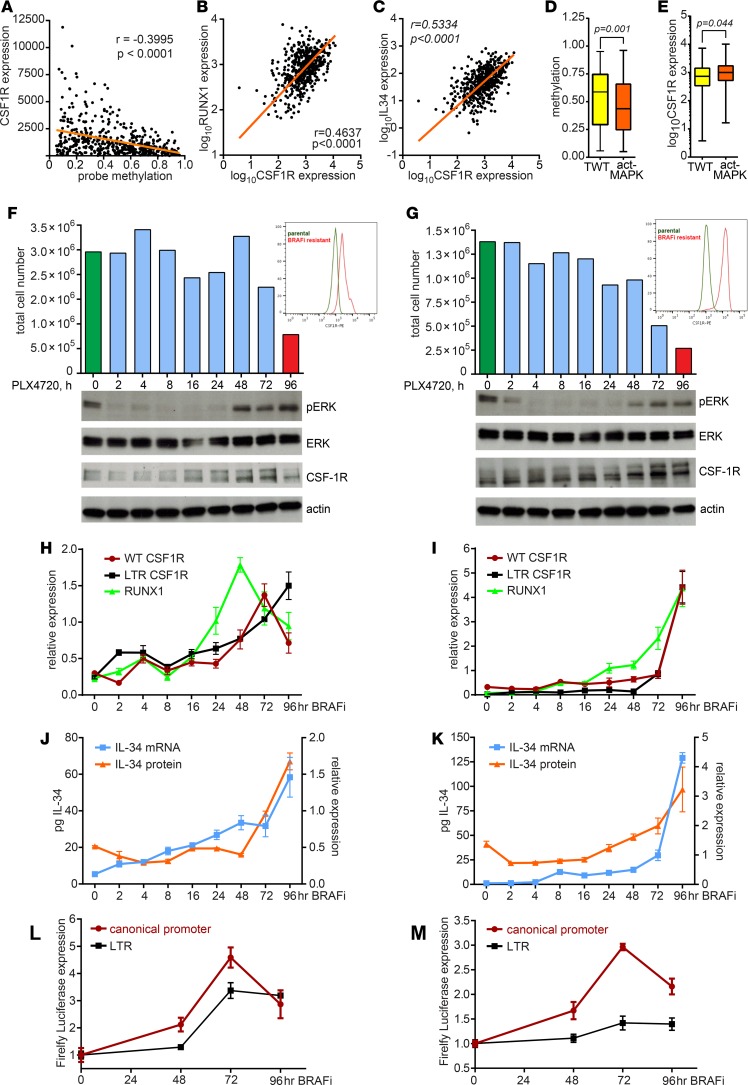
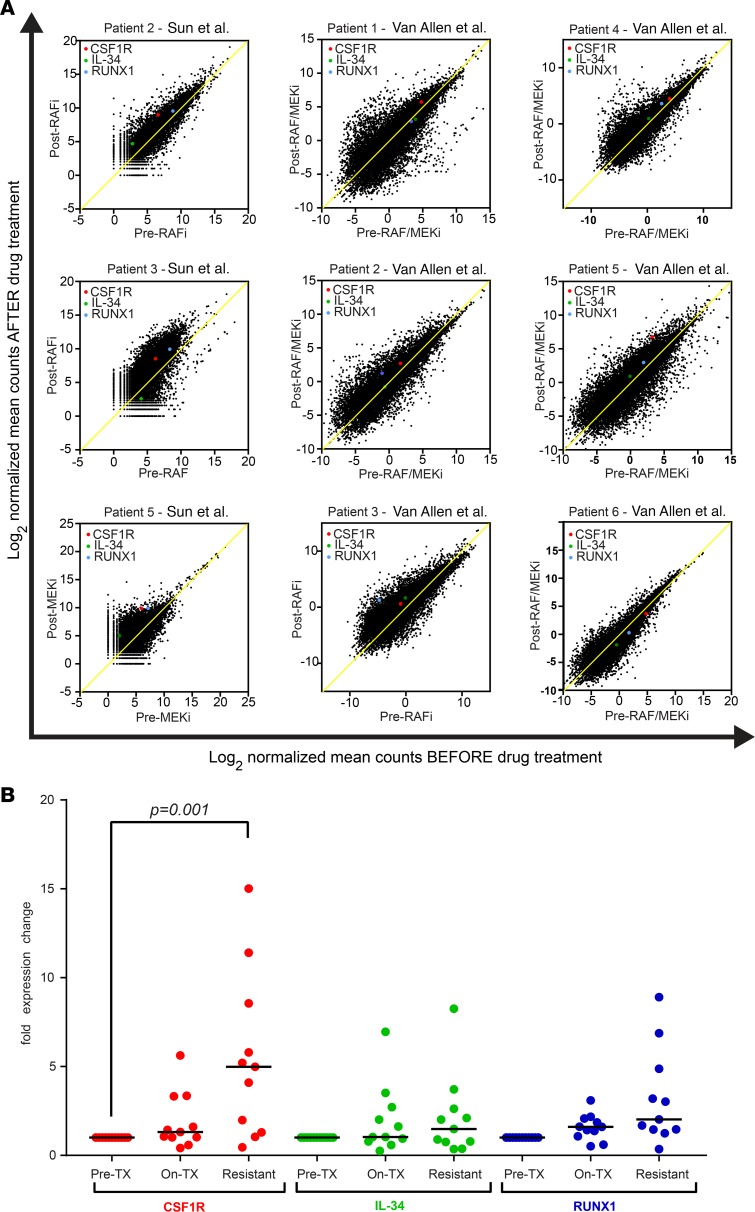
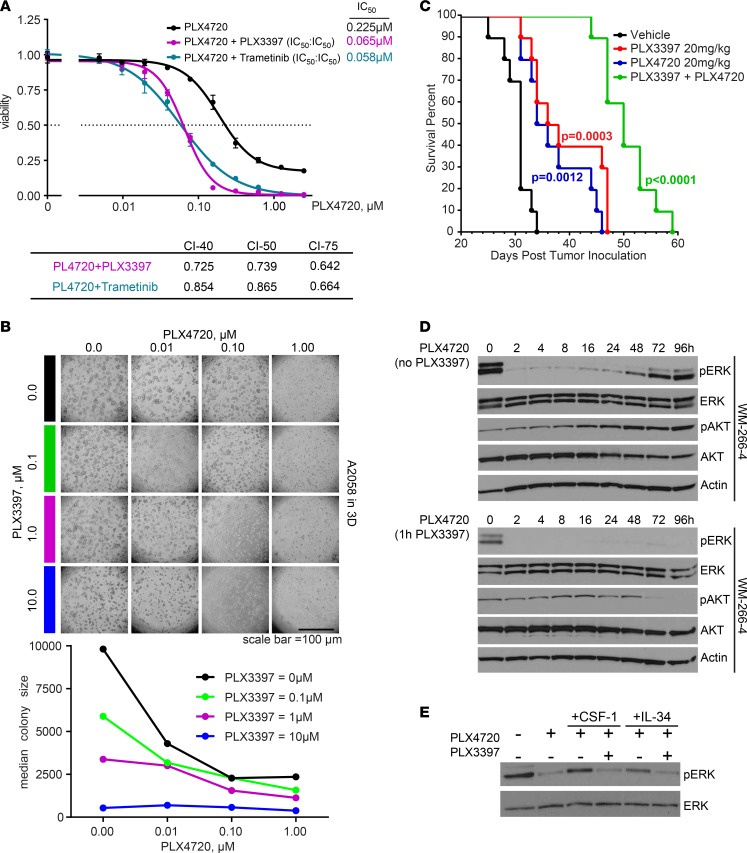
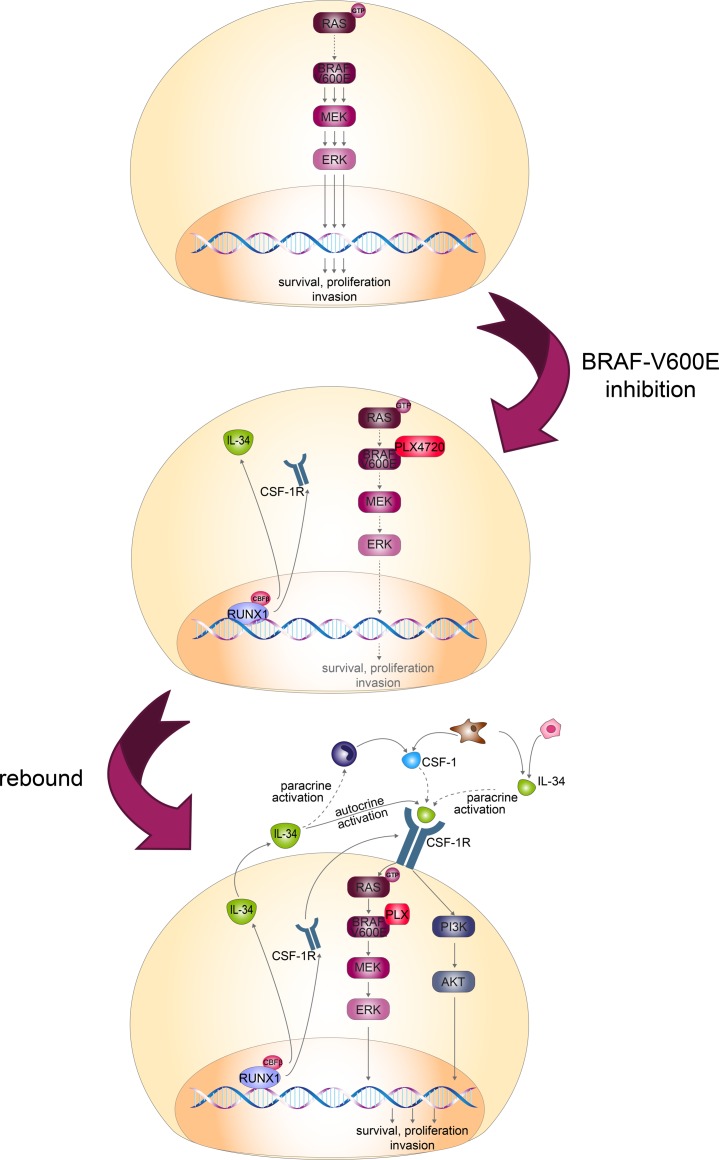
Resistance to current therapies still impacts a significant number of melanoma patients and can be regulated by epigenetic alterations. Analysis of global cytosine methylation in a cohort of primary melanomas revealed a pattern of early demethylation associated with overexpression of oncogenic transcripts. Loss of methylation and associated overexpression of the CSF 1 receptor (CSF1R) was seen in a majority of tumors and was driven by an alternative, endogenous viral promoter in a subset of samples. CSF1R was particularly elevated in melanomas with BRAF and other MAPK activating mutations. Furthermore, rebound ERK activation after BRAF inhibition was associated with RUNX1-mediated further upregulation of CSF-1R and its ligand IL-34. Importantly, increased CSF-1R and IL-34 overexpression were detected in an independent cohort of resistant melanomas. Inhibition of CSF-1R kinase or decreased CSF-1R expression by RNAi reduced 3-D growth and invasiveness of melanoma cells. Coinhibition of CSF-1R and BRAF resulted in synergistic efficacy in vivo. To our knowledge, our data unveil a previously unknown role for the autocrine-regulated CSF-1R in BRAF V600E resistance and provide a preclinical rationale for targeting this pathway in melanoma.

Keywords: Melanoma; Oncology.


Conflict of interest statement

Conflict of interest: THN, BM, RS, EB, JT, CZ, GH, GBF, GB, and BLW are employees of Plexxikon.

Figures

Figure 1
Figure 1. Melanoma is characterized by widespread changes in DNA methylation.
(A) Unsupervised hierarchical clustering of DNA methylation profiles generated by the HELP assay. The melanoma samples are separated into 3 major clusters (M1, M2, and M3). PL, primary lesion; NM, nodal metastasis; SM, soft-tissue metastasis. Clinical data are provided in Supplemental Table 1. (B) Volcano plot showing difference of mean methylation and statistical significance of the difference, with the number of differentially methylated loci indicated. Numbers to the left indicate hypermethylated loci, and numbers to the right indicate Differentially methylated regions (DMRs) in melanoma. An FDR of less than 5% is used as a marker of significant differences. (C) Global methylation levels tested by the LUMA assay indicate loss of methylation in malignant melanoma samples (n = 36) (unpaired t test, 2-tailed). (D and E) Predominantly hypomethylated loci are seen in primary tumors and nodal and distant metastasis. The single blue dot (located in the right upper quadrant) in the volcano plots indicate the CSF1R locus. (F) The genomic position of every HpaII-amplifiable fragment on the HELP array was compared with the location of known CpG islands, demonstrating demethylated DMRs enriched outside of CpG-islands (proportions test). (G) Box plots of mean DNA copy number alterations (gains + losses) for melanoma sample clusters based on methylation (M1, M2, and M3) (1-way ANOVA). (H) Global methylation (%5mC) and hydroxymethylation (%5HmC) in melanocytes (n = 3), melanoma tumors (n = 4), and cells (n = 3) (1-way ANOVA).
Figure 2
Figure 2. CSF1R is hypomethylated and overexpressed in melanoma in a large subset of samples.
(A) Mean hypomethylation of the CSF1R promoter shows positive correlation with gene expression across all samples. The greater value of the log2(HpaII/MspI) demonstrates less methylation (Spearman’s correlation, r = 0.41, P = 0.011). (B) Mean methylation of the CSF1R promoter in melanoma samples compared with melanocyte controls shows less methylation in melanoma (unpaired t test, 2-tailed; P < 0.0001). (C) Mean array-based expression of CSF1R in melanoma samples compared with melanocyte controls (n = 5) shows higher expression in melanoma (n = 36) (unpaired t test, 2-tailed; P < 0.0001). (D) MassARRAY-based single bp validation of CpG methylation (CpG.1 through CpG.6) within the CSF1R promoter indicates demethylation in the tumor samples. Percent cytosine methylation depicted by a scatter plot (1-way ANOVA).
Figure 3
Figure 3. CSF-1R expression in melanoma.
(A) The human CSF1R gene is composed of a total of 22 exons (purple rectangles), of which the first exon is noncoding and where the remaining 21 exons (starting with exon 2) encode for the canonical CSF-1R protein. Two additional viral exons (light blue rectangles) are transcribed as part of the LTR transcript. There are 6 differentially methylated CpG sites in the canonical promoter (light green rectangle). Viral sequence (MaLR LTR) denoted with light purple rectangle. (B) Representative images of archival formalin-fixed paraffin-embedded melanoma tissue samples on tissue microarrays shown immunostained for MelanA and for CSF-1R. (C) Staining was compared with a positive control (placenta). The maximal intensity of VECTOR Red staining was graded on a 0–3 scale (0, negative; 1, weak; 2, medium; 3, strong staining) and demonstrate expression on the melanoma cells. The controls are labeled in blue. (D) RNA-FISH of CSF1R and MLANA on cells of melanocytic origin: normal human epidermal melanocytes (NHEM) and melanoma cells (WM-155, SK-MEL-28, MEWO, SK-MEL-5, HS294T). (E) qPCR analysis (mean) showing expression of both forms of CSF1R in the melanoma tissue samples. Dashed vertical line showing average LTR expression in controls.
Figure 4
Figure 4. CSF1R expression is activated by an aberrant upstream promoter, and the CSF-1R regulates melanoma growth and invasion.
(A and B) Five different lentiviral shRNAs were evaluated for CSF1R and RUNX1. Among these, shRUNX1#1, shRUNX1#4, shCSF1R#1, and shCSF1R#5 conferred the strongest knockdown. Therefore, these were used for all subsequent experiments. Gene-expression analysis of CSF1R, RUNX1, and IL-34 in melanoma cell lines M14c#5 (A) and A2058 (B) stably harboring shRNA species against CSF1R or RUNX1 (3 biological replicates). (C–F) Proliferation of the stable knockdown cell lines with the doubling times (hours) in parentheses (C and D); for statistical analysis see Supplemental Figure 5A. Three-dimensional Matrigel cell culture of the stable A2058 cells (E) and the parental A2058 cells cultured with increasing dose of PLX3397 (F). (G) Pictures taken on the fifth day of culture; red line, median colony size in pixels. Quantitative analysis of cells undergoing proliferation and apoptosis in the 3-D cultures (t test, 2-tailed). (H and I) Larger images of all 3-D cultures are provided in Supplemental Figure 5, C and D (representative images, 3-D experiments performed twice). Transwell invasion assay (mean ± SEM) of A2058 cells using the CSF-1R inhibitor PLX3397 (H) and of A2058 stable RUNX1 or CSF1R knockdowns (I); images represent 3 biological replicates. All statistical analyses of 3-D colony size and invasion assays: 1-way ANOVA (statistical significance levels are noted with asterisks,**P ≤ 0.01, ****P ≤ 0.0001).
Figure 5
Figure 5. ERK-pathway rebound following 96-hour BRAF V600E inhibitor treatment is associated with increased expression of RUNX1, CSF1R, and IL-34.
(A) CSF1R probe methylation shows negative correlation with CSF1R gene expression across all 471 TCGA melanoma samples (Spearman’s correlation, r = –0.3995, P < 0.0001, orange line denotes linear regression). (B and C) CSF1R expression shows positive correlation with that of RUNX1 (r = 0.464, P < 0.0001) (B) or with the expression of IL34 (r = 0.533, P < 0.0001) (C). (D and E) CSF1R probe methylation (D) and gene expression (E) of TCGA melanomas with MAPK-activating mutation (act-MAPK) and without (triple WT, TWT) (unpaired t test, 2-tailed). (F–M) A2058 (F, H, J, L) or WM-266-4 (G, I, K, M) cells were treated with 3 μM PLX4720 and/or serum-free medium for a total of 96 hours. (F and G) Cell lysates assayed for gene expression and protein expression; supernatants assayed for secreted proteins. Detailed schematic of the experiment is provided in Supplemental Figure 7A. Melanoma cell numbers were counted for every time-point condition. Immunoblotting of total protein extracts from all time points was performed to detect protein levels of phospho-ERK, total ERK, and actin, as well as to evaluate both the levels and posttranslational maturation of CSF-1R protein. Surface expression of CSF-1R protein was followed by flow cytometry (small inserts). (H and I) qPCR analysis (mean ± SEM) for relative expression of RUNX1 and for both transcripts of CSF1R. (J and K) qPCR of IL-34 expression and ELISA analysis of IL-34–secreted protein expression (mean ± SEM for both). (L and M) Luciferase activity in melanoma cells stably harboring a plasmid construct of the canonical promoter of CSF1R or the CSF1R MaLR LTR linked to Firefly luciferase show increased activity at both regulatory regions (mean ± SEM). Representative images from 3 independent experiments.
Figure 6
Figure 6. Gene expression analysis of CSF1R, RUNX1, and IL-34 in refractory BRAF V600E melanoma patients.
(A) Scatter plots of log2 normalized read counts between pre- and posttreatment (resistant tumors) with RAF, MEK, or RAF/MEK inhibition in 9 BRAF V600E melanoma patients. (B) Changes in expression of CSF1R, IL-34, and RUNX1 while on treatment of MAPK pathway inhibitors (On-TX) or in refractory tumor samples compared with the pretreatment biopsies (Pre-TX) (1-way ANOVA).
Figure 7
Figure 7. Coinhibition of BRAF V600E and CSF-1R is synergistic in melanoma.
(A) Using a constant ratio, the V600E inhibitor was combined with either the CSF-1R inhibitor or a MEK inhibitor based on the IC50 value of each drug and used to treat melanoma cells in quadruplicate for 72 hours. The alamarBlue assay was then performed to estimate cell growth inhibition, and curves (mean ± SEM) are shown with the combination index (CI) indicated in the table below for each condition where values <1 demonstrate synergy. (B) Micrographs taken on the fifth day of A2058 3-D cell culture grown with serial dilutions of PLX3397 or PLX4720, as well as of the combination of these 2 inhibitors. Growth inhibition effect of these conditions depicted as median colony size shown. Fifty colonies were measured for each condition. For statistical analysis, see Supplemental Figure 6, D, E, and F. (C) Kaplan-Meier survival curve of A2058 xenografted mice (10 in each group) treated with PLX3397 or PLX4720 or with PLX3397 plus PLX4720 demonstrating significant improvement with combination (log-rank [Mantel-Cox] test, P values indicated in Supplemental Figure 6G). (D) The effect of combined PLX3397/PLX4720 treatment on signaling in the WM-266-4 cell line as depicted by immunoblotting against phospho-ERK, total ERK, phospho-AKT, total AKT, and actin. Cells were lysed after a 96-hour, 3 μM PLX4720 time-course treatment with or without 30 μM PLX3397 added in the last hour. (E) The effect of IL-34 and CSF-1 on the rebound of ERK phosphorylation in A2058 cells as demonstrated by immunoblotting detecting phospho-ERK1/2, total ERK1/2, and actin. Total melanoma cell extract were probed after a 2-hour treatment of 3 μM PLX4720 with or without 30 μM PLX3397, with 100 ng/ml rCSF-1 or rIL-34 added in the last 15 minutes.
Figure 8
Figure 8. The role of CSF-1R and IL-34 in BRAF V600E inhibitor resistance.
Low-level ERK-pathway activity induces the expression of RUNX1, leading to expression, maturation, and presentation of CSF-1R and IL-34. Coexpression of the receptor and the ligand leads to high oncogenic potential because of paracrine activation. The CSF-1R on the surface of melanoma cells can also be activated by ligands expressed by other cell types present in the microenvironment, and IL-34 can activate other cell types bearing the receptor in a paracrine manner.

References

    1. Howlader N, et al. SEER Cancer Statistics Review, (CSR) 1975-2015. National Cancer Institute. https://seer.cancer.gov/csr/1975_2015/ Published April 16, 2018. Accessed June 27, 2018.
    1. Cancer Genome Atlas Network Genomic Classification of Cutaneous Melanoma. Cell. 2015;161(7):1681–1696. doi: 10.1016/j.cell.2015.05.044. - DOI - PMC - PubMed
    1. Eroglu Z, Ribas A. Combination therapy with BRAF and MEK inhibitors for melanoma: latest evidence and place in therapy. Ther Adv Med Oncol. 2016;8(1):48–56. doi: 10.1177/1758834015616934. - DOI - PMC - PubMed
    1. Flaherty KT, et al. Improved survival with MEK inhibition in BRAF-mutated melanoma. N Engl J Med. 2012;367(2):107–114. doi: 10.1056/NEJMoa1203421. - DOI - PubMed
    1. Wolchok JD, et al. Updated results from a phase III trial of nivolumab (NIVO) combined with ipilimumab (IPI) in treatment-naive patients (pts) with advanced melanoma (MEL) (CheckMate 067) J Clin Oncol. 2016;34(15_suppl):9505

Publication types

MeSH terms

Substances

LinkOut - more resources