. 2018 Jul 26;3(14):e121221.
doi: 10.1172/jci.insight.121221.

Cachexia-associated adipose loss induced by tumor-secreted leukemia inhibitory factor is counterbalanced by decreased leptin

Affiliations

Cachexia-associated adipose loss induced by tumor-secreted leukemia inhibitory factor is counterbalanced by decreased leptin

Gurpreet K Arora et al. JCI Insight. .

Abstract

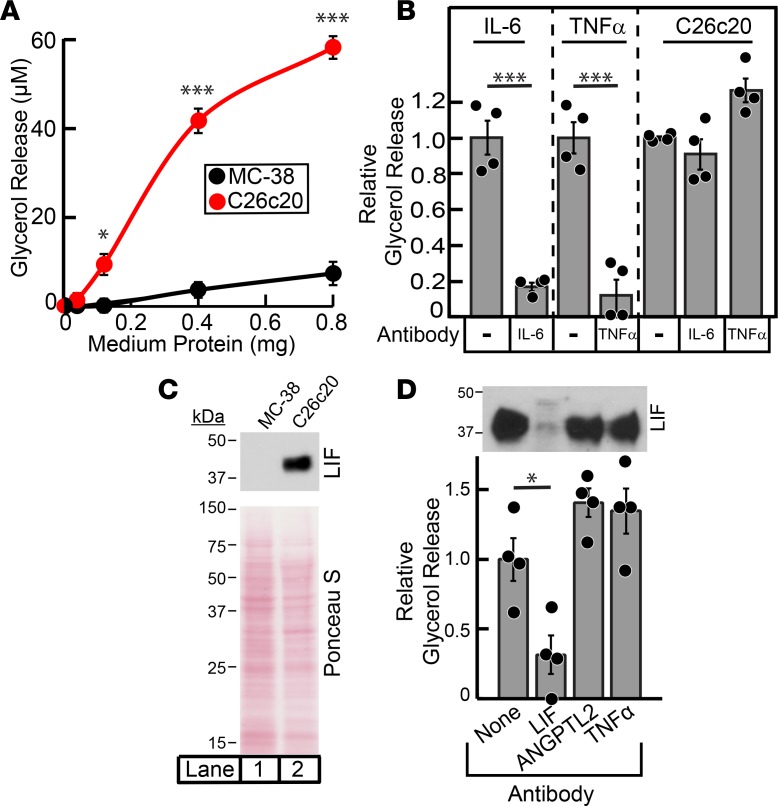
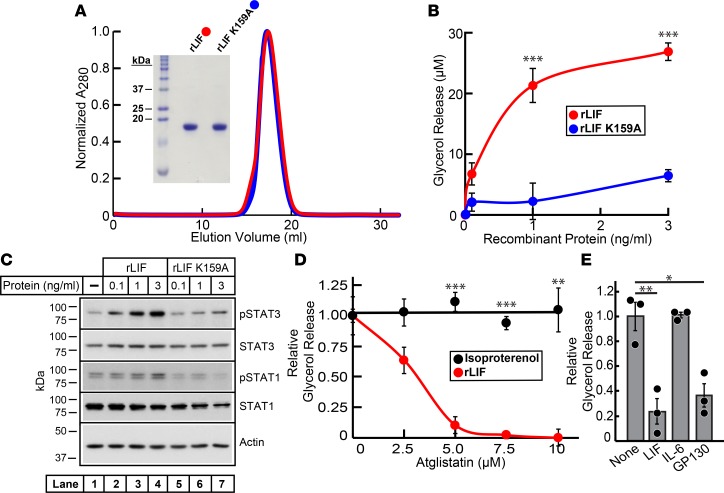
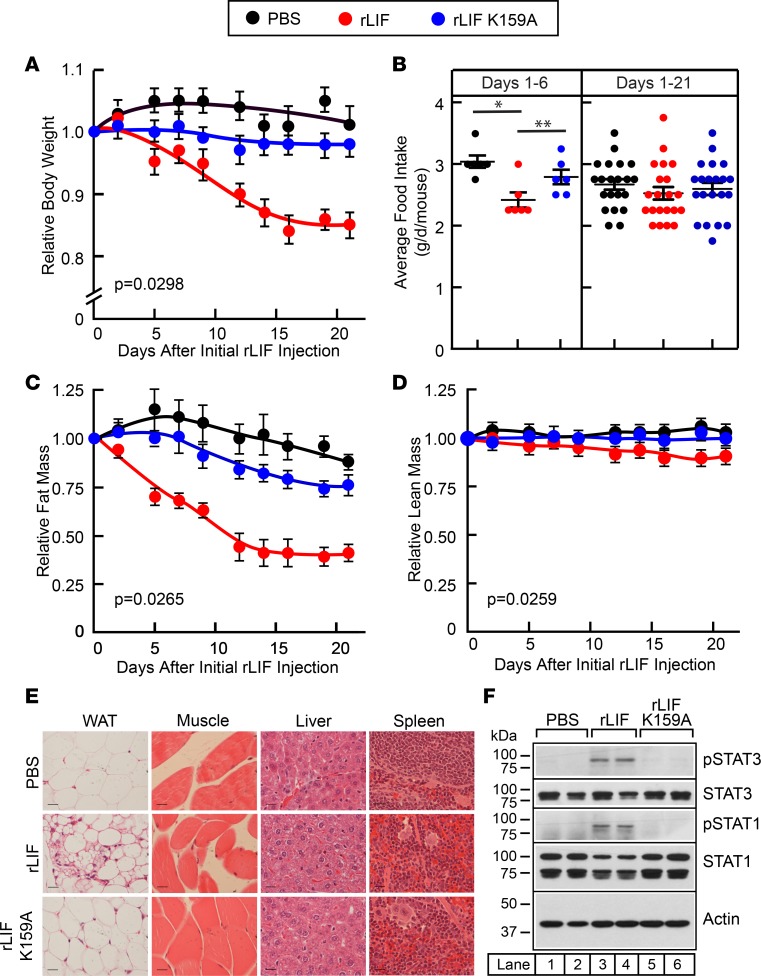
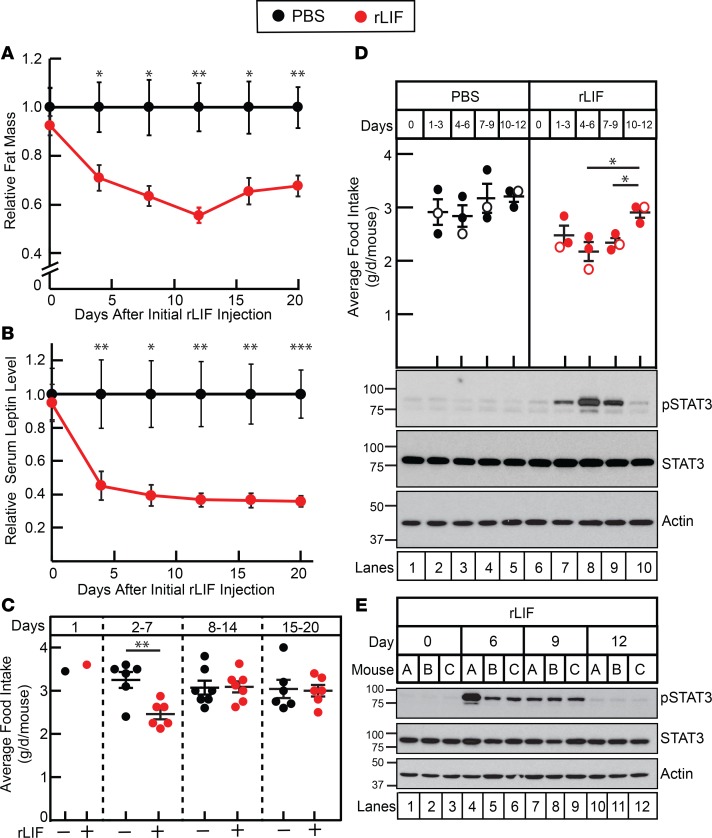
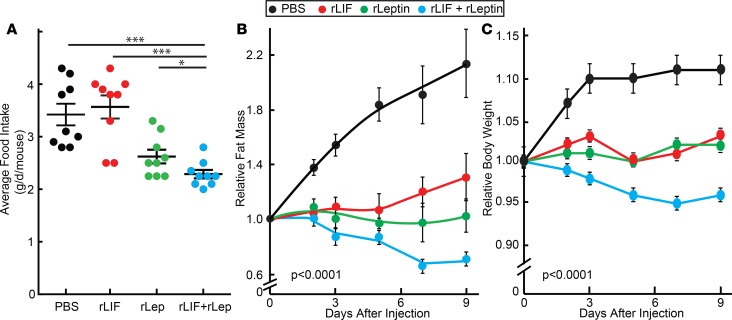
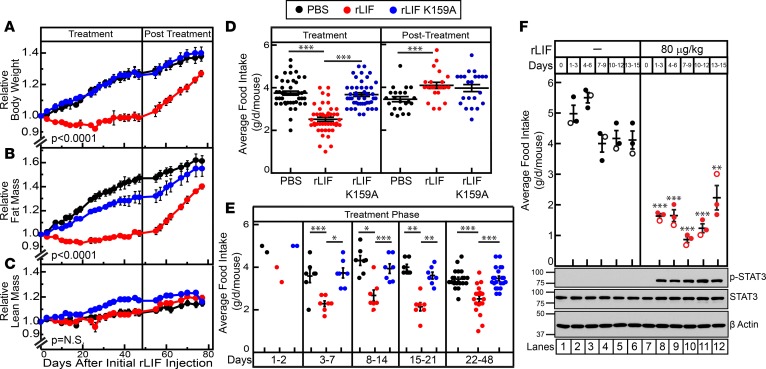
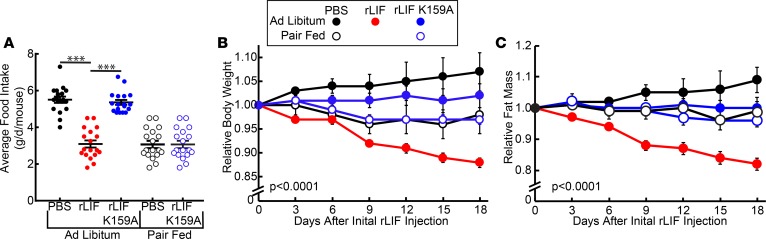
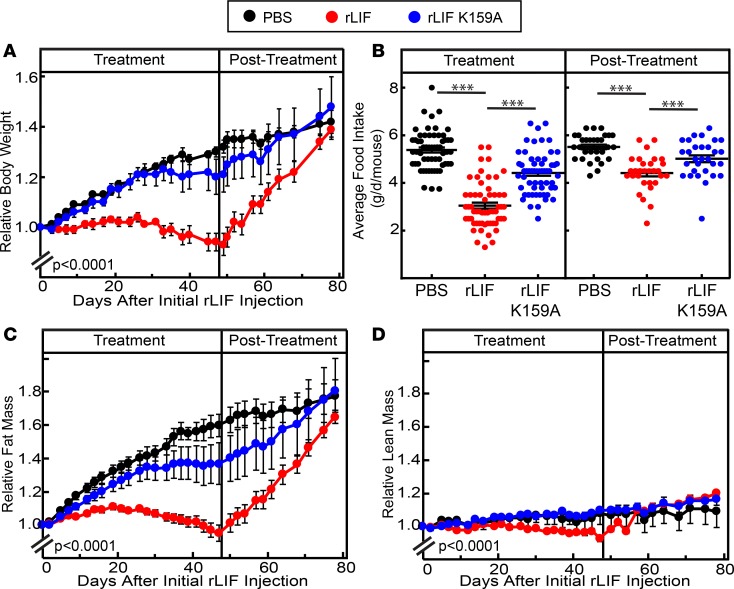
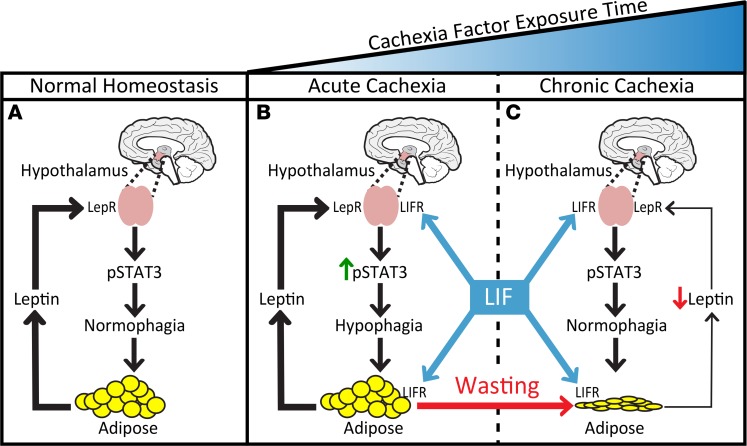
Cachexia syndrome consists of adipose and muscle loss, often despite normal food intake. We hypothesized that cachexia-associated adipose wasting is driven in part by tumor humoral factors that induce adipocyte lipolysis. We developed an assay to purify secreted factors from a cachexia-inducing colon cancer line that increases lipolysis in adipocytes and identified leukemia inhibitory factor (LIF) by mass spectrometry. Recombinant LIF induced lipolysis in vitro. Peripheral LIF administered to mice caused >50% loss of adipose tissue and >10% reduction in body weight despite only transient hypophagia due to decreasing leptin. LIF-injected mice lacking leptin (ob/ob) resulted in persistent hypophagia and loss of adipose tissue and body weight. LIF's peripheral role of initiating lipolysis in adipose loss was confirmed in pair-fed ob/ob mouse studies. Our studies demonstrate that (a) LIF is a tumor-secreted factor that promotes cachexia-like adipose loss when administered peripherally, (b) LIF directly induces adipocyte lipolysis, (c) LIF has the ability to sustain adipose and body weight loss through an equal combination of peripheral and central contributions, and (d) LIF's central effect is counterbalanced by decreased leptin signaling, providing insight into cachexia's wasting, despite normophagia.

Keywords: Adipose tissue; Cytokines; Leptin; Metabolism; Oncology.


Conflict of interest statement

Conflict of interest: The authors have declared that no conflict of interest exists.

Figures

Figure 1
Figure 1. Biochemical characterization of lipolysis activity from C26c20 cell line medium.
(A and B) Characterization of cancer cell line medium-induced adipocyte lipolysis. Medium was collected, processed, and protein quantified from C26c20 or MC-38 cells as described in Methods. Differentiated adipocytes in a 12-well format were treated with 1.5 ml of medium E with the indicated amount of C26c20 or MC-38 medium (A) or 150 ng of recombinant IL-6, 150 ng of recombinant TNFα, or either 1.8 mg or 3.1 mg C26c20 medium in the absence or presence of 4.5 μg of the indicated antibody (B). After incubation for 20 hours at 37˚C, medium was collected and glycerol concentration was measured using the adipocyte lipolysis assay described in Methods. Data are shown as mean ± SEM (A) or dot plots with bars representing mean ± SEM (B) of 3 or 4 (A and B, respectively) experiments and represents the absolute increase of medium glycerol concentration over background (A) or as the relative change in medium glycerol concentration compared with conditions containing the indicated protein without antibody (B) (IL-6, 54 and 19 μM; TNFα, 25 and 36 μM; C26c20 medium, 37 and 20 μM). (C) Leukemia inhibitory factor (LIF) expression in medium of cancer cells. Medium (15 ml) from C26c20 and MC-38 was concentrated to a final volume of 150 μl using a 10 kDa MW cut-off Amicon Ultra centrifugal filter, and protein was quantified using a bicinchoninic acid kit. Protein (20 μg) was subjected to IB analysis with anti-LIF and Ponceau S stain described in Methods. (D) Immunodepletion of LIF from partially purified C26c20 medium. C26c20 medium was partially purified as described in Methods. Approximately 14 μg of the elution fractions containing lipolysis activity in Step 1 of the partial purification of C26c20 medium in 300 μl of buffer A with 0.2% BSA was subjected to immunodepletion described in Methods using 2 μg of the indicated antibody. The supernatant fraction from the immunodepletion was collected, and 30 μl was subjected to IB analysis with the indicated antibody and 20 μl subjected to the adipocyte lipolysis assay described in Methods. Data are shown as dot plots with bars representing mean ± SEM of 4 experiments and is represented as the relative change in medium glycerol concentration compared with conditions containing the indicated protein without antibody (33 and 64 μM). *P < 0.05 and ***P < 0.001 based on Student’s t test.
Figure 2
Figure 2. Recombinant LIF induces adipocyte lipolysis through ATGL using its canonical signaling pathway.
(A) Gel-filtration chromatography of recombinant proteins. WT recombinant leukemia inhibitory factor (rLIF) and rLIF K159A were purified as described in Methods. Buffer C (1 ml) containing 5–6 mg of rLIF (red) or rLIF K159A (blue) was loaded on to a Tricorn 10/300 Superdex 200 column and chromatographed at a flow rate of 0.5 ml/min. Absorbance at 280 nm (A280) was monitored continuously to identify rLIF (red) and rLIF K159A (blue). Maximal A280 values for each protein (rLIF, 576 mAU; rLIF K159A, 728 mAU) were normalized to 1. (Inset) The indicated protein (4 μg of each) was subjected to 15% SDS/PAGE and stained with Coomassie. (B–D) Differentiated adipocytes in a 12-well format were treated in a final volume of 1.5 ml of medium E supplemented with either the indicated concentration of rLIF or rLIF K159A (B and C) or with 30 nM isoprotererenol or 1 ng/ml rLIF in the absence or presence of the indicated concentration of Atglistatin (D). After incubation for 20 hours at 37˚C, medium was collected and glycerol concentration was measured using the adipocyte lipolysis assay (B and D), or adipocyte cells were harvested and subjected to IB analysis (C, 10 μg/lane) with the indicated antibody as described in Methods. Each data point represents the mean ± SEM of the absolute glycerol concentration over background (B) or the relative change in medium glycerol concentration compared with conditions containing rLIF without Atglistatin (red, 26 μM) or isoproterenol without Atglistatin (black, 83 μM) (D). (E) SVF adipocytes were differentiated in a 48-well format as described in Methods. Differentiated adipocytes in 48-well format were treated in a final volume of 300 μl of medium E supplemented with 1 ng/ml rLIF in the absence or presence of 3 μg/ml of the indicated antibody. After incubation for 20 hours at 37˚C, medium was collected and glycerol concentration was measured using the adipocyte lipolysis assay as described in Methods. Data is shown as dot plots with bars representing mean ± SEM of the relative change in medium glycerol concentration compared with conditions containing rLIF without antibody (32 μM). (A–E) These results were confirmed in 2 (E) or 3 (A–D) independent experiments. *P < 0.05, **P < 0.01, and ***P < 0.001 based on Student’s t test.
Figure 3
Figure 3. LIF induces adipose tissue and body weight loss without persistent change in food intake in Balb/c mice.
(A–F) Chow-fed Balb/c mice (10-week-old males) were housed 4 mice per cage and injected i.p. with 100 μl PBS in the absence or presence of rLIF or rLIF K159A at 80 μg/kg body weight twice daily throughout the experiment. Body weight (A), food intake (B), and ECHO MRI measurements of fat mass (C) and lean mass (D) were measured at 9 a.m. at the indicated time points. Body weight, fat mass, and lean mass are shown relative to the average day 0 reference value for each respective cohort. The average values for body weight (A) at day 0 were 21.3, 21.8, and 22.3 g for the PBS-, rLIF-, and rLIF K159A–treated mice, respectively. The average values for fat mass (C) at day 0 were 2.4, 3.1, and 3.1 g for the PBS-, rLIF-, and rLIF K159A–treated mice, respectively. The average values for lean mass (D) at day 0 were 16.1, 16.3, and 16.5 g for the PBS-, rLIF-, and rLIF K159A–treated mice, respectively. Each value represents mean ± SEM of 4 mice. (E and F) Epididymal white adipose tissue (eWAT), gastrocnemius muscle, liver, and spleen were harvested 21 days after start of injections. Representative sections stained with H&E (E) of each of these tissues are shown. Magnification, 40×; scale bar: 270 μm. Additionally, eWAT from 2 representative mice from each cohort was processed, and aliquots of cell lysate (15 μg/lane) were subjected to IB analysis (F) with the indicated antibodies as described in Methods. (A–F) These results were confirmed in at least 3 independent experiments. *P < 0.05 and **P < 0.01 based on Student’s t test (B) or P value based on use of Generalized Estimating Equation approach comparing multiple groups over time with rLIF-treated mice as the reference value (A, C, and D).
Figure 4
Figure 4. LIF’s central anorexic effect is reversed by decreased leptin signaling.
(A–C) Leptin levels relative to fat mass and food intake in rLIF-treated C57BL/6J mice. Chow-fed C57BL/6J mice (8-week-old males) were housed 4 mice per cage and injected i.p. with 100 μl PBS in the absence or presence of rLIF at 80 μg/kg body weight twice daily throughout the experiment. ECHO MRI measurements of fat mass (A), food intake (C), and serum leptin (B) were measured as described in Methods and are shown relative to the PBS-treated control mice at the indicated time points. The average values for fat mass (A) of PBS-treated control mice were 2.8, 2.7, 2.8, 3.0, 3.0, and 3.2 g for days 0, 4, 8, 12, 16, and 20, respectively. The average values for leptin concentration (B) of PBS-treated control mice were 3.0, 2.0, 2.9, 2.7, 3.2, and 3.3 ng/ml for days 0, 4, 8, 12, 16, and 20, respectively. Each value represents mean ± SEM of 8 mice. (D and E) Chow-fed C57BL/6J mice (11-week-old males) were housed 3 mice per cage and injected with PBS in the absence or presence of rLIF at 80 μg/kg body weight i.p. twice daily for the indicated time frame, and food intake was measured. Every 3 days, 3 mice from each cohort were sacrificed, followed by harvesting and processing of the hypothalamus as described in the Methods. Aliquots (30 μg/lane) of pooled hypothalamic cell lysate (D) or individual mouse hypothalamic cell lysate (E) from 3 mice treated identically were subjected to IB analysis with the indicated antibodies as described in Methods. The unfilled circles represent the average food intake from the day the 3 mice from each cohort were sacrificed for hypothalamic processing. (A–E) These results were confirmed in 3 independent experiments. *P < 0.05, **P < 0.01, and ***P < 0.001 based on Student’s t test comparing rLIF-treated mice with PBS-treated mice at the indicated time (A–D).
Figure 5
Figure 5. LIF’s central effect persists with coadministration of leptin.
(A–C) Combination treatment of C57BL/6J mice with rLIF and leptin. On day –15, chow-fed C57BL/6J mice (11-week-old males) were injected i.p. with 100 μl PBS containing 80 μg/kg body weight rLIF twice daily for 15 days with average fat mass loss of ~30%–40% and weight loss of ~10%. On day 0, mice were randomized and housed 4 mice per cage and treated with 100 μl PBS in the absence or presence of 80 μg/kg body weight rLIF twice daily and/or 5 mg/kg leptin once daily for 9 days. ECHO MRI measurements of fat mass (B), body weight (C), and food intake (A) were measured at the indicated time points and are shown relative to the average day 0 reference value for each respective cohort. The average day 0 values for fat mass were 1.7, 1.7, 1.6, and 1.7 g and body weight were 22.1, 23.5, 21.5, and 23.1 g for the PBS, rLIF, rleptin, and rLIF plus rleptin cohorts, respectively. Each value represents dot plot with mean ± SEM (A) or mean ± SEM (BC) of 4 mice. (A–C) These results were confirmed in 2 independent experiments. *P < 0.05 and ***P < 0.001 based on Student’s t test (C) or P value based on use of Generalized Estimating Equation approach comparing multiple groups over time with rLIF + rleptin–treated mice as the reference value (A and B).
Figure 6
Figure 6. LIF induces a persistent decrease in body weight, adipose mass, and food intake in ob/ob mice.
(A–E) Chow-fed Lepob/J, ob/ob, mice (11-week-old males) were housed 4 mice per cage and injected i.p. with 100 μl PBS in the absence or presence of rLIF or rLIF K159A at 80 μg/kg body weight twice daily for 48 days (treatment) and subsequently followed for another 29 days (posttreatment) without injections. Body weight (A), food intake (D and E), and ECHO MRI measurements of fat mass (B) and lean mass (C) were measured at the indicated time points for 77 days. Body weight, fat mass, and lean mass are shown relative to the average day 0 reference value for each respective cohort. The average values for body weight (A) at day 0 were 39.5, 39.5, and 39.3 g for the PBS-, rLIF-, and rLIF K159A–treated mice, respectively. The average values for fat mass (B) at day 0 were 20.1, 20.6, and 20.9 g for the PBS-, rLIF-, and rLIF K159A–treated mice, respectively. The average values for lean mass (C) at day 0 were 16.7, 15.8, and 16.5 g for the PBS-, rLIF-, and rLIF K159A–treated mice, respectively. (F) Chow-fed Lepob/J, ob/ob, mice (10-week-old males) were housed 3 mice per cage and treated with PBS or rLIF as above for the indicated time interval, and food intake was measured. Every 3 days, 3 mice from each cohort were sacrificed, followed by harvesting and processing of the hypothalamus as described in the Methods. Aliquots (30 μg/lane) of pooled hypothalamic cell lysate from 3 mice treated identically were subjected to IB analysis with the indicated antibodies as described in Methods. The unfilled circles represent the average food intake from the day the 3 mice from each cohort were sacrificed for hypothalamic processing. (A–F) Each value represents mean ± SEM (A–C) or dot plots with mean ± SEM (D–F) of 3 mice (F) or 4 mice (A–E). These results were confirmed in 2 (F) or 3 independent experiments (A–E). *P < 0.05, **P < 0.01, and ***P < 0.001 based on Student’s t test comparing rLIF-treated mice with PBS- or rLIF K159A–treated mice over the respective time interval (D–F) or P value based on use of Generalized Estimating Equation approach with rLIF-treated mice as the reference value (A–C).
Figure 7
Figure 7. LIF induces central and noncentral effects in ob/ob mice.
(A–F) Chow-fed Lepob/J, ob/ob, mice (11-week-old males) were housed individually and injected i.p. with 100 μl PBS in the absence or presence of rLIF or rLIF K159A at 80 μg/kg body weight twice daily for 18 days throughout the experiment. PBS- and rLIF K159A–treated mice were either fed ad libitum or pair fed to the food intake of rLIF-treated mice fed ad libitum. Food intake (A), body weight (B), and ECHO MRI measurement of fat mass (C) were measured at the indicated time points. Body weight and fat mass are shown relative to the average day 0 reference value for each respective cohort. The average values for body weight (B) at day 0 were 44.5, 47.0, and 46.3 g for the PBS-, rLIF-, and rLIF K159A–treated mice fed ad libitum, respectively. The average day 0 values of body weight for the PBS- and rLIF K159A–treated mice pair fed were 45.9 and 46.0 g, respectively. The average values for fat mass (C) at day 0 were 25.4, 24.0, and 24.0 g for the PBS-, rLIF-, and rLIF K159A–treated mice fed ad libitum, respectively. The average day 0 values of fat mass (C) for the PBS- and rLIF K159A–treated mice pair fed were 24.5 and 25.6 g, respectively. Each value represents mean ± SEM of 4 mice. These results were confirmed in 2 independent experiments. ***P < 0.001 based on Student’s t test or P value based on use of Generalized Estimating Equation approach comparing multiple groups over time with rLIF-treated mice as the reference value (A–C).
Figure 8
Figure 8. LIF induces a persistent decrease in body weight, adipose mass, and food intake in db/db mice.
(A–D) Chow-fed Leprdb/J, db/db, mice (8-week-old males) were housed 4 mice per cage and injected i.p. with 100 μl PBS in the absence or presence of rLIF or rLIF K159A at 80 μg/kg body weight twice daily for 47 days (treatment) and subsequently followed for another 31 days (posttreatment) without injections. Body weight (A), food intake (B), and ECHO MRI measurements of fat mass (C) and lean mass (D) were measured at 9 a.m. at the indicated time points for 78 days. Body weight, fat mass, and lean mass are shown relative to the average day 0 reference value for each respective cohort. The average values for body weight (A) at day 0 were 35.8, 34.8, and 34.3 g for the PBS-, rLIF-, and rLIF K159A–treated mice, respectively. The average values for fat mass (C) at day 0 were 16.8, 16.7, and 16.9 g for the PBS-, rLIF-, and rLIF K159A–treated mice, respectively. The average values for lean mass (D) at day 0 were 16.1, 15.3, and 15.1 g for the PBS-, rLIF-, and rLIF K159A–treated mice, respectively. Each value represents mean ± SEM of 4 mice. These results were confirmed in 2 independent experiments. ***P < 0.001 based on Student’s t test (B) or P value based on use of Generalized Estimating Equation approach comparing multiple groups over time with rLIF-treated mice as the reference value (A, C, D).
Figure 9
Figure 9. Working model of LIF-induced adipose tissue loss and leptin’s response in cachexia.
(A) In normal homeostasis, leptin levels that are proportional to adipose mass are reached to maintain baseline hypothalamic pSTAT3, resulting in normophagia. (B) Cachexia factors work peripherally on adipose tissue and centrally with leptin on the hypothalamus to increase pSTAT3, resulting in hypophagia. (C) As body weight and adipose mass decrease in the setting of cachexia factors, there is a corresponding suppression of leptin secretion into serum, decreasing the extent of its hypothalamic signaling. Overall, the increase in cachexia factor signaling and the decrease in leptin signaling of the hypothalamus have a net effect of returning pSTAT3 back to baseline levels, normalizing food intake.

References

    1. Solheim TS, et al. Weight loss, appetite loss and food intake in cancer patients with cancer cachexia: three peas in a pod? - analysis from a multicenter cross sectional study. Acta Oncol. 2014;53(4):539–546. doi: 10.3109/0284186X.2013.823239. - DOI - PubMed
    1. Tisdale MJ. Cachexia in cancer patients. Nat Rev Cancer. 2002;2(11):862–871. doi: 10.1038/nrc927. - DOI - PubMed
    1. Evans WJ, et al. Cachexia: a new definition. Clin Nutr. 2008;27(6):793–799. doi: 10.1016/j.clnu.2008.06.013. - DOI - PubMed
    1. Anderson LJ, Albrecht ED, Garcia JM. Update on Management of Cancer-Related Cachexia. Curr Oncol Rep. 2017;19(1):3. doi: 10.1007/s11912-017-0562-0. - DOI - PubMed
    1. Zhou X, et al. Reversal of cancer cachexia and muscle wasting by ActRIIB antagonism leads to prolonged survival. Cell. 2010;142(4):531–543. doi: 10.1016/j.cell.2010.07.011. - DOI - PubMed

Publication types

MeSH terms