Meta-Analysis
. 2018 Jul 25;8(1):11209.
doi: 10.1038/s41598-018-29329-2.

Determination of system level alterations in host transcriptome due to Zika virus (ZIKV) Infection in retinal pigment epithelium

Affiliations
Meta-Analysis

Determination of system level alterations in host transcriptome due to Zika virus (ZIKV) Infection in retinal pigment epithelium

Pawan Kumar Singh et al. Sci Rep. .

Abstract

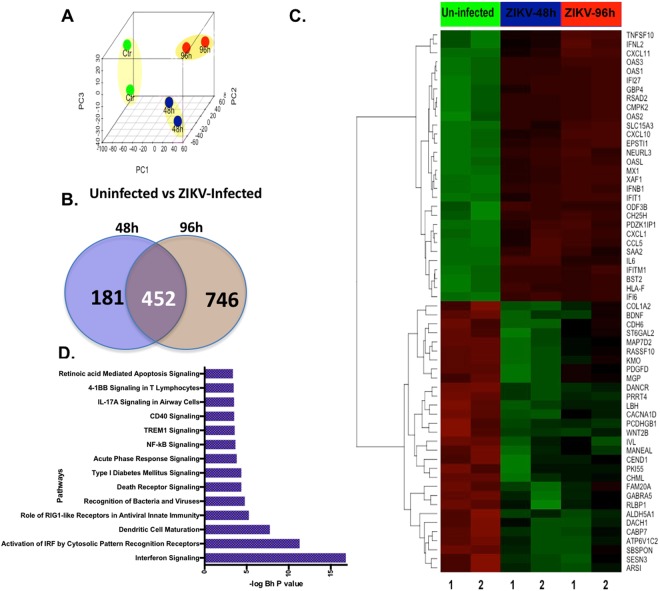
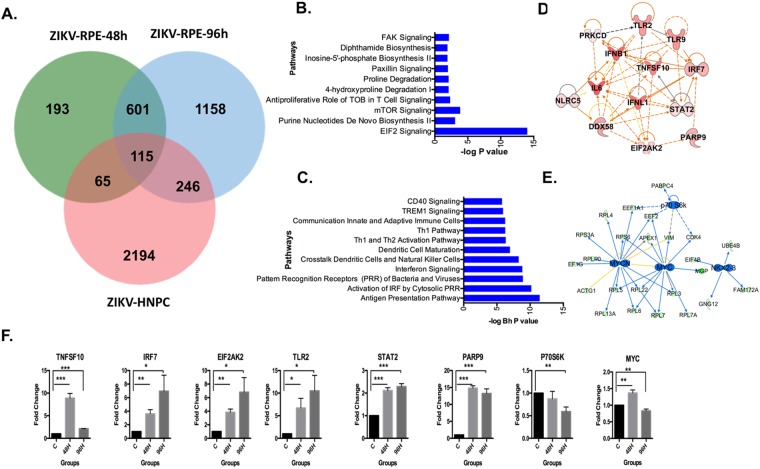
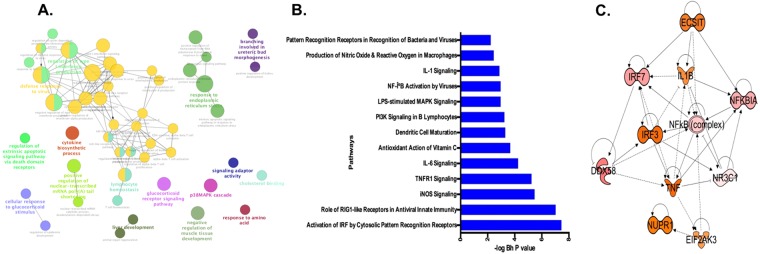
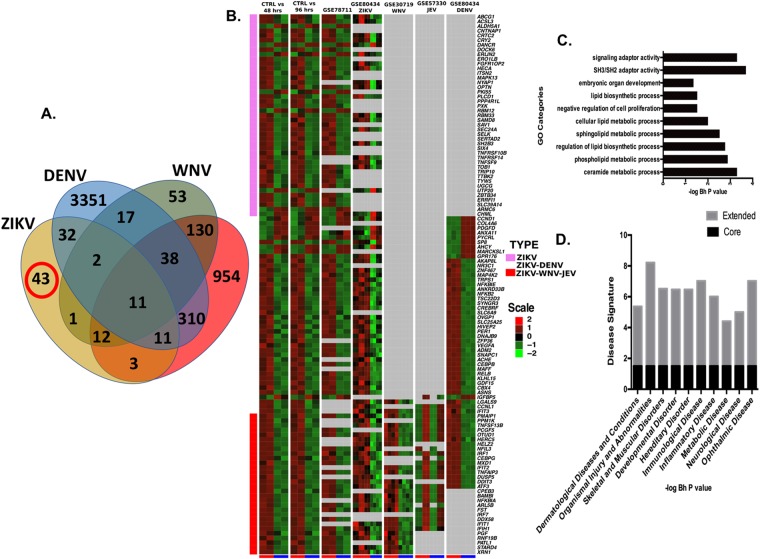
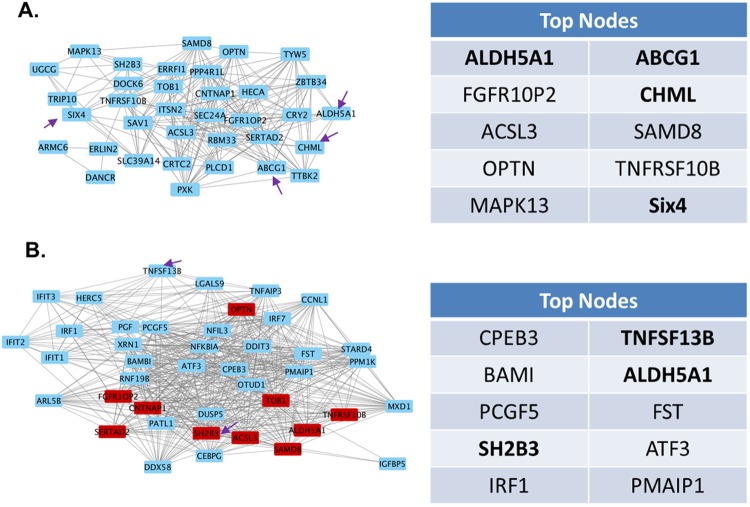
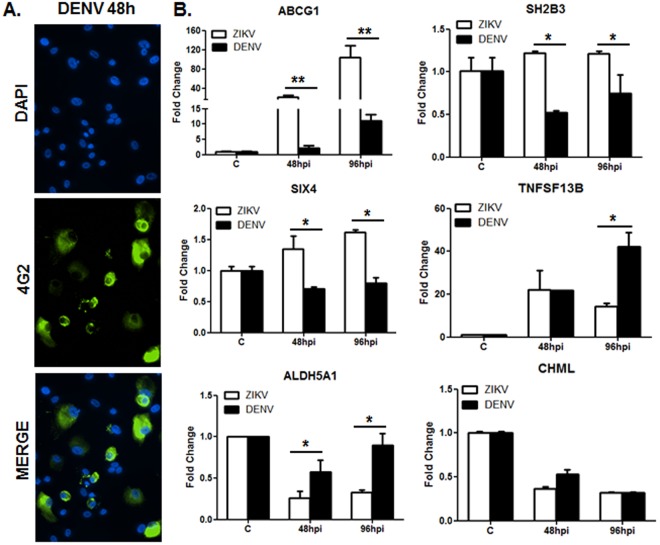
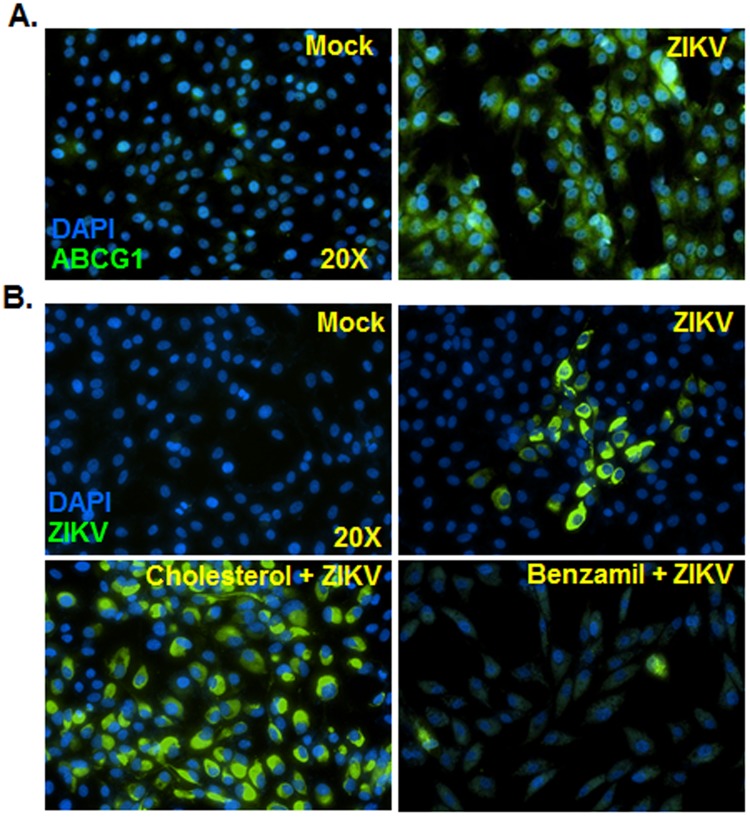
Previously, we reported that Zika virus (ZIKV) causes ocular complications such as chorioretinal atrophy, by infecting cells lining the blood-retinal barrier, including the retinal pigment epithelium (RPE). To understand the molecular basis of ZIKV-induced retinal pathology, we performed a meta-analysis of transcriptome profiles of ZIKV-infected human primary RPE and other cell types infected with either ZIKV or other related flaviviruses (Japanese encephalitis, West Nile, and Dengue). This led to identification of a unique ZIKV infection signature comprising 43 genes (35 upregulated and 8 downregulated). The major biological processes perturbed include SH3/SH2 adaptor activity, lipid and ceramide metabolism, and embryonic organ development. Further, a comparative analysis of some differentially regulated genes (ABCG1, SH2B3, SIX4, and TNFSF13B) revealed that ZIKV induced their expression relatively more than dengue virus did in RPE. Importantly, the pharmacological inhibition of ABCG1, a membrane transporter of cholesterol, resulted in reduced ZIKV infectivity. Interestingly, the ZIKV infection signature revealed the downregulation of ALDH5A1 and CHML, genes implicated in neurological (cognitive impairment, expressive language deficit, and mild ataxia) and ophthalmic (choroideremia) disorders, respectively. Collectively, our study revealed that ZIKV induces differential gene expression in RPE cells, and the identified genes/pathways (e.g., ABCG1) could potentially contribute to ZIKV-associated ocular pathologies.


Conflict of interest statement

The authors declare no competing interests.

Figures

Figure 1
Figure 1
Overview of analytical meta-analysis approach to understand the molecular mechanism of ZIKV Infection. The comparative analysis of transcriptome alterations due to ZIKV infection in different cell types were performed to identify a meta-signature of ZIKV infection (left top). Furthermore, to identify the core set of genes unique to ZIKV infection, we also performed a comparative analysis of the ZIKV transcriptome with transcriptomes of DENV, WNV, and JEV (right middle). The genes only in the ZIKV extended set and not the other transcriptome comprise the ZIKV-core signature (middle right). Both the ZIKV extended and core-signature genes were evaluated by regulatory pathway and gene ontology analysis (bottom).
Figure 2
Figure 2
ZIKV PRVABC59 permissively infects human primary RPE cells. Human primary RPE cells were challenged with ZIKV (strain PRVABC59, PR 2015, MOI of 1) for the indicated time points; uninfected cells served as control (Mock). Control and ZIKV-infected cells were subjected to immunostaining for anti-flavivirus group antigen 4G2, and representative images show the presence of ZIKV (red) and DAPI (blue, a nuclear stain). Image magnifications 20X.
Figure 3
Figure 3
Transcriptome landscape of alterations in human primary RPE cells after ZIKV infection. (A) Unsupervised analysis of transcriptome profile of uninfected (Ctr), and ZIKV virus-infected primary RPE cells at 48 and 96 hrs post-infection, (B) Venn diagram depicting comparison of ZIKV-altered genes at 48 h and 96 h post-infection, (C) Heatmap of top altered genes due to ZIKV infection, and (D) Pathway analysis on genes significantly upregulated (>2 fold) in ZIKV-infected RPE cells. In the heatmap, columns represent the samples and rows represent the genes. Gene expression is shown with pseudocolor scale (−3 to 3) with red denoting high expression level and green denoting low expression level of a gene.
Figure 4
Figure 4
Primary retinal cell-specific ZIKV infection transcriptome signature. (A) Venn diagram comparing differentially expressed genes due to ZIKV infection of human primary RPE cells at 48 and 96 hrs and human neural progenitors cells (hNPC), (B) Pathways down-regulated due to ZIKV infection in RPE cells, (C) Pathways up-regulated due to ZIKV infection in RPE cells and key regulators that are activated (D) and inhibited (E) by ZIKV infection in RPE cells. The significance of effect on pathways was calculated using the Fisher exact test and shown as −log (P value) along the x-axis. The activated and inhibited key regulators are shown with orange and blue colors respectively. (F) Validation of key regulators altered by ZIKV infection in primary RPE cells. Uninfected control and ZIKV-infected human primary RPE cells were subjected to qRT-PCR analysis. Graphs represent the statistical analyses of relative mRNA levels after normalization to β-actin levels. Data shown here are mean ± SEM (standard error of the mean) from three independent experiments. *P < 0.09, **P < 0.05, and ***P < 0.01.
Figure 5
Figure 5
Transcriptional meta-signature associated with ZIKV infection. (A) Gene ontology clusters associated with ZIKV meta-signature. Dysregulated genes of multiple biological processes related to defense response against viruses and the type I interferon response. (B) Pathways are significantly dysregulated by ZIKV infection in multiple cell types. The significance of effect on pathways was estimated by one-tailed Fisher exact test. (C) Key transcriptional regulators significantly activated in ZIKV meta-signature.
Figure 6
Figure 6
Identification of ZIKV infection-associated “Core transcriptional signature.” (A) Comparative analysis of ZIKV meta-signatures and other flavivirus transcriptomes using Venn diagram, (B) Heatmap of ZIKV core genes (pink sidebar) and genes overlapping with other neurological disease-causing viruses signatures (red sidebar). The middle part of the heatmap contains genes shared with other viruses. Columns represent different datasets used for identifying the ZIKV core signature (Blue at bottom: Normal and Red: Infected), and rows represent genes. Gene expression is shown with pseudocolor scale (−2 to 2) with red denoting high expression and green denoting low expression of a gene. (C) Gene ontology processes with enriched genes from the ZIKV core set. (D) Disease set with significant over-representation of the ZIKV core signature (Raw P-value < 0.01).
Figure 7
Figure 7
Identification of key regulators associated with ZIKV infection based on interactive network analysis. (A) Co-expression based interactive network of ZIKV-associated core signature. The topological analysis of the interactive network identified top 10 key regulators critical for the stability of the ZIKV infection-related interactive network. Each node represents a gene, and edges represent co-expression-based interactions. (B) Co-expression-based interactive network shows the interaction of top 10 key regulators from the ZIKV core network (red color) with the extended set of genes associated with ZIKV infection. The side panel lists the top 10 key regulators associated with ZIKV infection. CHML and ALDH5A1 are two key molecules significantly associated with stability of the ZIKV network prepared from the ZIKV core and the extended sets of genes.
Figure 8
Figure 8
Comparative analysis of ZIKV and DENV in modulating meta-analysis-predicted genes in RPE cells. Human primary RPE cells were challenged with ZIKV or DENV, type 2, at MOI of 1 for the indicated time points; uninfected cells served as control. (A) DENV-infected cells were immunostained for anti-flavivirus group antigen 4G2 (image magnification 20X). (B) Expression of key regulator genes was assessed by qRT-PCR. Graphs show the statistical analyses of relative mRNA levels after normalization using β-actin. Results are expressed as mean ± S.D. of three independent experiments, *P < 0.05, **P < 0.005.
Figure 9
Figure 9
Pharmacological inhibition of ABCG1 attenuated ZIKV infectivity in RPE cells. Human primary RPE cells were challenged with ZIKV, and expression of ABCG1 was determined by immunostaining (A). In another set of experiments, RPE cells were pretreated with a pharmacological inhibitor of ABCG1, Benzamil (50 µM), or supplemented with cholesterol (10 µM) followed by infection with ZIKV (MOI of 1) for 48 h. ZIKV infectivity was assessed by anti-flavivirus group antigen 4G2 immunostaining (B). Results are representative of two independent experiments. Image magnifications 20X.

References

    1. Song, B. H., Yun, S. I., Woolley, M. & Lee, Y. M. Zika virus: History, epidemiology, transmission, and clinical presentation. Journal of neuroimmunology, 10.1016/j.jneuroim.2017.03.001 (2017). - PubMed
    1. Ribeiro LS, Marques RE, Jesus AM, Almeida RP, Teixeira MM. Zika crisis in Brazil: challenges in research and development. Curr Opin Virol. 2016;18:76–81. doi: 10.1016/j.coviro.2016.04.002. - DOI - PubMed
    1. Panchaud A, Stojanov M, Ammerdorffer A, Vouga M, Baud D. Emerging Role of Zika Virus in Adverse Fetal and Neonatal Outcomes. Clin Microbiol Rev. 2016;29:659–694. doi: 10.1128/CMR.00014-16. - DOI - PMC - PubMed
    1. Araujo, A. Q., Silva, M. T. & Araujo, A. P. Zika virus-associated neurological disorders: a review. Brain, 10.1093/brain/aww158 (2016). - PubMed
    1. Abbasi AU. Zika Virus Infection; Vertical Transmission and Foetal Congenital Anomalies. J Ayub Med Coll Abbottabad. 2016;28:1–2. - PubMed

Publication types

MeSH terms

Substances