. 2018 Jul 25;8(1):11185.
doi: 10.1038/s41598-018-29078-2.

Differential regulation of the Wnt/β-catenin pathway by hepatitis C virus recombinants expressing core from various genotypes

Affiliations

Differential regulation of the Wnt/β-catenin pathway by hepatitis C virus recombinants expressing core from various genotypes

Stephanie Aicher et al. Sci Rep. .

Abstract

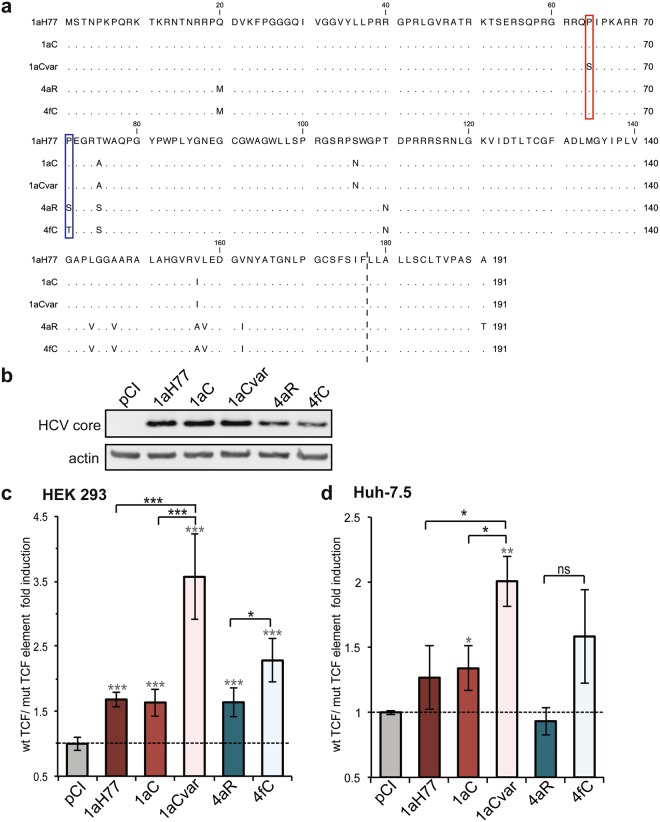
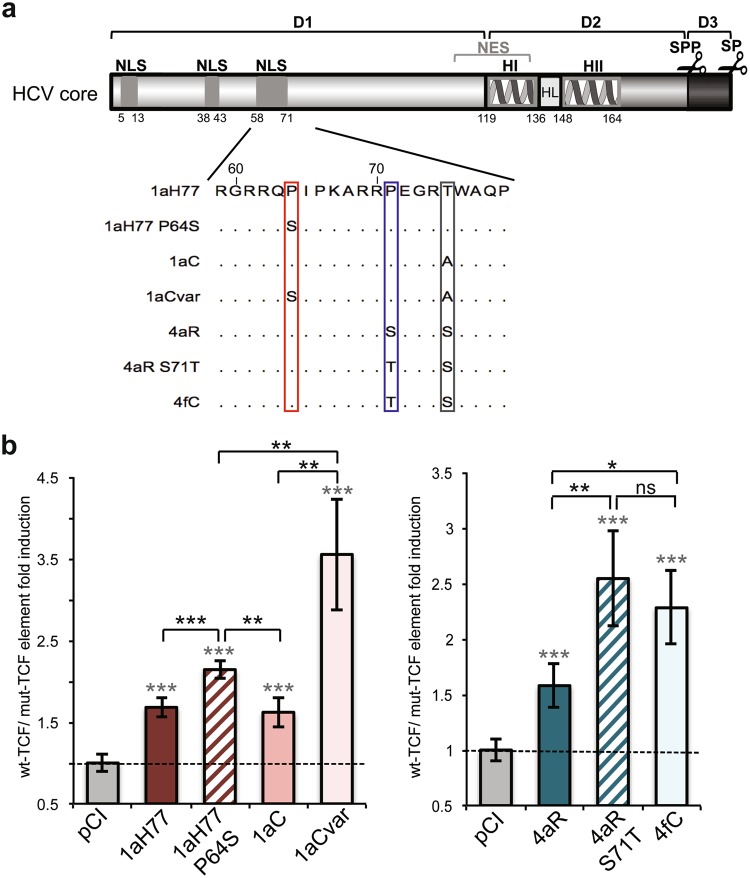
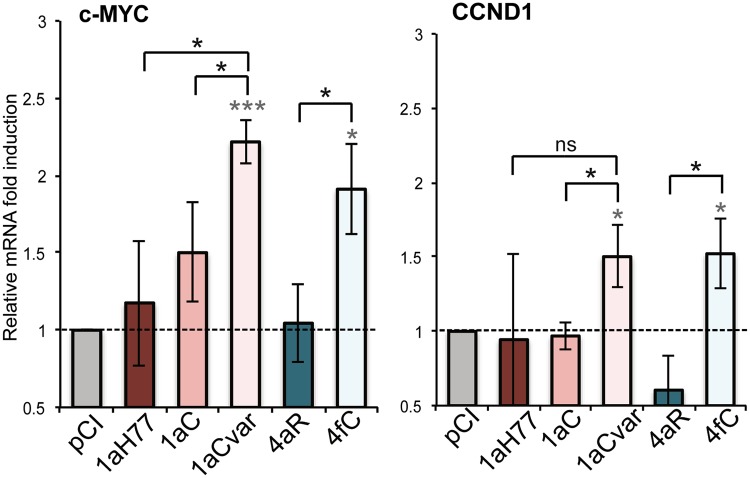
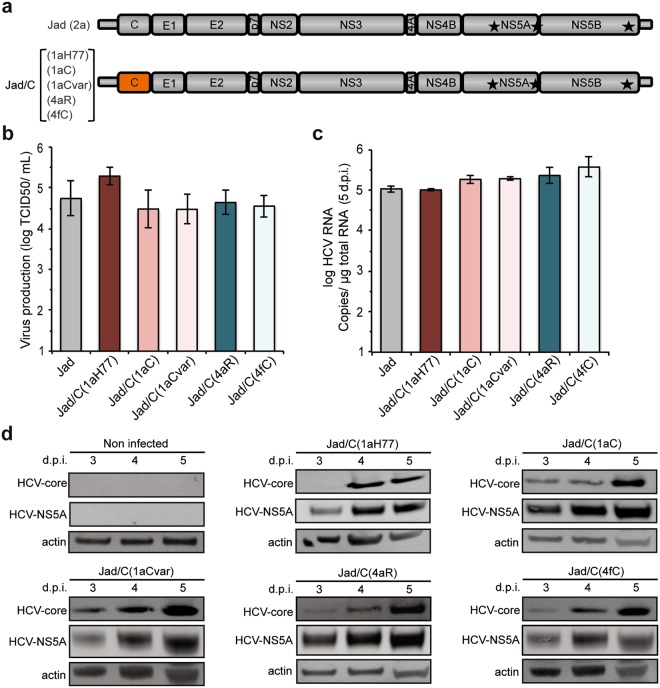
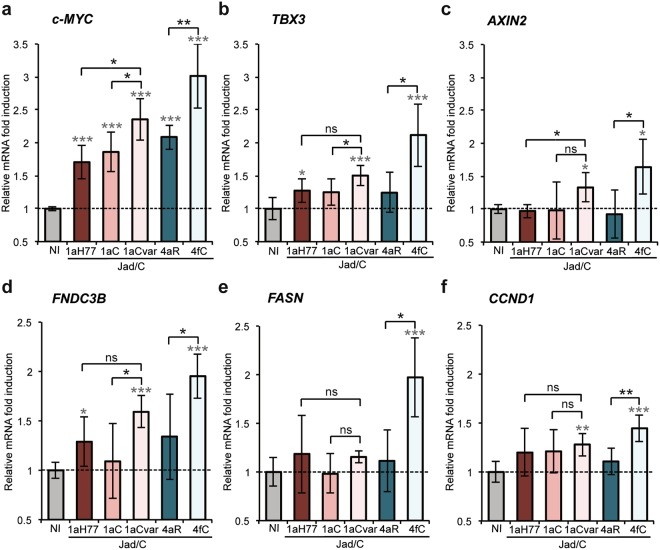
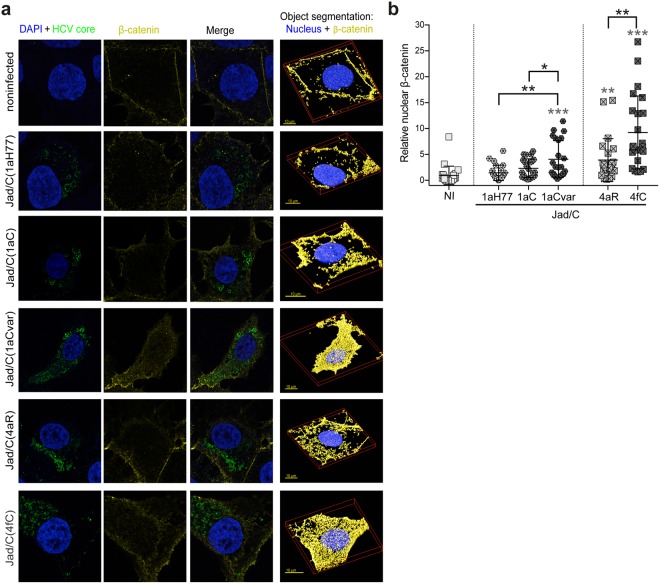
Clinical studies have suggested association of some hepatitis C virus (HCV) subtypes or isolates with progression toward hepatocellular carcinoma (HCC). HCV core protein has been reported to interfere with host Wnt/β-catenin pathway, a cell fate-determining pathway, which plays a major role in HCC. Here, we investigated the impact of HCV core genetic variability in the dysregulation of Wnt/β-catenin pathway. We used both transient expression of core proteins from clinical isolates of HCV subtypes 1a (Cambodia), 4a (Romania) and 4f (Cameroon) and infection systems based on a set of engineered intergenotypic recombinant viruses encoding core from these various clinical strains. We found that TCF transcription factor-dependent reporter activity was upregulated by core in a strain-specific manner. We documented core sequence-specific transcriptional upregulation of several β-catenin downstream target genes associated with cell proliferation and malignant transformation, fibrogenesis or fat accumulation. The extent of β-catenin nuclear translocation varied in accordance with β-catenin downstream gene upregulation in infected cells. Pairwise comparisons of subgenotypic core recombinants and mutated core variants unveiled the critical role of core residues 64 and 71 in these dysregulations. In conclusion, this work identified natural core polymorphisms involved in HCV strain-specific activation of Wnt/β-catenin pathway in relevant infection systems.


Conflict of interest statement

The authors declare no competing interests.

Figures

Figure 1
Figure 1
Effect of HCV core genetic variability on TCF-element dependent transcriptional activity. (a) An amino acid sequence alignment of core proteins from the indicated genotypes and isolates is shown with respect to HCV 1aH77 core. Dots represent identical residues. The dotted line indicates the putative C-terminus of mature core proteins according to the known 2a-JFH1 core C-terminal residue following removal of the C-terminal hydrophobic sequence by signal peptide peptidase. Red and blue boxes point to unique amino acid differences between mature core proteins of 1aC/1aCvar and 4aR/4fC variants, respectively. (b) HCV core expression was assessed in transiently transfected cells using anti-core and control anti-actin antibodies (pCI: empty DNA vector; full-length image of corresponding immunoblot can be found in the Supplementary information: Supplementary Fig. 5). HEK293 (c) or Huh-7.5 (d) cells were transfected with core expressing DNAs or pCI vector and either pTOP (wild-type [wt]) or pFOP (mutated [mut]) TCF element reporter DNAs. Relative wt/mut TCF element FLuc ratios are represented [means ± SD of quintuplicates obtained in 3 independent experiments (c) or of triplicates obtained in 2 independent experiments (d)]. The dotted lines indicate thresholds obtained in the absence of any core expression (pCI). Statistical analyses with respect to values obtained in pCI-transfected cells are indicated by grey stars above each bar (when significant), while statistical analyses between two related variants are indicated in black characters above brackets and are coded as follows: P < 0.05 (*), P < 0.005 (**), P < 0.001 (***), non-significant, P ≥ 0.05 (ns).
Figure 2
Figure 2
Involvement of residues at position 64 and 71 of HCV core in the modulation of TCF-element activation. (a) HCV core is schematically represented with its subdomains (D1, D2, D3) including predicted or experimentally-demonstrated nuclear localization signals (NLS), nuclear export signals (NES), alpha-helices (H), loop between alpha-helices (HL), and location of cleavage by cellular signal peptidase (SP) and signal peptide peptidase (SPP) (scissors). Numbering below the scheme corresponds to amino acid position framing each element in core. An alignment of core sequences from clinical isolates and engineered mutant derivatives 1aH77 P64S and 4aR S71T is shown in the blown-up below. Amino acid differences are boxed. (b,c) Relative TCF element activation in HEK293 cells expressing natural or engineered core variants and statistical analyses were established and represented as described in Fig. 1 caption (means ± SD of quintuplicates obtained in 3 independent experiments).
Figure 3
Figure 3
Involvement of HCV core in the induction of Wnt/β-catenin downstream genes in a variant-specific manner. mRNA levels of the genes indicated at the top of the graphs were quantified following reverse transcription and real-time quantitative PCR in HEK293 cells transfected with HCV core-expressing DNAs, then normalized with respect to housekeeping genes and expressed relatively to respective target mRNAs in pCI-transfected cells, set at 1 (means ± SD of 3 independent experiments). Statistical analyses are as described in Fig. 1 caption.
Figure 4
Figure 4
Generation and characterization of intergenotypic core recombinant viruses. (a) Schematic representation of intergenotypic Jad(2a) recombinant cDNAs encoding core of the indicated genotypes and strains. (b) Infectious titers obtained at 3 days post-transfection with intergenotypic core recombinant RNAs (means ± SD of 4 transfections). (c) Intergenotypic chimeric RNA abundance was quantified in infected Huh-7.5 cells at 5 days post-infection by reverse transcription-quantitative PCR (means ± SD of 2 experiments). (d) Viral protein expression was monitored in infected Huh-7.5 cells at 3, 4, and 5 days post-infection using anti-HCV core and anti-HCV NS5A antibodies, as well as control anti-actin antibodies. Full-length images of corresponding immunoblots can be found in the Supplementary information (Supplementary Fig. 6).
Figure 5
Figure 5
Transcriptional regulation of Wnt/β-catenin pathway downstream genes in infected cells. Following infection with the indicated viruses, levels of c-MYC (a), TBX3 (b), AXIN2 (c), FNDC3B (d), FASN (e) and CCND1 (f) mRNAs quantified at 5 days post-infection were normalized with respect to housekeeping genes and expressed with respect to the relative abundance of respective mRNAs in non infected (NI) cells, set at 1. Means ± SD of sextuplicates obtained in 4 independent experiments. Statistical analyses are as described in Fig. 1 caption.
Figure 6
Figure 6
Strain-specific, core-dependent nuclear translocation of β-catenin in infected cells. (a) Huh-7.5 cells infected with the indicated viruses or noninfected cells were labeled for nucleus (DAPI, blue) and core (green), as well as for β-catenin (yellow). Merged deconvolved images and representative 3D segments used for object segmentation (nuclei and β-catenin, right images) are shown. (b) Images were subjected to object analysis (co-localization intersection) using Huygens Professional software and intersecting volumes between β-catenin and nucleus were quantified per cell. Intersecting voxels (means and distribution among 23 cells per condition, each cell being represented by a symbol) were expressed relatively to intersecting voxels found in noninfected cells set at 1. Statistical analyses with respect to values obtained in noninfected cells are indicated above each group of virus-infected cells (in grey characters), while statistical analyses between two related variants are indicated in black characters above brackets. These statistical analyses were performed according to the Holm-Sidak method and are coded as follows: P < 0.05 (*), P < 0.005 (**), P < 0.001 (***).

References

    1. Bandiera S, Billie Bian C, Hoshida Y, Baumert TF, Zeisel MB. Chronic hepatitis C virus infection and pathogenesis of hepatocellular carcinoma. Curr Opin Virol. 2016;20:99–105. doi: 10.1016/j.coviro.2016.09.010. - DOI - PMC - PubMed
    1. Wirth TC, Manns MP. The impact of the revolution in hepatitis C treatment on hepatocellular carcinoma. Ann Oncol. 2016;27:1467–1474. doi: 10.1093/annonc/mdw219. - DOI - PubMed
    1. Lin MV, King LY, Chung RT. Hepatitis C virus-associated cancer. Annu Rev Pathol. 2015;10:345–370. doi: 10.1146/annurev-pathol-012414-040323. - DOI - PubMed
    1. Moradpour D, Penin F. Hepatitis C virus proteins: from structure to function. Curr Top Microbiol Immunol. 2013;369:113–142. - PubMed
    1. Kotta-Loizou I, et al. Expression of the novel hepatitis C virus core+1/ARF protein in the context of JFH1-based replicons. J Virol. 2015;89:5164–5170. doi: 10.1128/JVI.02351-14. - DOI - PMC - PubMed

Publication types

MeSH terms