. 2018 Aug;560(7716):97-101.
doi: 10.1038/s41586-018-0354-1. Epub 2018 Jul 25.

Differential tuning of excitation and inhibition shapes direction selectivity in ferret visual cortex

Affiliations

Differential tuning of excitation and inhibition shapes direction selectivity in ferret visual cortex

Daniel E Wilson et al. Nature. 2018 Aug.

Abstract

To encode specific sensory inputs, cortical neurons must generate selective responses for distinct stimulus features. In principle, a variety of factors can contribute to the response selectivity of a cortical neuron: the tuning and strength of excitatory1-3 and inhibitory synaptic inputs4-6, dendritic nonlinearities7-9 and spike threshold10,11. Here we use a combination of techniques including in vivo whole-cell recording, synaptic- and cellular-resolution in vivo two-photon calcium imaging, and GABA (γ-aminobutyric acid) neuron-selective optogenetic manipulation to dissect the factors that contribute to the direction-selective responses of layer 2/3 neurons in ferret visual cortex (V1). Two-photon calcium imaging of dendritic spines12,13 revealed that each neuron receives a mixture of excitatory synaptic inputs selective for the somatic preferred or null direction of motion. The relative number of preferred- and null-tuned excitatory inputs predicted a neuron's somatic direction preference, but failed to account for the degree of direction selectivity. By contrast, in vivo whole-cell patch-clamp recordings revealed a notable degree of direction selectivity in subthreshold responses that was significantly correlated with spiking direction selectivity. Subthreshold direction selectivity was predicted by the magnitude and variance of the response to the null direction of motion, and several lines of evidence, including conductance measurements, demonstrate that differential tuning of excitation and inhibition suppresses responses to the null direction of motion. Consistent with this idea, optogenetic inactivation of GABAergic neurons in layer 2/3 reduced direction selectivity by enhancing responses to the null direction. Furthermore, by optogenetically mapping connections of inhibitory neurons in layer 2/3 in vivo, we find that layer 2/3 inhibitory neurons make long-range, intercolumnar projections to excitatory neurons that prefer the opposite direction of motion. We conclude that intracortical inhibition exerts a major influence on the degree of direction selectivity in layer 2/3 of ferret V1 by suppressing responses to the null direction of motion.


Conflict of interest statement

Competing financial interests

The authors declare no competing financial interests.

Figures

Extended Data 1:
Extended Data 1:. Summed spine inputs fail to predict somatic direction selectivity, regardless of the method used to compute the sum
a, No significant correlation between the DSI of summed spine inputs (with amplitude included) and somatic DSI. Spearman’s r = −.11, P = .68, n = 17. b, No significant correlation between the fraction of spines that respond more strongly to the preferred direction and somatic DSI. Spearman’s r = −.082, P = .75, n = 17.
Extended Data Figure 2:
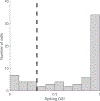
Extended Data Figure 2:. Distribution of spiking DSI
Dashed line indicates cutoff of DSI>.3; n = 69 cells with spiking responses.
Extended Data Figure 3:
Extended Data Figure 3:. Example of noise suppression at null stimulus relative to blank
Extended Data Figure 4:
Extended Data Figure 4:. Direction tuning fits for excitatory and inhibitory conductances
a, Difference in direction preference of excitation and inhibition are significantly greater than chance; Monte Carlo significance test, p=.023; difference in direction preference, 135±95 degrees, median ± IQR, n = 10 cells from 7 animals. b, FWHM (full width half-max) of excitation and inhibition were not significantly different. FWHM 61±46 and 61±110 degrees for excitation and inhibition, respectively, median ± IQR, n=10, Wilcoxon Sign-Rank (WSR) P = .70. c, individual (grey) and population average (colored) tuning curves for Ge, Gi, and predicted Vm, peak-aligned to excitation
Extended Data Figure 5:
Extended Data Figure 5:. I/E ratio at preferred direction is not correlated with simulated subthreshold direction selectivity
Spearman’s r = .0061, P = 1, n = 10 cells from 7 animals
Extended Data Figure 6:
Extended Data Figure 6:. Putative GABAergic neuron directly suppressed by blue light
Error bars are mean ± SEM
Extended Data Figure 7:
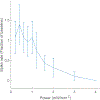
Extended Data Figure 7:. Additional data related to blue light photoinhibition of GABAergic neurons
a, Optogenetically suppressing GABAergic neurons significantly reduces spiking direction selectivity; WSR, n = 14 cells with spiking responses, P = .0049. Black line is mean and grey lines are single cells. b, absolute Vm depolarization induced by blue light is not related to optogenetic changes in Vm direction selectivity (computed as the difference in DSI between light off and light on conditions); Spearman’s r = .11, P = .70, n = 14 cells with spiking responses from 4 animals
Extended Data Figure 8:
Extended Data Figure 8:. Alignment of GABAergic neurons with intrinsic signal polar direction map
a, Underlying intrinsic signal polar direction map with direction-tuned GABAergic neurons overlaid. b, Direction preferences of inhibitory neurons and intrinsic signal direction preference map are significantly more similar than chance; p<.001, Monte Carlo significance test, n = 76 direction-selective neurons from 3 planes in 1 animal.
Extended Data Figure 9:
Extended Data Figure 9:. Reversal potential of optogenetically evoked PSPs is consistent with inhibition
Grey points are individual data points; black is mean ± SEM. Data come from individual stimulation trials from one cell.
Extended Data Figure 10:
Extended Data Figure 10:. Relationship of IPSP amplitude versus distance
Grey points are individual data points; black is binned mean ± SEM. Data come from trial-averaged stimulation responses from n = 21 cells from 7 animals
Figure 1:
Figure 1:. Direction tuning of excitatory synaptic inputs onto layer 2/3 neurons in ferret V1
a, Example soma tuning; data are mean ± s.e.m.; scale bar is 10 μm. b, (left) Example dendritic spines (n = 11) pseudocolored for direction preference; scale bar is 10 μm; (right) Spine trial averaged responses to somatic preferred or null directions. c, Trial averaged responses for all significantly responsive spines (n = 62) from cell in a. d, DSI distributions for preferred (n = 384) and null (n = 233) directions tuned spines. e, Fraction of spines on direction-selective cells (n = 12) preferring somatic preferred and null directions. f, Relationship between somatic DSI and summed spine DSI (n = 17 cells from 10 animals).
Figure 2:
Figure 2:. Subthreshold direction selectivity and evidence for null direction suppression
a, Example direction tuning of subthreshold Vm (grey) and spiking responses (black). b, Example single trial responses. c, Distribution of Vm DSI for 54 cells with direction-selective spiking (DSI > 0.3). d, No relationship between preferred direction response and Vm DSI (n = 76 from 23 animals). e, Relationship between null direction response and Vm DSI; gray line is least-squares fit (n = 76). f, No relationship between preferred direction Vm noise (trial-to-trial variability) and Vm DSI (n = 76). g, Relationship between null direction Vm noise and Vm DSI; gray line is least-squares fit (n = 76).
Figure 3:
Figure 3:. Differential tuning between excitation and inhibition enhances direction selectivity
a, Estimated excitatory (blue, Ge) and inhibitory (red, Gi) synaptic conductances driven by gratings from an example cell; line is bootstrapped mean and error bars are bootstrapped s.d.. b, Tuning of peak (see Methods) synaptic conductances and predicted Vm (dashed line) for cell in a; data are bootstrapped mean and s.d.. c, Comparison of Ge and Gi DSI (n = 10 from 7 animals). d, Predicted Vm DSI (see Methods) compared to Ge DSI (n = 10). e, Comparison of Gi/Ge at null and preferred directions (n = 10). f, Predicted Vm DSI compared to null direction Gi/Ge; gray line is least-squares fit (n = 10). g, Example Vm during visual stimulation and inactivation of GABAergic neurons expressing GtACR2 (cyan) or without inactivation (black); dashed line is resting Vm. h, Comparison of Vm DSI with and without inactivation; black line indicates population means (n = 16 from 4 animals). i, Optogenetic modulation of preferred direction response versus Vm DSI (n = 16). j, Optogenetic modulation of null direction response versus Vm DSI; gray line is least-squares fit (n = 16).
Figure 4:
Figure 4:. Inhibitory interneurons make long-range, intercolumnar projections onto excitatory neurons
a, Epifluorescence image of injection site with GABAergic-axon imaging sites highlighted; example FOV in red. b, Intrinsic signal polar direction map for a. c, Example bouton FOV. d, GABAergic boutons overlaid on direction preference map; direction preference of boutons and intrinsic signal pseudocolored as in b.; bi-directional boutons colored grey. e, example bouton tuning curve (box in d); data are mean ± s.e.m.. f, Distribution of direction preference difference between GABAergic boutons (n = 493) and corresponding intrinsic signal direction preference map; g, Top: FLAG staining of cells expressing AAV1-mDlx-ChR2-FLAG-Kv2.1-p2a-H2b-CyRFP; Bottom: Experimental design: neurons in different cortical columns are optogenetically activated. h, Example of single spot illumination and Vm responses. i, Mean IPSP waveforms evoked by sampled spots. j, Map of IPSP amplitudes. k, Distribution of IPSP-field major axis lengths across cells (n = 21). l, Example aligned stimulation grid to intrinsic signal polar direction map. m, Peak-aligned average direction tuning curve for cells with direction-tuned membrane potential (DSI > 0.3, black, individual cells in grey, n = 7). n, Fraction of spots tuned to a cell’s preferred (<45°) or null (>135°) direction (gray bars are mean ± s.e.m.), o, Cartoon model of co-tuning (top) and differential tuning (bottom) of excitation (Ge) and inhibition (Gi) for direction. Subthreshold direction selectivity is inherited from synaptic conductances when co-tuned. Differential tuning of Ge and Gi, whereby there is greater Gi/Ge at the null direction, can preferentially suppress excitation and enhance subthreshold selectivity. With differential tuning, inhibition can either be bidirectional or oppositely tuned for direction relative to Ge.

References

Main References

    1. Cossell L et al. Functional organization of excitatory synaptic strength in primary visual cortex. Nature 518, 399–403, doi:10.1038/nature14182 (2015). - DOI - PMC - PubMed
    1. Ko H et al. Functional specificity of local synaptic connections in neocortical networks. Nature 473, 87–91, doi:10.1038/nature09880 (2011). - DOI - PMC - PubMed
    1. Lee WC et al. Anatomy and function of an excitatory network in the visual cortex. Nature 532, 370–374, doi:10.1038/nature17192 (2016). - DOI - PMC - PubMed
    1. Tan AY, Brown BD, Scholl B, Mohanty D & Priebe NJ Orientation selectivity of synaptic input to neurons in mouse and cat primary visual cortex. The Journal of neuroscience : the official journal of the Society for Neuroscience 31, 12339–12350, doi:10.1523/JNEUROSCI.2039-11.2011 (2011). - DOI - PMC - PubMed
    1. Monier C, Chavane F, Baudot P, Graham LJ & Fregnac Y Orientation and direction selectivity of synaptic inputs in visual cortical neurons: a diversity of combinations produces spike tuning. Neuron 37, 663–680 (2003). - PubMed

Methods References

    1. Dimidschstein J et al. A viral strategy for targeting and manipulating interneurons across vertebrate species. Nature neuroscience 19, 1743–1749, doi:10.1038/nn.4430 (2016). - DOI - PMC - PubMed
    1. Govorunova EG, Sineshchekov OA, Janz R, Liu X & Spudich JL NEUROSCIENCE. Natural light-gated anion channels: A family of microbial rhodopsins for advanced optogenetics. Science 349, 647–650, doi:10.1126/science.aaa7484 (2015). - DOI - PMC - PubMed
    1. Peirce JW PsychoPy--Psychophysics software in Python. Journal of neuroscience methods 162, 8–13, doi:10.1016/j.jneumeth.2006.11.017 (2007). - DOI - PMC - PubMed
    1. Pologruto TA, Sabatini BL & Svoboda K ScanImage: flexible software for operating laser scanning microscopes. Biomedical engineering online 2, 13, doi:10.1186/1475-925X-2-13 (2003). - DOI - PMC - PubMed
    1. Baker CA, Elyada YM, Parra A & Bolton MM Cellular resolution circuit mapping with temporal-focused excitation of soma-targeted channelrhodopsin. eLife 5, doi:10.7554/eLife.14193 (2016). - DOI - PMC - PubMed

Publication types