. 2018 Aug;560(7717):238-242.
doi: 10.1038/s41586-018-0363-0. Epub 2018 Jul 25.

Mitochondrial double-stranded RNA triggers antiviral signalling in humans

Affiliations

Mitochondrial double-stranded RNA triggers antiviral signalling in humans

Ashish Dhir et al. Nature. 2018 Aug.

Abstract

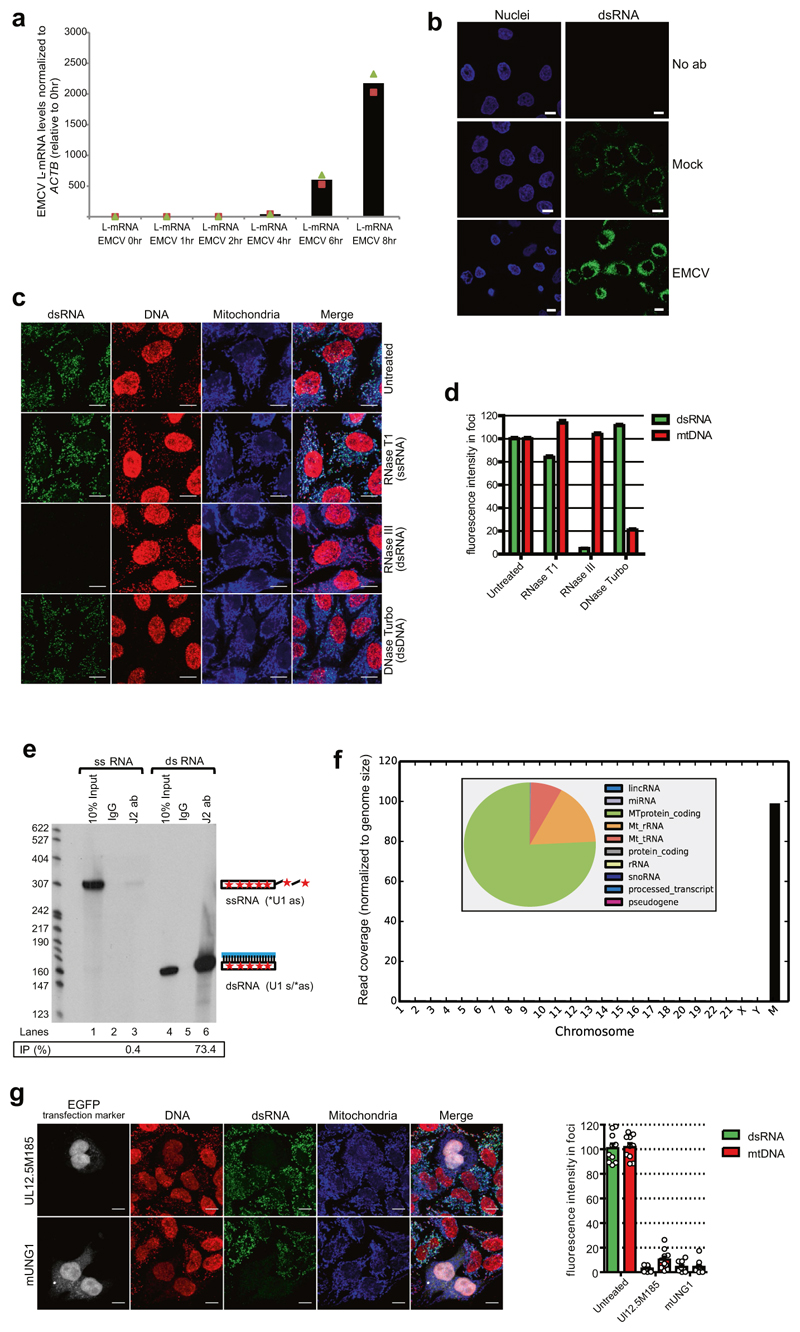
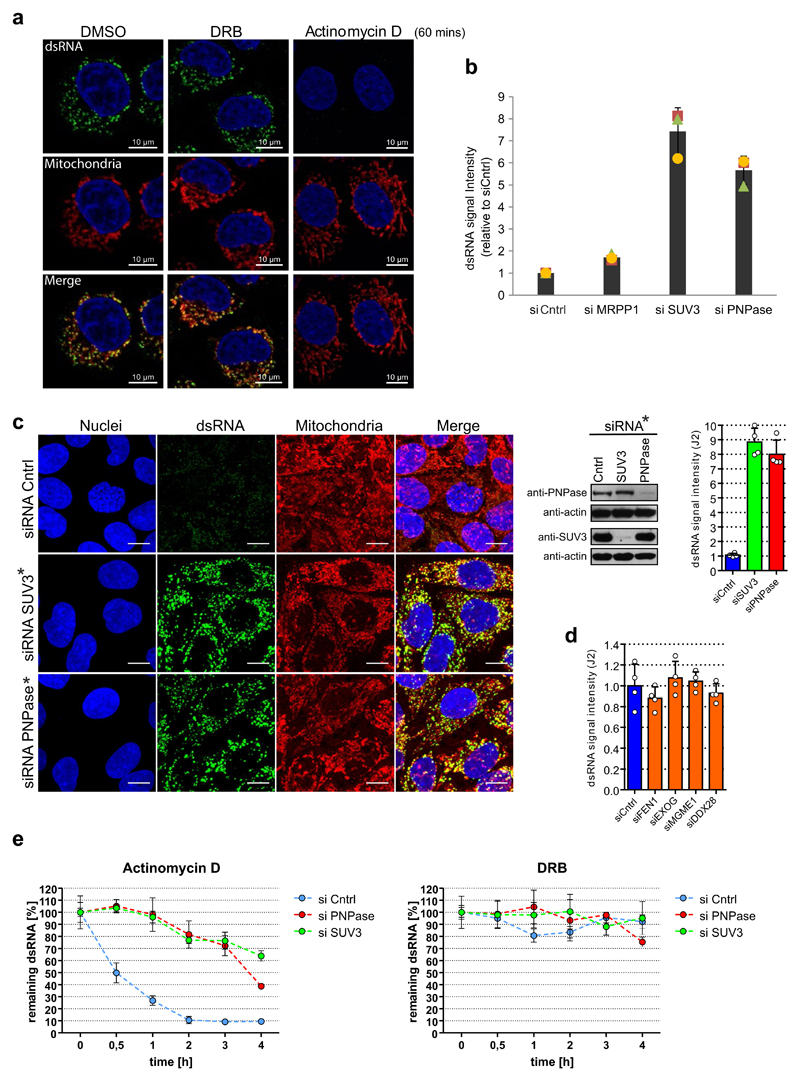
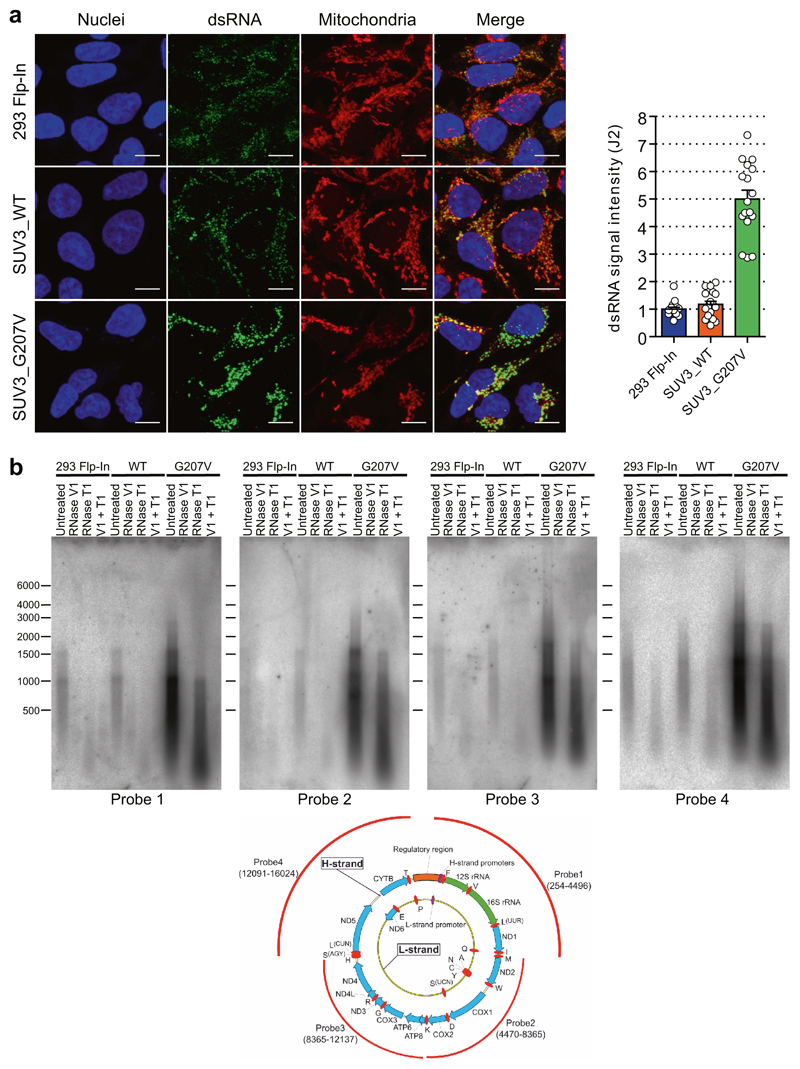
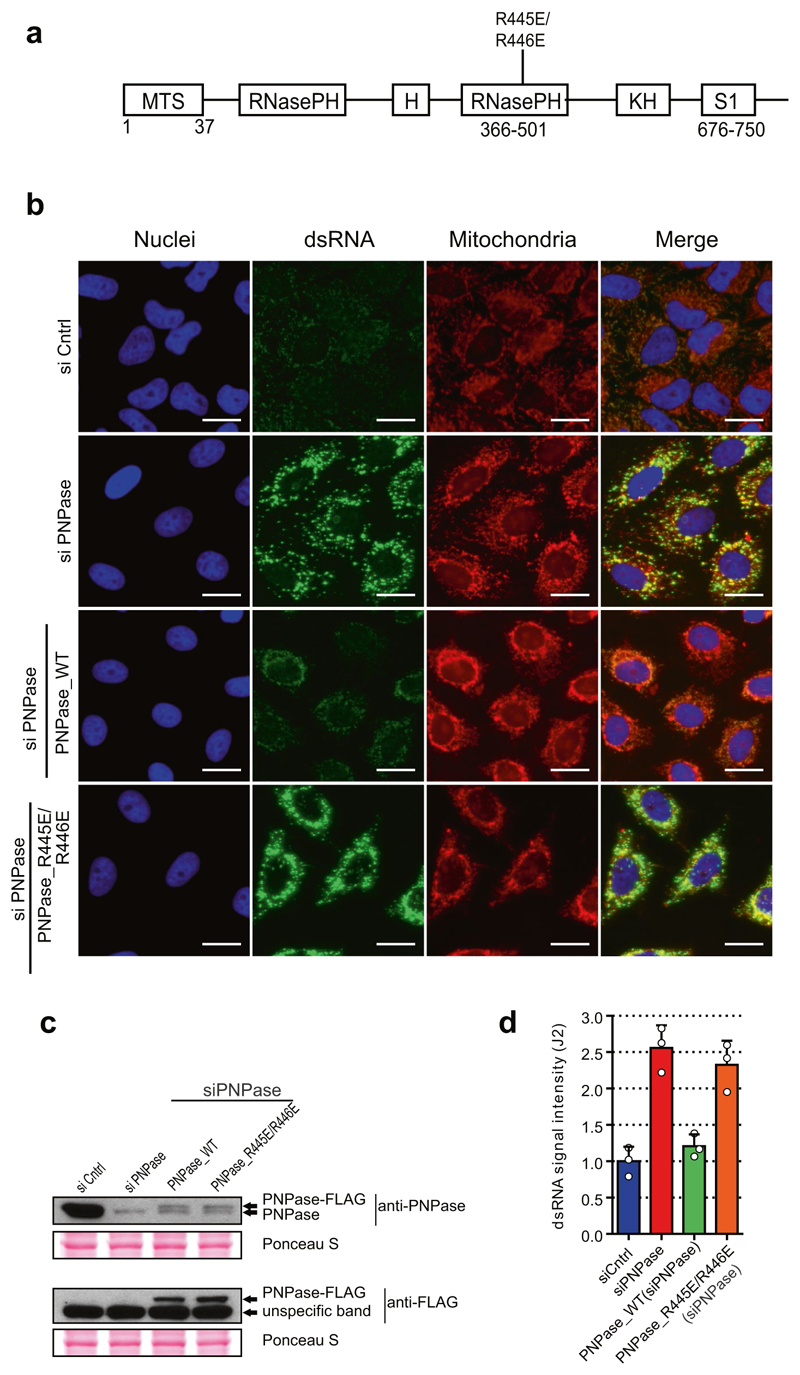
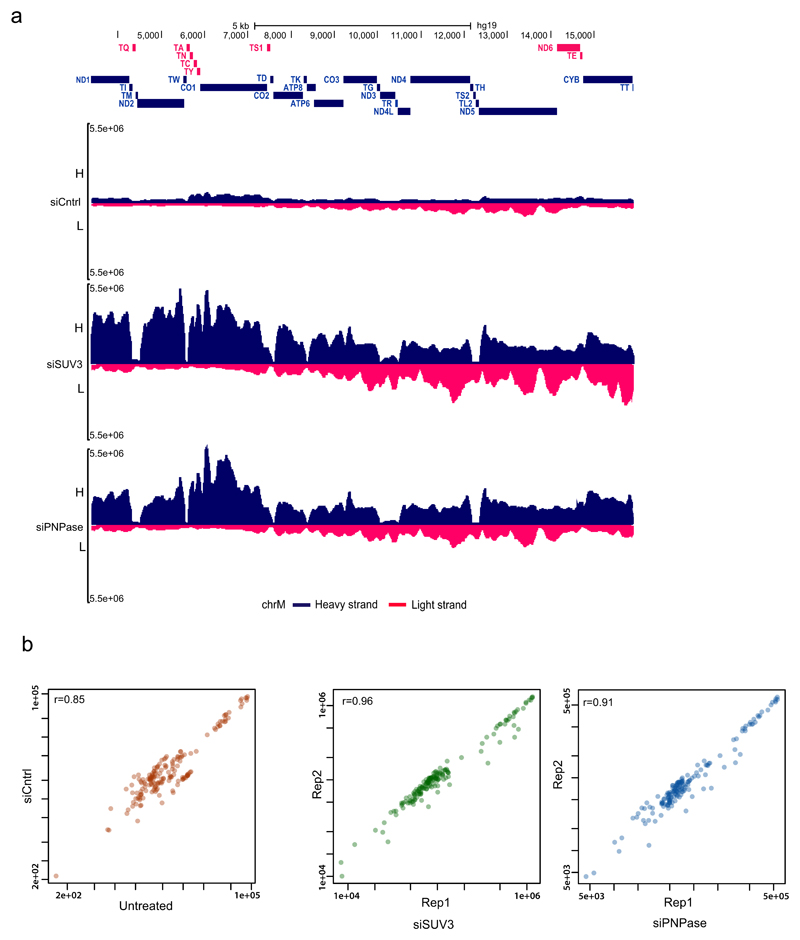
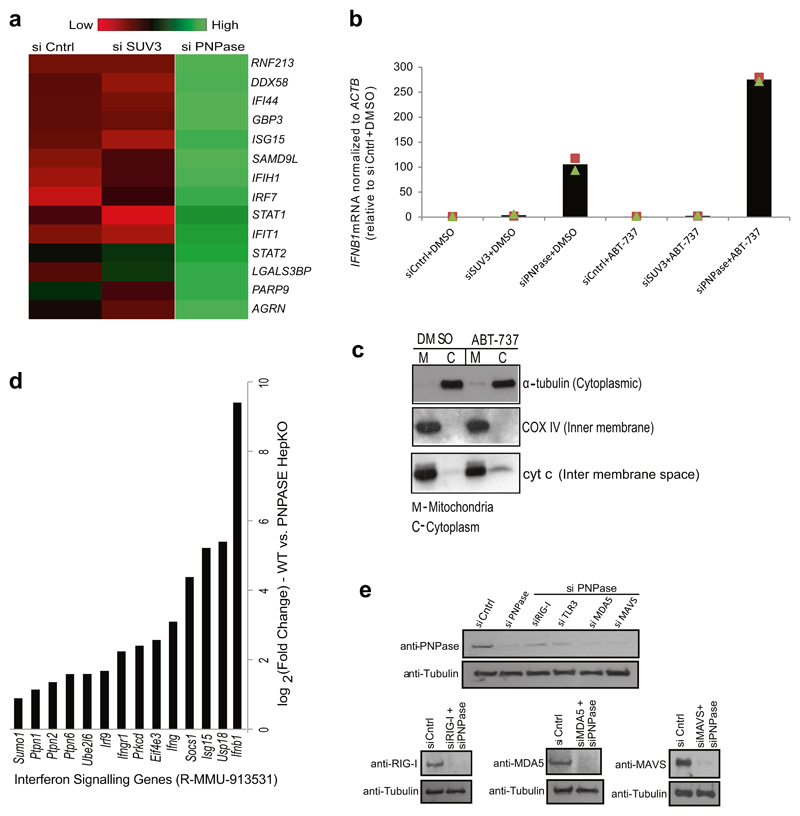
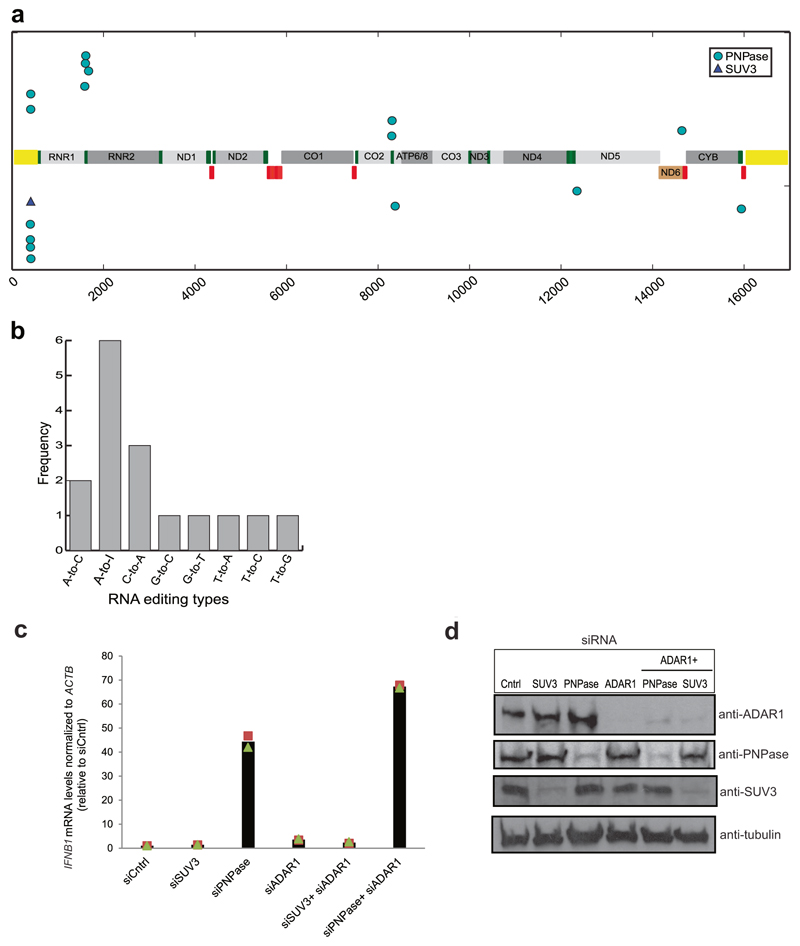
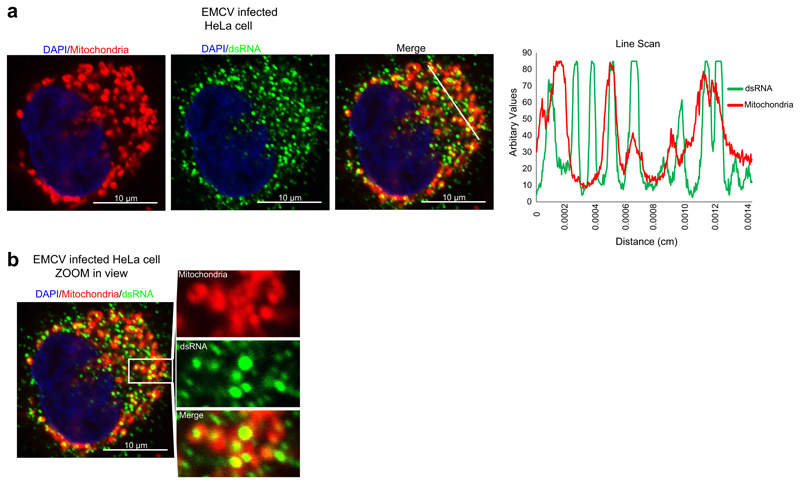
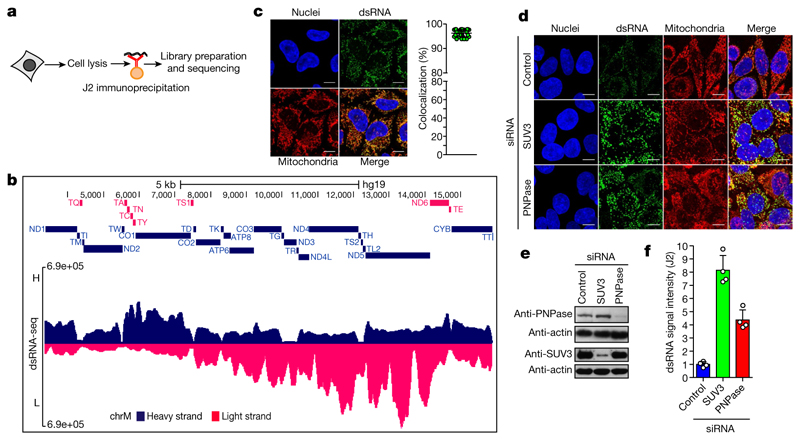
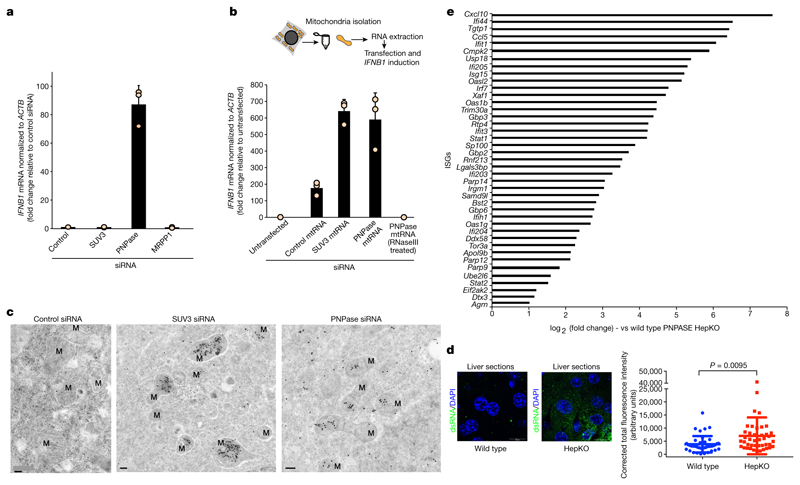
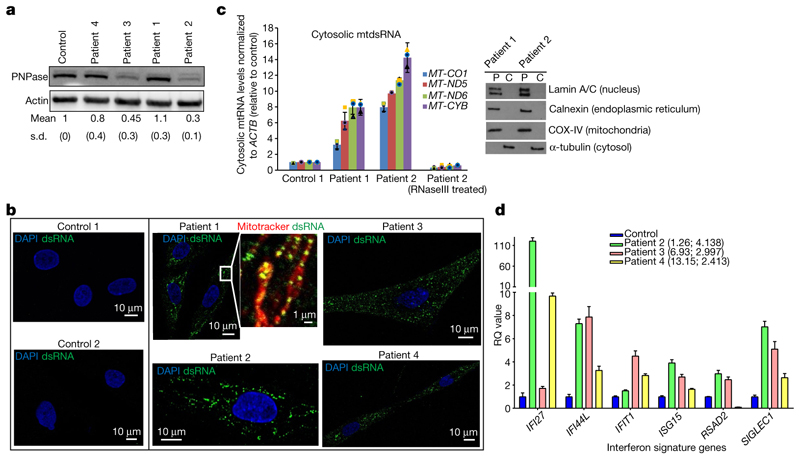
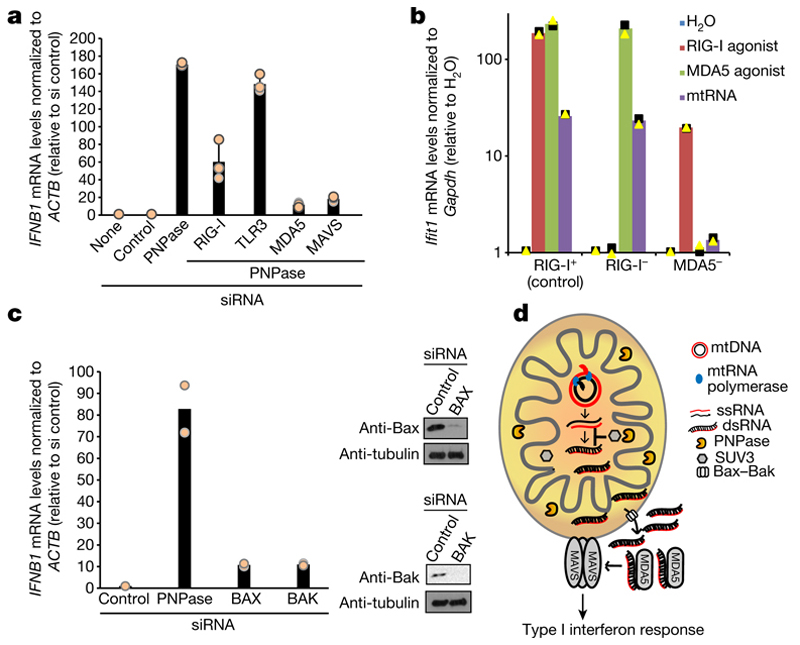
Mitochondria are descendants of endosymbiotic bacteria and retain essential prokaryotic features such as a compact circular genome. Consequently, in mammals, mitochondrial DNA is subjected to bidirectional transcription that generates overlapping transcripts, which are capable of forming long double-stranded RNA structures1,2. However, to our knowledge, mitochondrial double-stranded RNA has not been previously characterized in vivo. Here we describe the presence of a highly unstable native mitochondrial double-stranded RNA species at single-cell level and identify key roles for the degradosome components mitochondrial RNA helicase SUV3 and polynucleotide phosphorylase PNPase in restricting the levels of mitochondrial double-stranded RNA. Loss of either enzyme results in massive accumulation of mitochondrial double-stranded RNA that escapes into the cytoplasm in a PNPase-dependent manner. This process engages an MDA5-driven antiviral signalling pathway that triggers a type I interferon response. Consistent with these data, patients carrying hypomorphic mutations in the gene PNPT1, which encodes PNPase, display mitochondrial double-stranded RNA accumulation coupled with upregulation of interferon-stimulated genes and other markers of immune activation. The localization of PNPase to the mitochondrial inter-membrane space and matrix suggests that it has a dual role in preventing the formation and release of mitochondrial double-stranded RNA into the cytoplasm. This in turn prevents the activation of potent innate immune defence mechanisms that have evolved to protect vertebrates against microbial and viral attack.


Conflict of interest statement

Competing interests The authors declare no competing interests.

Figures

Extended Data Fig. 1
Extended Data Fig. 1. Characterization of anti-dsRNA J2 antibody and mtDNA depletion results in loss of mtdsRNA formation.
a, RT–qPCR analysis of L-mRNA expression in encephalomyocarditis virus (EMCV) infected HeLa cells at MOI 1 at the indicated time points after infection. Data are from two independent experiments. b, Confocal microscopy images of uninfected or EMCV-infected HeLa cells at multiplicity of infection (MOI) of 1, 8 h after infection stained with anti-dsRNA (J2) antibody (green) and DAPI (nuclei stained blue). Images are representative of two experiments. Scale bars, 10 μm. c, Immunostaining of dsRNA (green) and DNA (red) in HeLa cells treated with indicated nucleases before staining. Signal from J2 antibody is specific for RNA but not for DNA and is sensitive only to RNase III treatment. Images are representative of three experiments. Scale bars, 10 μm. d, Quantification of fluorescence signal from HeLa cells treated as in c. Data are mean ± s.e.m. from 4,095, 1,755, 4,766 and 5,585 cells for the untreated, RNase T1, RNase III and DNase Turbo groups, respectively. e, Autoradiogram showing substrate specificity of J2 on the basis of immunoprecipitation efficiency for uniformly 32P-radiolabelled ssRNA and dsRNA substrates. Signals were visualized and quantified by PhosphorImager. The level of immunoprecipitation signal is shown and expressed as the percentage of input. Images and data are representative of two experiments. For gel source data, see Supplementary Fig. 1. f, Chromosome-wise coverage plot of dsRNA-seq reads. Inset, read distribution of dsRNA-seq on the basis of RNA class biotypes. g, Left, dsRNA and DNA staining of HeLa cells transfected with constructs encoding the indicated proteins, the expression of which results in mtDNA depletion. Plasmids encoding mtDNA-depletion factors co-express EGFP from an independent promoter, which enables identification of transfected cells. Mitochondria were stained using anti-OXA1L antibody. Scale bars, 10 μm. Right, quantitative analysis of fluorescence signal from HeLa cells. Data are mean ± s.e.m. from ten cells.
Extended Data Fig. 2
Extended Data Fig. 2. RNA degradosome components SUV3 and PNPase are involved in mtdsRNA turnover.
a, HeLa cells treated with DMSO, DRB (100 μM) and actinomycin-D (0.5 μg ml−1) for 60 min and stained with anti-dsRNA (J2) antibody (green). Mitochondria were stained with MitoTracker Red CMXRos and nuclei with DAPI (blue) (representative of two experiments). b, Flow cytometric analysis of dsRNA levels in HeLa cells treated with the indicated siRNAs. Cells were labelled with J2 antibody or an isotype control. Data are mean ± s.d. from three independent experiments. c, Left, detection of dsRNA with J2 antibody in HeLa cells after depletion of PNPase or SUV3 by On-TARGETplus siRNAs (indicated with an asterisk and listed in Extended Data Table 2). Mitochondria were stained with MitoTracker Deep Red. Nuclei are stained with Hoechst (blue). Scale bars, 10 μm. Right top, western blot showing PNPase or SUV3 depletion. Blots are representative of four experiments. For gel source images, see Supplementary Fig. 1. Far right top, Quantification of dsRNA levels in HeLa cells depleted of PNPase or SUV3. Data are mean ± s.d. from four independent experiments. d, Quantitative analysis of fluorescent signals from dsRNA in HeLa cells with depleted enzymes involved in mitochondrial nucleic acids metabolism. Data are mean ± s.d. from four independent experiments. e, HeLa cells were transfected with siRNA specific for PNPase, SUV3, or non-targeting control. Prior to fixation, cells were treated for indicated times with inhibitors of transcription: actinomycin-D (0.5 μg ml−1) or DRB (100 μM). Immunostaining of dsRNA was performed and cells were imaged using a fluorescent microscope screening station. Data are mean ± s.d. from four independent experiments.
Extended Data Fig. 3
Extended Data Fig. 3. Unwinding activity of SUV3 is required to suppress mtdsRNA accumulation.
a, Left, confocal images of HEK 293 cells expressing stably integrated wild-type SUV3 (hSUV3_WT) and the catalytically inactive (G207V) dominant negative form (hSUV3_G207V) stained with J2 ab (green). Mitochondria stained with MitoTracker Deep Red (red). Nuclei stained with Hoechst (blue). Right, quantitative analysis of fluorescence signal from HEK 293 cells in the above experiment. Data are mean ± s.e.m. from 16 cells. b, Top, northern blots of J2 immunoprecipitated dsRNA from hSUV3_WT and hSUV3_G207V overexpressing HEK 293 cell lines with four different probes spanning the entire mitochondrial genome. Bottom, diagram depicts positions of probes on mitochondrial genome. Blots are representative of two experiments. For gel source data, see Supplementary Fig. 1.
Extended Data Fig. 4
Extended Data Fig. 4. Exonuclease activity of PNPase is required to suppress mtdsRNA formation.
a, Diagram of PNPase domain structure showing the position of the R445E/R446E mutation in the RNasePH domain. b, Immunostaining of dsRNA (green) in HeLa stable cell lines transfected with siRNA specific for PNPase or non-targeting control siRNA. Depletion of endogenous PNPase was rescued by expression of siRNA-resistant PNPase-FLAG protein (wild-type or mutated (RNA-degradation deficient version of PNPase (R445E/R446E) was expressed)). Mitochondria are stained with MitoTracker Deep Red. Nuclei are stained with Hoechst (blue). Scale bars, 20 μm. c, Western-blot analysis of PNPase in HeLa cells treated as in b. Exogenous, siRNA-resistant PNPase is expressed as a FLAG fusion. Blots are representative of three experiments. d, Quantitative analysis of fluorescent signals from dsRNA in HeLa treated as in b. Data are mean ± s.d. from three independent experiments. For gel source data, see Supplementary Fig. 1.
Extended Data Fig. 5
Extended Data Fig. 5. dsRNA-seq of HeLa cells following siRNA depletion of SUV3 and PNPase.
a, dsRNA-seq reads across the mitochondrial genome spanning entire protein coding region (~3.5–16 kb) following siRNA treatment. Data are from two independent experiments. H-strand genes are shown as blue bars and L-strand as red bars. Short tRNA genes are denoted with T as the first letter. b, Correlation plots of J2 immunoprecipitation dsRNA-seq replicates. Pearson correlation coefficients are calculated and shown on each plot.
Extended Data Fig. 6
Extended Data Fig. 6. Upregulation of ISGs in HeLa and murine cells following loss of PNPase accentuated by mitochondrial outer membrane permeabilization.
a, Heat map of ISGs generated from a subset extracted from a list of significantly expressed genes in siRNA treated HeLa cells. Gene expression is depicted by colour intensity. Green denotes upregulation and red downregulation. b, RT–qPCR analysis of IFNB1 mRNA in HeLa cells treated with indicated siRNAs and then 8 h of treatment with vehicle or ABT-737. Data are the mean of two independent experiments. c, Western-blot analysis of the cytochrome c (cyt c) release into the cytoplasm of HeLa cells treated with vehicle or ABT-737 for 8 h. Subcellular fractionation purity confirmed by relevant markers. Blots are representative of two experiments. d, log2(fold change) expression levels of ISGs and genes involved in interferon signalling in HepKO versus wild-type female mice. ISG list is based on the Reactome database. e, Western blot of whole-cell extracts from cells treated with the indicated siRNAs. Blots are representative of two experiments. For gel source data, see Supplementary Fig. 1.
Extended Data Fig. 7
Extended Data Fig. 7. RNA editing of cytoplasmic mtRNA.
a, RNA editing sites mapped on the RNA transcriptome of SUV3 and PNPase depleted cells are shown. Each dot represents an editing event. Dots on the upper panel denote editing events on the H-strand and dots on the lower panel denote editing on the L-strand. Triangle denotes single SUV3 editing site. Yellow bars denote the D-loop region. Short red bars denote tRNA genes on the L-strand and green bars denote tRNA genes on the H-strand. b, Frequency of dinucleotide RNA editing sites mapped in the PNPase depleted samples. c, RT–qPCR analysis of IFNB1 mRNA levels in indicated siRNA-treated cells. Data are the mean from two independent experiments. d, Western blot of ADAR1, SUV3 and PNPase in cell treated with the indicated siRNAs. Blots are representative of two experiments. For gel source data, see Supplementary Fig. 1.
Extended Data Fig. 8
Extended Data Fig. 8. EMCV infection results in dsRNA accumulation that partially overlaps with mitochondria.
a, Left, confocal images of EMCV-infected HeLa cell at MOI 1, 6 h after infection, stained with anti-dsRNA (J2) antibody. Mitochondria are stained with MitoTracker Red CMXRos and nucleus with DAPI. Right, line scan RGB profile for the region of interest (ROI) selected with a white line is shown on the right. Data are representative of two experiments. b, Expanded view of the ROI of an EMCV-infected HeLa cell showing colocalization of dsRNA with mitochondria. Image is representative of two experiments. Scale bars, 10 μm.
Fig. 1
Fig. 1. Mitochondria form dsRNA that is suppressed by the RNA degradosome.
a, dsRNA-seq experimental approach. b, dsRNA-seq reads across the mitochondrial genome spanning protein coding region in untreated HeLa cells. H-strand genes are shown as blue bars and L-strand as red bars. Short tRNA genes are denoted with T as the first letter. Data are representative of two experiments. c, Immunostaining of dsRNA in HeLa cells with anti-dsRNA (J2) antibody. Mitochondria and nuclei are stained with MitoTracker Deep Red and Hoechst, respectively. Scale bars, 10 μm. Graphs quantify co-localization of dsRNA foci with mitochondria. Data are mean ± s.d. from 29 cells. d, Anti-dsRNA (J2) staining in HeLa cells depleted for PNPase or SUV3 by siRNA as in c. Different imaging settings were applied in panel c and d so that the J2 intensity of control cells varies. e, Western blot showing PNPase or SUV3 depletion. Blots are representative of four experiments. f, Quantification of dsRNA levels in PNPase- or SUV3-depleted cells. Data are mean ± s.d. from four experiments. For gel source data, see Supplementary Fig. 1.
Fig. 2
Fig. 2. PNPase suppresses a mtdsRNA-mediated type I interferon response.
a, RT–qPCR analysis of IFNB1 mRNA in HeLa cells treated with the indicated siRNAs. Data are mean ± s.d. from three independent experiments. b, Top, schematic of MACS strategy to purify mtRNA. Bottom, RT–qPCR analysis of IFNB1 mRNA in HeLa cells transfected with mtRNA (using MACS) as indicated. Data are mean ± s.d. from three independent experiments. c, Transmission electron microscopy images of immunogold labelled dsRNA (J2) in cryofixed HeLa cells treated with the indicated siRNAs. Images are representative of two experiments. M, mitochondria. Scale bars, 0.2 μm. d, Left, fluorescence immunohistochemistry staining of dsRNA (J2) in liver sections from wild-type and HepKO mice. Nuclei are stained with DAPI. Right, dsRNA quantification. Data are mean ± s.e.m. from 41 (wild-type) and 42 (HepKO) randomly sampled regions in two liver sections measured. The P value is from a two-sided unpaired t-test with Welch’s correction. e, log2 fold expression change of ISGs in wild-type versus HepKO mice. The ISG list is based on previously published work.
Fig. 3
Fig. 3. Pathological PNPT1 mutations result in mtdsRNA accumulation and activation of ISGs.
a, PNPase western blot in fibroblasts from four patients with mutations in PNPT1 and a control. Quantification is shown as mean and s.d. from four experiments. b, Immunostaining of dsRNA (J2) in fibroblast cell lines from patients with PNPT1 mutations and controls. Mitochondria are stained with MitoTracker Red CMXRos and nuclei with DAPI (blue). Scale bars, 10 μm (main images) and 1 μm (expanded view). Images are representative of two experiments. c, Left, RT–qPCR analysis of cytosolic mtRNA (four loci) in cells with PNPT1 mutations versus control cells. Data are mean ± s.d. from three independent experiments. Right, fraction purity as shown by western blots. Blots are representative of two experiments. P, pellet; C, cytosolic fractions. d, RT–qPCR analysis of six ISGs in whole blood from patients 2, 3 and 4. Ages when tested in decimalized years and interferon score are shown in brackets. The data plotted is relative quantification (RQ) values for each patient, with the error bars representing RQmin and RQmax. Data are from combined 29 control samples (blue bar) and 3 individual patient samples measured in triplicate. For gel source data, see Supplementary Fig. 1.
Fig. 4
Fig. 4. MDA5 is the primary sensor of cytosolic mtdsRNA released in a Bax–Bak dependent fashion.
a, RT–qPCR analysis of IFNB1 expression in HeLa cells transfected with indicated siRNAs. Data are mean ± s.d. from three independent experiments. b, RT–qPCR analysis of Ifit1 expression in Ddx58+/− (control, RIG-I+), Ddx58−/− (RIG-I) and Ifih1−/− (MDA5) immortalized MEFs transfected with mtRNA, RIG-I (ppp-IVT-RNA99nt) or MDA5 (CIP-EMCV RNA) specific agonists. Data are the mean from two independent experiments. Values are plotted on a logarithmic scale. c, Left, RT–qPCR analysis of IFNB1 mRNA in HeLa cells treated with the indicated siRNAs. Data are mean from two independent experiments. Right, western blot of siRNA depletion efficiency. Blots are representative of two experiments. For gel source data, see Supplementary Fig. 1. d, Model of mtdsRNA suppression by the RNA degradosome. Loss of PNPase causes accumulation of mtdsRNA and release of mtdsRNA into the cytoplasm in a Bax–Bak dependent manner. PNPase restricts mtdsRNA in matrix (together with SUV3) and IMS. MDA5 acts as the primary mtdsRNA sensor transducing an interferon response through the MAVS signalling pathway.

Comment in

  • Double (mtRNA) trouble.
    Bordon Y. Bordon Y. Nat Rev Immunol. 2018 Sep;18(9):543. doi: 10.1038/s41577-018-0055-x. Nat Rev Immunol. 2018. PMID: 30104714 No abstract available.
  • Mitochondrial dsRNA: A New DAMP for MDA5.
    Linder A, Hornung V. Linder A, et al. Dev Cell. 2018 Sep 10;46(5):530-532. doi: 10.1016/j.devcel.2018.08.019. Dev Cell. 2018. PMID: 30205036

References

    1. Aloni Y, Attardi G. Symmetrical in vivo transcription of mitochondrial DNA in HeLa cells. Proc Natl Acad Sci USA. 1971;68:1757–1761. - PMC - PubMed
    1. Young PG, Attardi G. Characterization of double-stranded RNA from HeLa cell mitochondria. Biochem Biophys Res Commun. 1975;65:1201–1207. - PubMed
    1. Borowski LS, Dziembowski A, Hejnowicz MS, Stepien PP, Szczesny RJ. Human mitochondrial RNA decay mediated by PNPase–hSuv3 complex takes place in distinct foci. Nucleic Acids Res. 2013;41:1223–1240. - PMC - PubMed
    1. Karikó K, Buckstein M, Ni H, Weissman D. Suppression of RNA recognition by Toll-like receptors: the impact of nucleoside modification and the evolutionary origin of RNA. Immunity. 2005;23:165–175. - PubMed
    1. Schlee M, Hartmann G. Discriminating self from non-self in nucleic acid sensing. Nat Rev Immunol. 2016;16:566–580. - PMC - PubMed

Publication types

MeSH terms