

Shift towards larger diatoms in a natural phytoplankton assemblage under combined high-CO2 and warming conditions
- PMID: 30046201
- PMCID: PMC6055579
- DOI: 10.1093/plankt/fby018
Shift towards larger diatoms in a natural phytoplankton assemblage under combined high-CO2 and warming conditions
Abstract
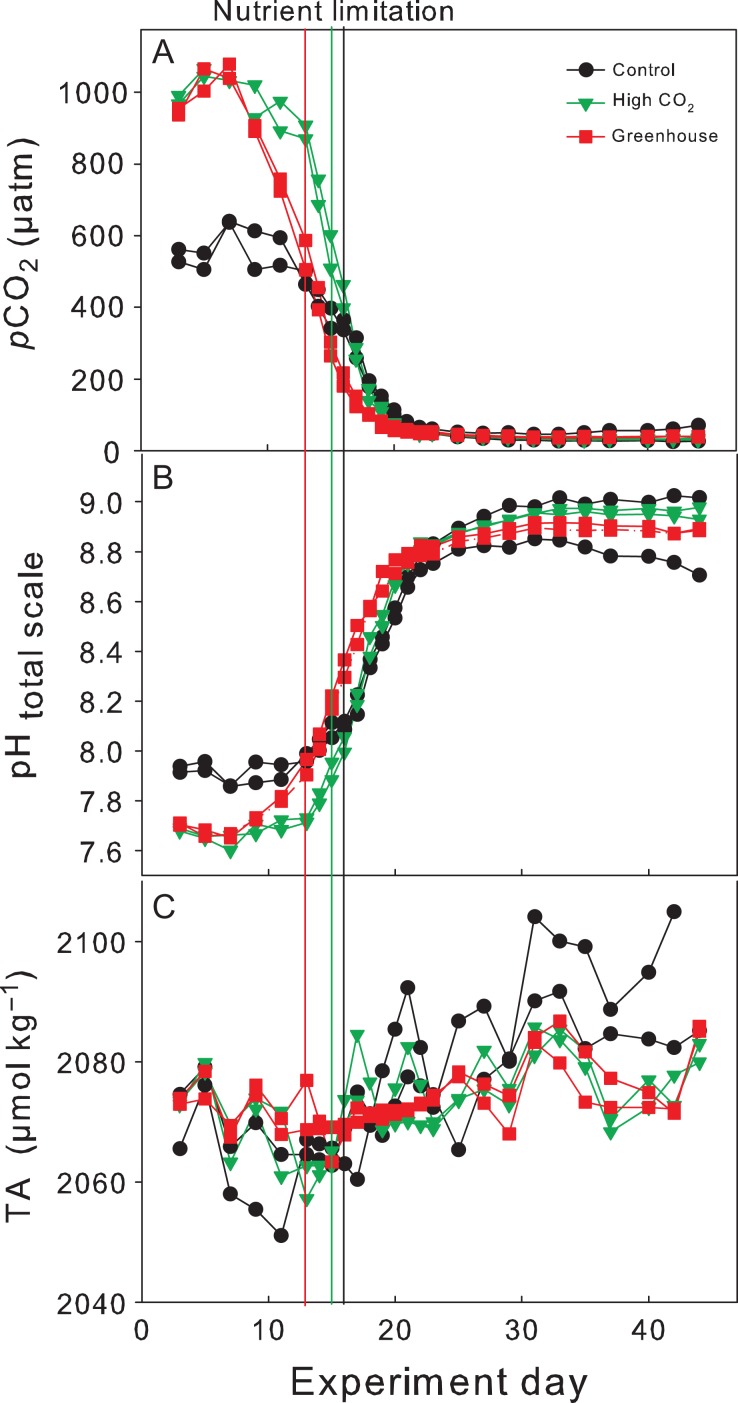
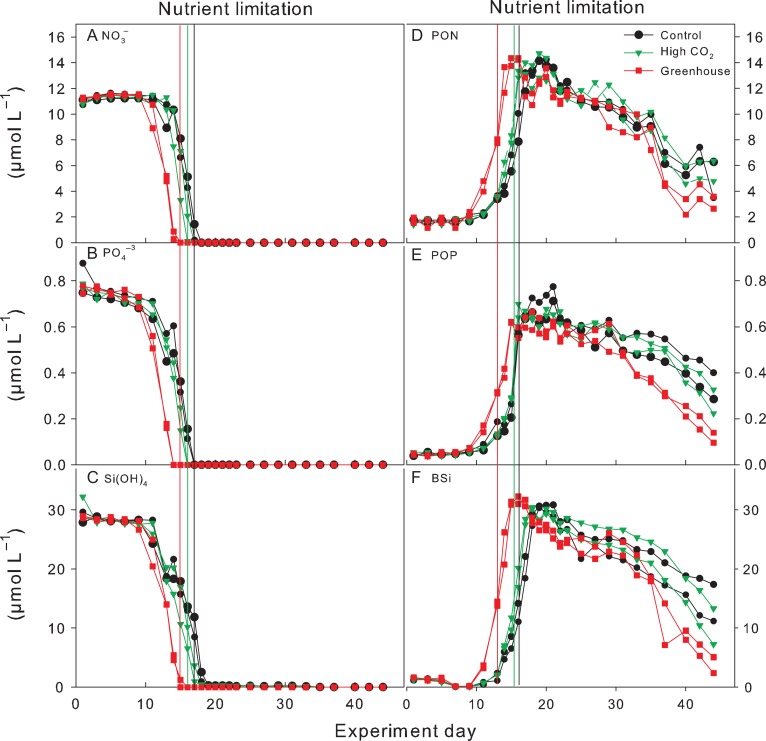
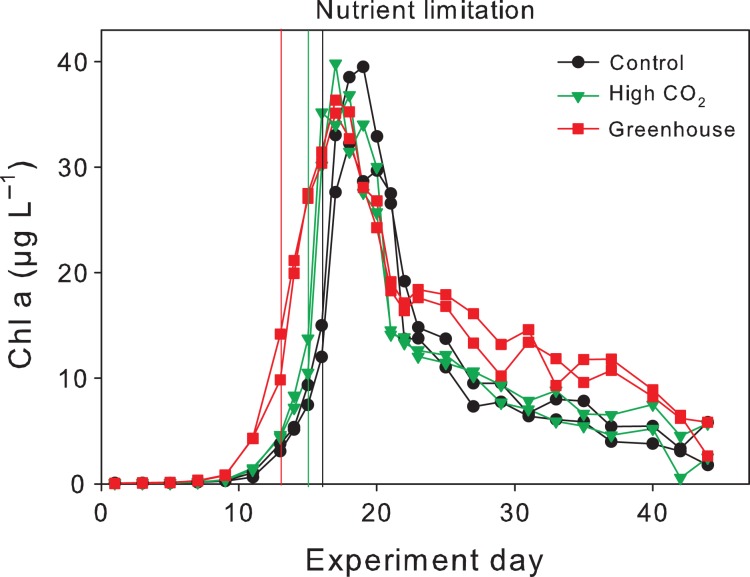
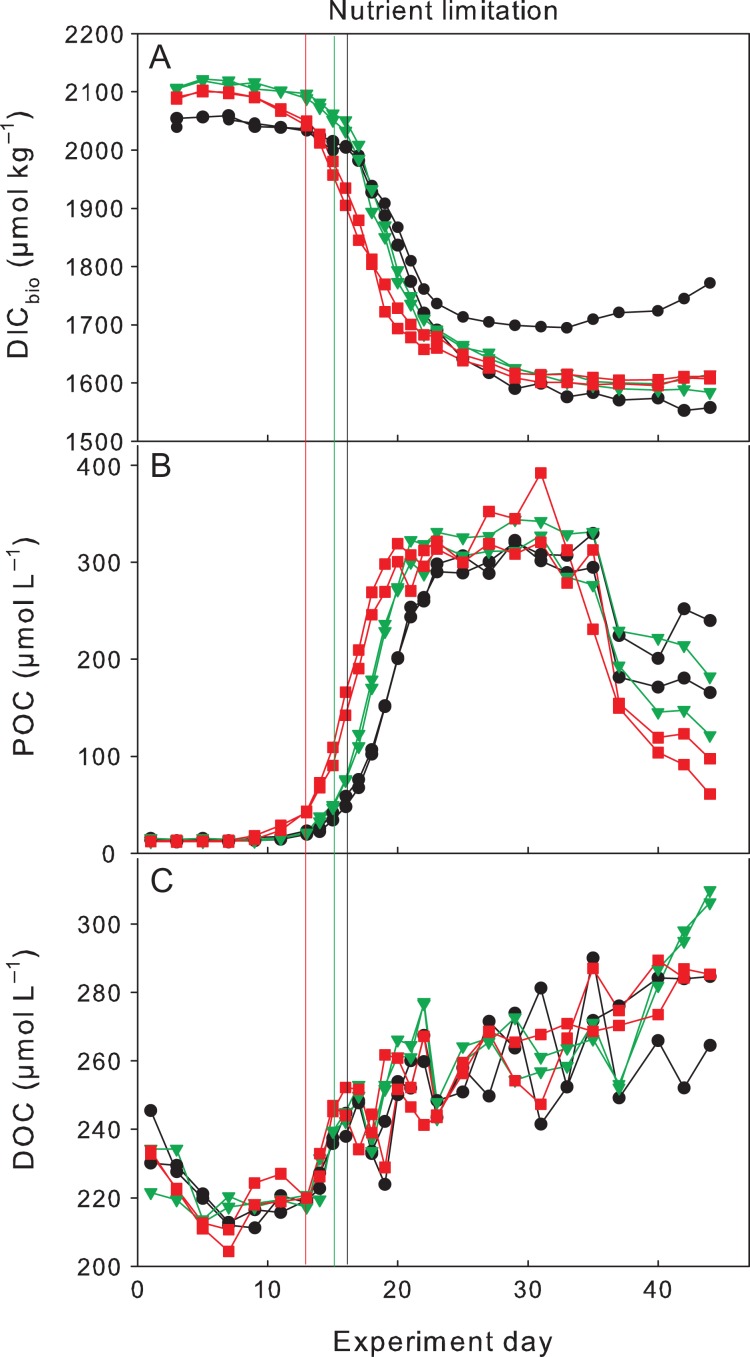
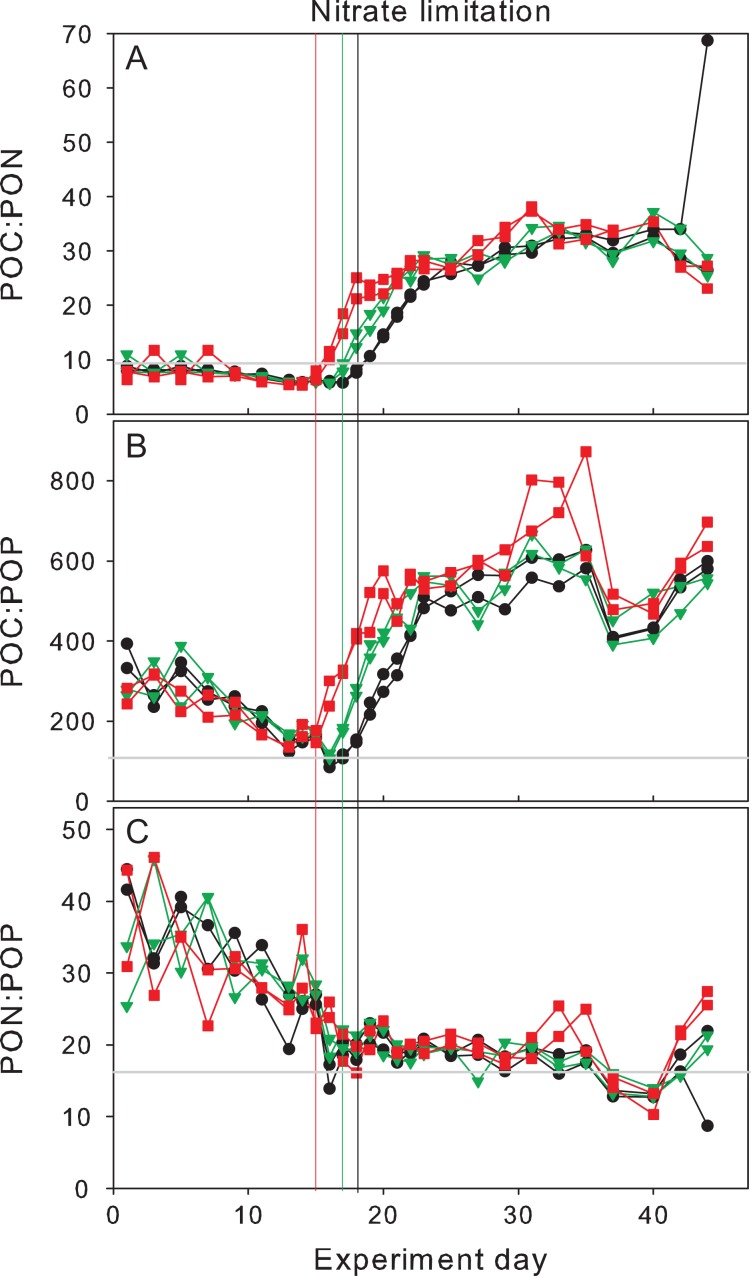
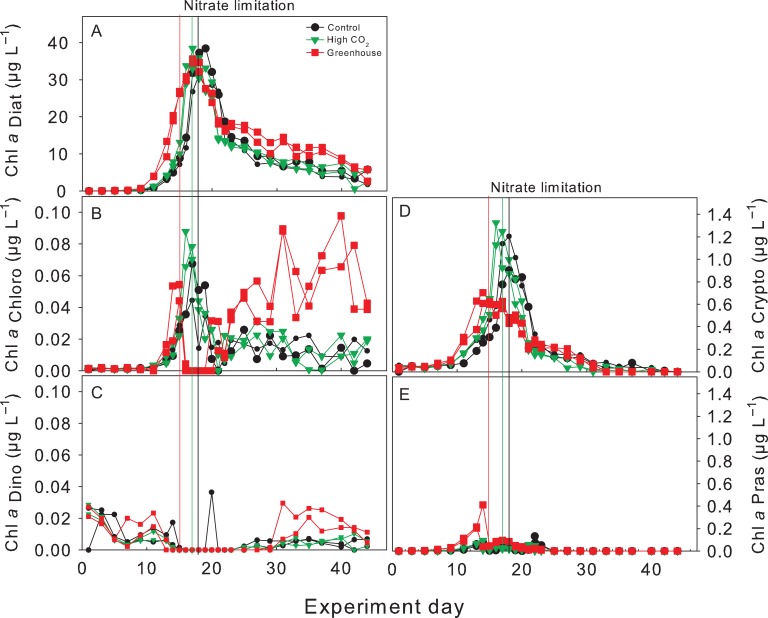
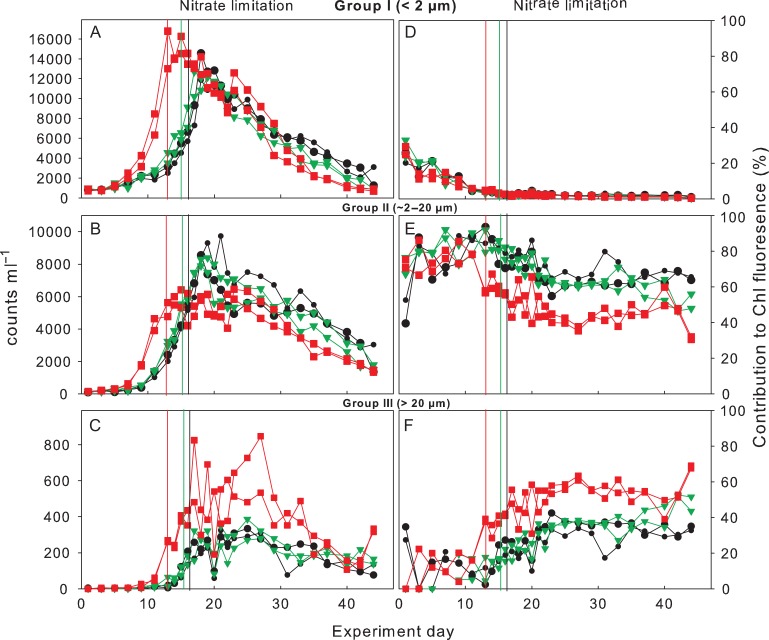
An indoor mesocosm experiment was carried out to investigate the combined effects of ocean acidification and warming on the species composition and biogeochemical element cycling during a winter/spring bloom with a natural phytoplankton assemblage from the Kiel fjord, Germany. The experimental setup consisted of a "Control" (ambient temperature of ~4.8 °C and ~535 ± 25 μatm pCO2), a "High-CO2" treatment (ambient temperature and initially 1020 ± 45 μatm pCO2) and a "Greenhouse" treatment (~8.5 °C and initially 990 ± 60 μatm pCO2). Nutrient replete conditions prevailed at the beginning of the experiment and light was provided at in situ levels upon reaching pCO2 target levels. A diatom-dominated bloom developed in all treatments with Skeletonema costatum as the dominant species but with an increased abundance and biomass contribution of larger diatom species in the Greenhouse treatment. Conditions in the Greenhouse treatment accelerated bloom development with faster utilization of inorganic nutrients and an earlier peak in phytoplankton biomass compared to the Control and High CO2 but no difference in maximum concentration of particulate organic matter (POM) between treatments. Loss of POM in the Greenhouse treatment, however, was twice as high as in the Control and High CO2 treatment at the end of the experiment, most likely due to an increased proportion of larger diatom species in that treatment. We hypothesize that the combination of warming and acidification can induce shifts in diatom species composition with potential feedbacks on biogeochemical element cycling.
Keywords: diatoms; mesocosms; ocean acidification; spring bloom; warming.
Figures
References
-
- Aberle N., Lengfellner K. and Sommer U. (2007) Spring bloom succession, grazing impact and herbivore selectivity of ciliate communities in response to winter warming. Oecologia, 150, 668–681. doi:10.1007/s00442-006-0540-y. - DOI - PubMed
-
- Bach L. T. (2015) Reconsidering the role of carbonate ion concentration in calcification by marine organisms. Biogeosciences, 12, 4939–4951. doi:10.5194/bg-12-4939-2015. - DOI
-
- Bellerby R. G. J., Schulz K. G., Riebesell U., Neill C., Nondal G., Heegaard E., Johannessen T. and Brown K. R. (2008) Marine ecosystem community carbon and nutrient uptake stoichiometry under varying ocean acidification during the PeECE III experiment. Biogeosciences, 5, 1517–1527. doi:10.5194/bg-5-1517-2008. - DOI
-
- Biermann A., Engel A. and Riebesell U. (2014) Changes in organic matter cycling in a plankton community exposed to warming under different light intensities. J. Plankton Res., 36, 658–671. doi:10.1093/plankt/fbu005. - DOI
-
- Boyd P. W. and Brown C. J. (2015) Modes of interactions between environmental drivers and marine biota. Front. Mar. Sci., 2, 1–7. doi:10.3389/fmars.2015.00009. - DOI
LinkOut - more resources
Full Text Sources
Other Literature Sources
