. 2018 Jul 10;9(53):30146-30162.
doi: 10.18632/oncotarget.25731.

Identification of integrin drug targets for 17 solid tumor types

Affiliations

Identification of integrin drug targets for 17 solid tumor types

Adith S Arun et al. Oncotarget. .

Abstract

Integrins are contributors to remodeling of the extracellular matrix and cell migration. Integrins participate in the assembly of the actin cytoskeleton, regulate growth factor signaling pathways, cell proliferation, and control cell motility. In solid tumors, integrins are involved in promoting metastasis to distant sites, and angiogenesis. Integrins are a key target in cancer therapy and imaging. Integrin antagonists have proven successful in halting invasion and migration of tumors. Overexpressed integrins are prime anti-cancer drug targets. To streamline the development of specific integrin cancer therapeutics, we curated data to predict which integrin heterodimers are pausible therapeutic targets against 17 different solid tumors. Computational analysis of The Cancer Genome Atlas (TCGA) gene expression data revealed a set of integrin targets that are differentially expressed in tumors. Filtered by FPKM (Fragments Per Kilobase of transcript per Million mapped reads) expression level, overexpressed subunits were paired into heterodimeric protein targets. By comparing the RNA-seq differential expression results with immunohistochemistry (IHC) data, overexpressed integrin subunits were validated. Biologics and small molecule drug compounds against these identified overexpressed subunits and heterodimeric receptors are potential therapeutics against these cancers. In addition, high-affinity and high-specificity ligands against these integrins can serve as efficient vehicles for delivery of cancer drugs, nanotherapeutics, or imaging probes against cancer.

Keywords: computational genomics; integrins; precision medicine; therapeutic target selection; transcriptomics.


Conflict of interest statement

CONFLICTS OF INTEREST All authors declare that there are no conflicts of interest.

Figures

Figure 1
Figure 1. Schematic flowchart depicting the strategy for selecting integrin drug targets
Transcriptome profiling data for 17 cancer types from the TCGA was used for analysis. RNA-seq data (raw counts) were retrieved from the Genomic Data Common using TCGAbiolinks. Target prioritization was then accomplished by applying Metric to define integrin subunit genes significantly overexpressed in tumor samples (logarithmic fold change, FDR < 0.05). Subsequently, viable, individual subunit drug targets were selected by filtering the results for integrin transcripts passing a minimum threshold of expression (FPKM values) and by comparison with immunohistochemistry data (IHC) for protein-level expression expression of the corresponding subunits. Through rules-based pairing of subunits, possible protein integrin drug targets are proposed. See Materials and Methods for more detailed descriptions of each step.
Figure 2
Figure 2. Representation of expression of 27 integrin subunits across 17 cancer types
(A) Possible combinations of integrin subunits to form 24 biologically functional integrin heterodimers. The different possible combinations of alpha and beta subunits capable of forming heterodimeric integrin proteins are displayed. 24 unique heterodimeric receptors can be formed from 9 beta subunits and 18 alpha subunits. The integrin beta-like 1 subunit has been characterized, but thus far an alpha subunit binding partner has not been identified, and is represented by a question mark. (B) Diagrammatic visualization of all integrin subunits across surveyed cancer types. Differential expression of integrin subunit genes was determined by comparing the expression of a subunit in tumor samples versus normal samples as outlined in Materials and Methods. The gradient from blue to red represents the magnitude of differential expression of tumor versus normal; darkest blue and the darkest red indicates the most underexpressed and overexpressed gene in each cancer type, respectively. The relative log fold change expression of each integrin subunit within each cancer type is depicted in the heatmap matrix above. White boxes represent void values due to the false discovery rate being greater than 0.05. RNA-Seq data (transcript counts) was obtained from TCGA and differential expression analysis was performed in R (as detailed in Materials and Methods). The cancer types examined and their abbreviations (Supplementary Table 1) are as follows (https://gdc.cancer.gov/resources-tcga-users/tcga-code-tables/tcga-study-abbreviations): Urothelial Bladder Carcinoma (BLCA), Breast Invasive Carcinoma (BRCA), Cervical Squamous Cell Carcinoma and Endocervical Adenocarcinoma (CESC), Glioblastoma Multiforme (GBM), Head and Neck Squamous Cell Carcinoma (HNSC), Kidney Chromophobe (KICH), Kidney Renal Cell Carcinoma (KIRC), Kidney Renal Papillary Cell Carcinoma (KIRP), Liver Hepatocellular Carcinoma (LIHC), Lung Adenocarcinoma (LUAD), Lung Squamous Cell Carcinoma (LUSC), Pancreatic Adenocarcinoma (PAAD), Paraganglioma and Pheochromocytoma (PCPG), Prostate Adenocarcinoma (PRAD), Rectum Adenocarcinoma (READ), Stomach Adenocarcinoma (STAD).
Figure 3
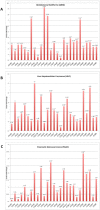
Figure 3. Integrin subunit expression for selected tumor types
Analysis for differentially expressed genes (tumor vs. normal) was performed on RNA-Seq expression data obtained for each TCGA cancer site project. Linear fold changes for each integrin in GBM, LIHC, and PAAD are presented in the bar graph. The y-axis is the linear fold change in expression, and each bar represents a different integrin subunit. The linear fold change threshold represented by the line y = 1 indicates the threshold for differential expression in either direction; values below this line are underexpressed in cancer and values above are overexpressed. Asterisks following the annotated value represent statistically significant alterations (FDR < 0.05). Source material for these graphs is Supplementary Figure 1. The complete FDR, p-value, and logarithmic fold change values can be found in Supplementary Table 2.
Figure 4
Figure 4. Metric ranking of the best potential therapeutic integrin targets
A scoring system was developed and applied to the RNA-Seq data in order to predict the best integrin drug targets specific to each cancer type (Materials and Methods). The two components that comprised Metric were the logarithmic fold change value and the false discovery rate (FDR). In order to generate the Metric values, both components were considered for each subunit for each tumor type and applied to a formula described in Materials and Methods. Colored on a spectrum from light to dark green, the lowest values are colored lighter shades while the higher values are colored darker shades. Higher values indicate more promising drug targets based on the following criteria: high level of differential expression (logarithmic fold change), acceptable FDR values (p < 0.05).
Figure 5
Figure 5. Expression levels for all ranked integrin subunit genes
FPKM expression values for all the ranked integrin subunits (Figure 2B) were obtained from TCGA Expression Graphs hosted at The Protein Atlas (https://www.proteinatlas.org/). FPKM values ≥ 10 (Blue) denote that the level of expression of the gene is significant enough to represent a targetable receptor. The boxes colored in green indicate FPKM values very close to the cut-off, and are also considered targetable subunits.
Figure 6
Figure 6. Profiling of integrin protein overexpression across 12 cancer types
Immunohistochemistry (IHC) data from The Human Protein Atlas (https://www.proteinatlas.org/humanpathology) was analyzed for integrin subunit protein expression in each cancer type (Materials and Methods). The values of the translated quantitative IHC expression levels is shown in Supplementary Table 3A in the format (tumor, normal). Overexpression was determined when the tumor value exceeds the normal value. In the table above, the cancers exhibiting overexpression of the indicated integrin subunits are displayed in green. A blank box indicates that either there was no overexpression of the integrin compared to normal tissue samples or that the Protein Atlas did not perform IHC analysis of that integrin subunit (IHC analysis was not performed for ITGA4 and ITGA10). Since the cancer types are broadly categorized by organ site in the Protein Atlas, data are not available for certain cancer sub-types, specifically renal (KIRC, KICH, KIRP), lung (LUAD, LUSC), colorectal (COAD, READ), PCPG and CHOL. Immunohistochemistry data was collected from the Protein Atlas, and only the data from validated antibodies were used for analysis. Supplementary Table 3B displays the antibodies used and sample sizes. A number of integrin subunits only displayed data from one antibody, thus it was used as default regardless of validity (ITGAD, ITGAL, ITGA1, ITGA7, ITGA8, ITGA9, ITGA11, ITGBL1, ITGB1, ITGB3, ITGB7 have data reported by one antibody only). Additionally, data for ITGA4 and ITGA10 subunits are intentionally left empty because the Protein Atlas did not report any results for these subunits.
Figure 7
Figure 7. Selection of cancer type-specific therapeutically actionable integrin heterodimer receptors
The therapeutically actionable receptors are based on the highest ranked, according to Metric, and FPKM-filtered subunit genes. The subunits that passed the Metric and FPKM filters were combined, according to the integrin pairing rules (Figure 2A), to form any of the 24 possible obligated heterodimeric integrins displayed on the cell surface. Blue indicates integrin heterodimers identified as targets through differential expression analysis of TCGA data only, Red indicates results obtained from immunohistochemistry only (Figure 5), and Green indicates that both methods agree. The cancer types (BLCA, BRCA, CESC, KICH, KIRP, KIRC, PCPG, PRAD, READ), did not have viable heterodimer integrin options based on the FPKM filtered ranked genes from RNA-seq analysis. Renal cancer data from IHC was broadly applied to KICH, KIRP and KIRC. Similarily, immunohistochemistry lung cancer data was applied to LUSC and LUAD.
Figure 8
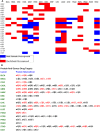
Figure 8. Pausible integrin heterodimers as cancer therapeutic targets
(A) A chart representing the plausible integrin heterodimers is shown. The red boxes indicate that only one subunit was overexpressed and the blue boxes indicates that both subunits were overexpressed. (B) The full expanded version of Part A is depicted in Part B. A comprehensive map of heterodimeric integrin targets for 17 different tumor types based on the computational analysis is presented. The bolded subunits represent subunits that are overexpressed compared to normal samples (Figure 4), and are absolutely expressed at a level greater than 10 FPKM (Figure 5). The integrin heterodimers that are colored in red represent receptors for which previously published data exists regarding differential expression and/or usefulness in cancer treatment and diagnosis.

References

    1. Seguin L, Desgrosellier JS, Weis SM, Cheresh DA. Integrins and cancer: regulators of cancer stemness, metastasis, and drug resistance. Trends Cell Biol. 2015;25:234–40. doi: 10.1016/j.tcb.2014.12.006. - DOI - PMC - PubMed
    1. Mori S, Hatori N, Kawaguchi N, Hamada Y, Shih TC, Wu CY, Lam KS, Matsuura N, Yamamoto H, Takada YK, Takada Y. The integrin-binding defective FGF2 mutants potently suppress FGF2 signalling and angiogenesis. Biosci Rep. 2017:37. doi: 10.1042/BSR20170173. - DOI - PMC - PubMed
    1. Saegusa J, Yamaji S, Ieguchi K, Wu CY, Lam KS, Liu FT, Takada YK, Takada Y. The direct binding of insulin-like growth factor-1 (IGF-1) to integrin alphavbeta3 is involved in IGF-1 signaling. J Biol Chem. 2009;284:24106–14. doi: 10.1074/jbc.M109.013201. - DOI - PMC - PubMed
    1. Hamidi H, Pietila M, Ivaska J. The complexity of integrins in cancer and new scopes for therapeutic targeting. Br J Cancer. 2016;115:1017–23. doi: 10.1038/bjc.2016.312. - DOI - PMC - PubMed
    1. Desgrosellier JS, Cheresh DA. Integrins in cancer: biological implications and therapeutic opportunities. Nat Rev Cancer. 2010;10:9–22. doi: 10.1038/nrc2748. - DOI - PMC - PubMed