

Global patterns of interannual climate-fire relationships
- PMID: 30047195
- PMCID: PMC7134822
- DOI: 10.1111/gcb.14405
Global patterns of interannual climate-fire relationships
Abstract
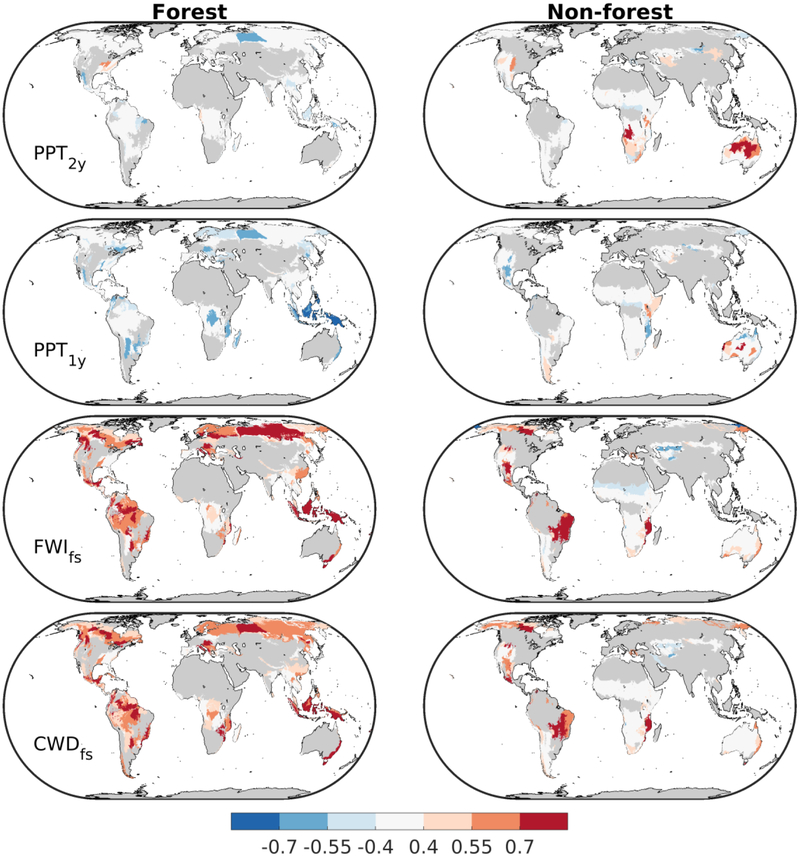
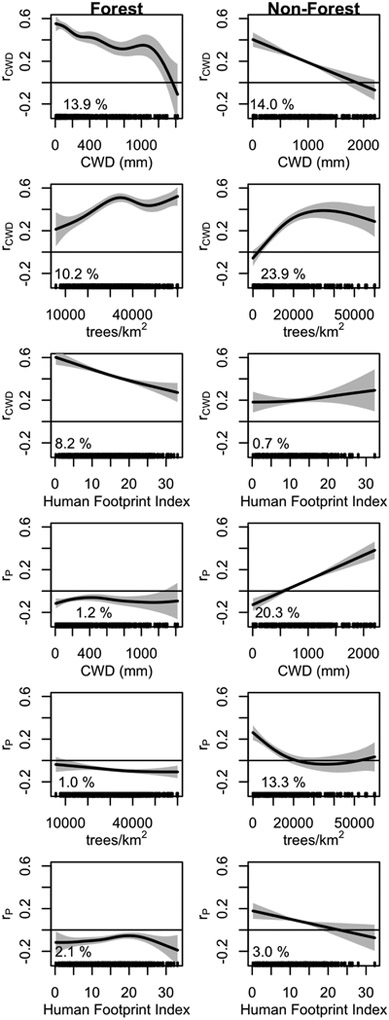
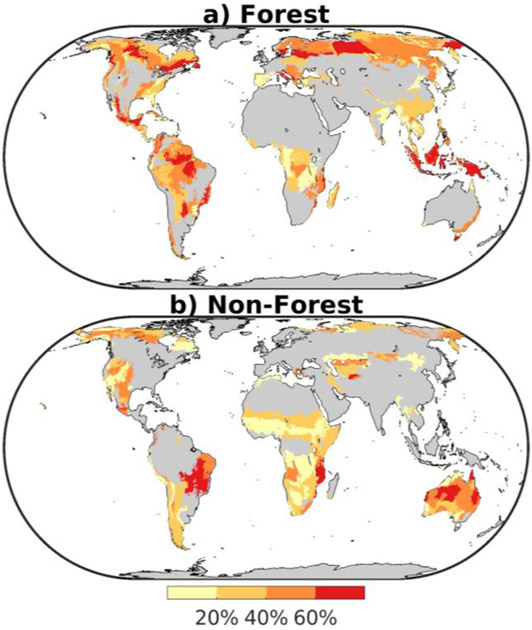
Climate shapes geographic and seasonal patterns in global fire activity by mediating vegetation composition, productivity, and desiccation in conjunction with land-use and anthropogenic factors. Yet, the degree to which climate variability affects interannual variability in burned area across Earth is less understood. Two decades of satellite-derived burned area records across forested and nonforested areas were used to examine global interannual climate-fire relationships at ecoregion scales. Measures of fuel aridity exhibited strong positive correlations with forested burned area, with weaker relationships in climatologically drier regions. By contrast, cumulative precipitation antecedent to the fire season exhibited positive correlations to nonforested burned area, with stronger relationships in climatologically drier regions. Climate variability explained roughly one-third of the interannual variability in burned area across global ecoregions. These results highlight the importance of climate variability in enabling fire activity globally, but also identify regions where anthropogenic and other influences may facilitate weaker relationships. Empirical fire modeling efforts can complement process-based global fire models to elucidate how fire activity is likely to change amidst complex interactions among climatic, vegetation, and human factors.
Keywords: climate; ecoregions; fire; global; modeling.
© 2018 John Wiley & Sons Ltd.
Figures

References
-
- Abatzoglou JT, Balch JK, Bradley BA, & Kolden CA (2018). Human-related ignitions concurrent with high winds promote large wildfires across the USA. International Journal of Wildland Fire, 27, 377–386.
-
- Abatzoglou JT, & Kolden CA (2013). Relationships between climate and macroscale area burned in the western United States. International Journal of Wildland Fire, 22(7), 1003–1020.
-
- Abatzoglou JT, Kolden CA, Balch JK, & Bradley BA (2016). Controls on interannual variability in lightning-caused fire activity in the western US. Environmental Research Letters, 11(4), 45005.
-
- Aldersley A, Murray SJ, & Cornell SE (2011). Global and regional analysis of climate and human drivers of wildfire. Science of the Total Environment, 409(18), 3472–3481. - PubMed
Publication types
MeSH terms
Grants and funding
LinkOut - more resources
Full Text Sources
Other Literature Sources
