. 2018 Jul 26;10(7):1758-1775.
doi: 10.18632/aging.101508.

Epigenetic clock for skin and blood cells applied to Hutchinson Gilford Progeria Syndrome and ex vivo studies

Affiliations

Epigenetic clock for skin and blood cells applied to Hutchinson Gilford Progeria Syndrome and ex vivo studies

Steve Horvath et al. Aging (Albany NY). .

Abstract

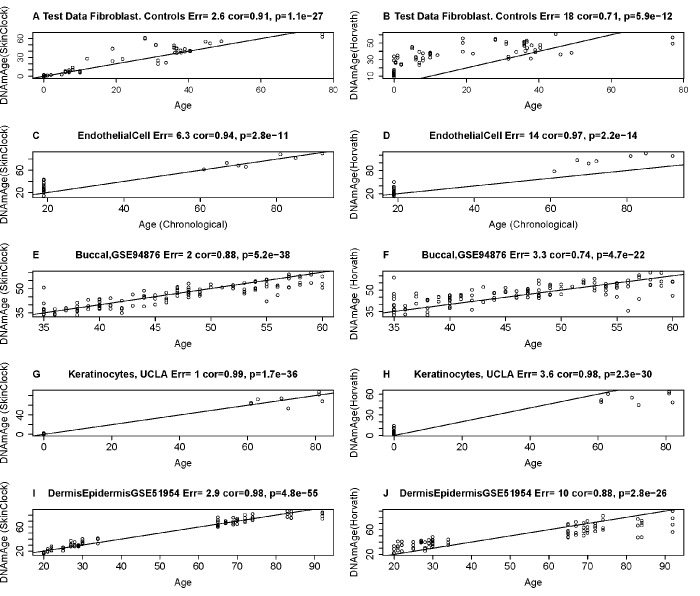
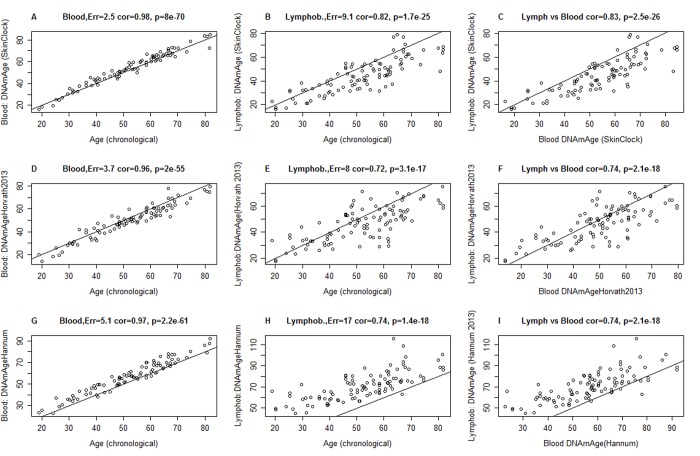
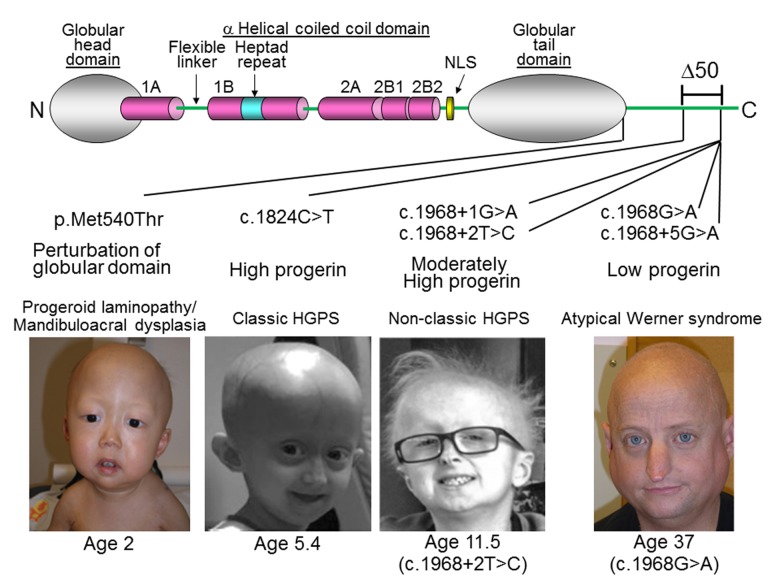
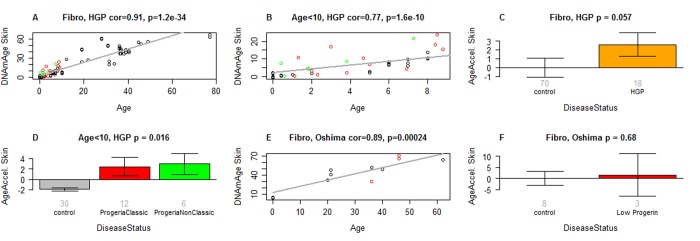
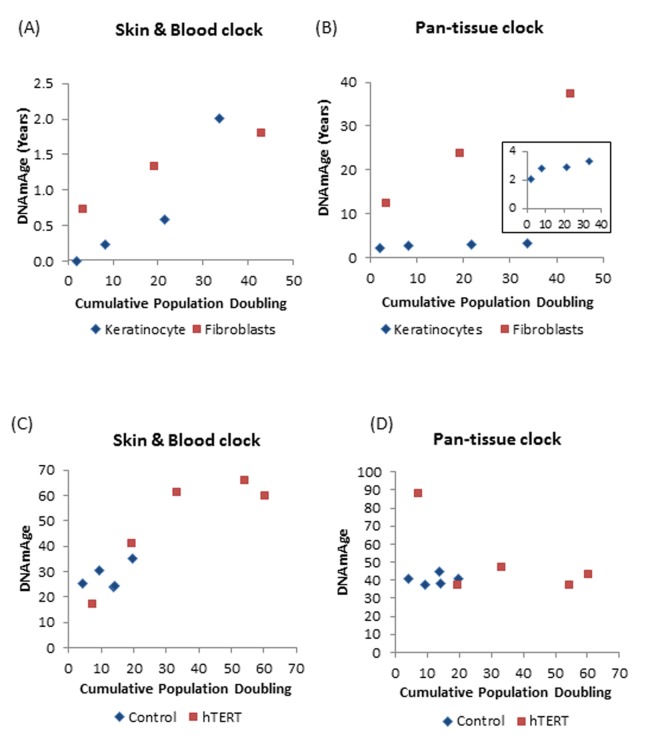
DNA methylation (DNAm)-based biomarkers of aging have been developed for many tissues and organs. However, these biomarkers have sub-optimal accuracy in fibroblasts and other cell types used in ex vivo studies. To address this challenge, we developed a novel and highly robust DNAm age estimator (based on 391 CpGs) for human fibroblasts, keratinocytes, buccal cells, endothelial cells, lymphoblastoid cells, skin, blood, and saliva samples. High age correlations can also be observed in sorted neurons, glia, brain, liver, and even bone samples. Gestational age correlates with DNAm age in cord blood. When used on fibroblasts from Hutchinson Gilford Progeria Syndrome patients, this age estimator (referred to as the skin & blood clock) uncovered an epigenetic age acceleration with a magnitude that is below the sensitivity levels of other DNAm-based biomarkers. Furthermore, this highly sensitive age estimator accurately tracked the dynamic aging of cells cultured ex vivo and revealed that their proliferation is accompanied by a steady increase in epigenetic age. The skin & blood clock predicts lifespan and it relates to many age-related conditions. Overall, this biomarker is expected to become useful for forensic applications (e.g. blood or buccal swabs) and for a quantitative ex vivo human cell aging assay.

Keywords: DNA methylation; Hutchinson-Gilford; epigenetics; fibroblasts; progeria.


Conflict of interest statement

CONFLICTS OF INTEREST: The authors have no conflicts of interest to declare.

Figures

Figure 1
Figure 1
Age estimation accuracy of the skin & blood clock in fibroblasts, keratinocytes, and microvascular endothelial cells. The left and right panels relate chronological age (x-axis) to DNAm Age estimates (y-axis) from the skin & blood clock (A,C,E,G,I) and the pan-tissue clock (Horvath 2013) (B,D,F,H,J) [6], respectively. Each row corresponds to a different tissue/cell type. DNA methylation data from fibroblasts (A,B), microvascular endothelial cells C,D), buccal epithelial cells (E,F), keratinocytes (G,H), and whole skin (dermis/epidermis) samples (I,J). Each panel reports the Pearson correlation coefficient and the error (defined as median absolute deviation between DNAm age and chronological age).
Figure 2
Figure 2
Comparison of DNAm age estimators in whole blood and lymphoblastoid cell line data. The rows correspond to 3 different age estimators: (A,B,C) the novel skin & blood clock (D,E,F), the pan-tissue clock (Horvath 2013) [6], (G,H,I) Hannum clock 9]. Panels in the first and second column report the accuracy in blood (A,D,C) and lymphoblastoid cell lines (B,E,H), respectively. Panels in the third column (C,F,I) report the relationship between DNAm age estimates in blood (x-axis) versus those in lymphoblastoid cell lines (y-axis). Panels report Pearson correlation coefficient and the estimation error, which is defined as median absolute deviation between the DNAm age estimate and chronological age. The lymphoblastoid cell lines were generated from the same individuals for whom whole blood was assessed, which facilitated the comparison in the third column.
Figure 3
Figure 3
LMNA mutations in progeria patients. The diagram shows the structure of lamin A. It consists of globular head domain, linker regions, α-helical coiled coil domain and globular tail domain. Locations of the progeria LMNA mutations in this study were shown with molecular mechanism of mutant lamin A protein and clinical phenotype, as previously reported in [34] (p.Met540Thr) [29], (c.1824C>T) [30], (c.1968+1G>A) [31], (c.1968+2T>C), and [36] (c.2968G>A and c.1968+5G>A). Δ50 indicates the region of deletion in progerin, also present in ZMPSTE24 mutant progeria [32]. Photos were reproduced with permission.
Figure 4
Figure 4
Skin & blood clock analysis of fibroblasts from HGP individuals of the Progeria Research Foundation. (A,B) The new skin & blood clock was used to estimate DNAm age (y-axis) in fibroblasts from HGP individuals and controls. (A) All individuals. (B) Children younger than 10 years old. Dots are colored by disease status: red=classical progeria, green=non-classical progeria, black=controls. The grey line corresponds to a regression line through control individuals. The epigenetic age acceleration effect for each individual (point) corresponds to the vertical distance to the black regression line. The fact that red and green points tend to lie above the grey line indicates that HGP cases exhibit suggestive accelerated epigenetic aging effect. (C) Mean epigenetic age acceleration (y-axis) versus HGP status. By definition, the mean age acceleration measure in controls is zero. (D) Epigenetic age acceleration (y-axis) versus disease status in individuals younger than 10. (E, F) report results for fibroblast samples from atypical Werner syndrome cases (low progerin) provided by co-author Junko Oshima. (E) DNAm age versus chronological age for atypical Werner syndrome samples (colored in red) and controls (colored in black). (F) Epigenetic age acceleration versus disease status. The title of the bar plots also reports a P-value from a nonparametric group comparison test (Kruskal Wallis test). Each bar plot reports the mean value and one standard error.
Figure 5
Figure 5
DNAm age versus population doubling levels. Each panel reports a DNAm age estimate (y-axis) versus cumulative population doubling level, respectively. Plots in the left and right panels correspond to the new skin & blood clock (A,C) and the pan-tissue clock (B,D) respectively. (A,B) Tracking of the epigenetic ages of neonatal fibroblasts (Red squares) and keratinocytes (Blue diamonds) in function of population doubling. Inset graph in (B) is a plot of ages of only the keratinocyte population (C,D). Epigenetic ages of human coronary artery endothelial cells derived from a 26 year old donor, in function of cumulative population doubling. Ages of uninfected control cells, which senesced after cumulative population doubling of 20, are shown in blue while those bearing hTERT, with extended proliferative capacity are in red. The blue dots with the highest cumulative doubling are at points when the cells reached replicative senescence. Cells with hTERT (represented by red squares) do not senesce and the last dots indicate the termination of the experiment.

Comment in

References

    1. Fraga MF, Esteller M. Epigenetics and aging: the targets and the marks. Trends Genet. 2007; 23:413–18. 10.1016/j.tig.2007.05.008 - DOI - PubMed
    1. Rakyan VK, Down TA, Maslau S, Andrew T, Yang TP, Beyan H, Whittaker P, McCann OT, Finer S, Valdes AM, Leslie RD, Deloukas P, Spector TD. Human aging-associated DNA hypermethylation occurs preferentially at bivalent chromatin domains. Genome Res. 2010; 20:434–39. 10.1101/gr.103101.109 - DOI - PMC - PubMed
    1. Teschendorff AE, Menon U, Gentry-Maharaj A, Ramus SJ, Weisenberger DJ, Shen H, Campan M, Noushmehr H, Bell CG, Maxwell AP, Savage DA, Mueller-Holzner E, Marth C, et al.. Age-dependent DNA methylation of genes that are suppressed in stem cells is a hallmark of cancer. Genome Res. 2010; 20:440–46. 10.1101/gr.103606.109 - DOI - PMC - PubMed
    1. Jung M, Pfeifer GP. Aging and DNA methylation. BMC Biol. 2015; 13:7. 10.1186/s12915-015-0118-4 - DOI - PMC - PubMed
    1. Zheng SC, Widschwendter M, Teschendorff AE. Epigenetic drift, epigenetic clocks and cancer risk. Epigenomics. 2016; 8:705–19. 10.2217/epi-2015-0017 - DOI - PubMed