

A biophysically constrained computational model of the action potential of mouse urinary bladder smooth muscle
- PMID: 30048468
- PMCID: PMC6061979
- DOI: 10.1371/journal.pone.0200712
A biophysically constrained computational model of the action potential of mouse urinary bladder smooth muscle
Abstract
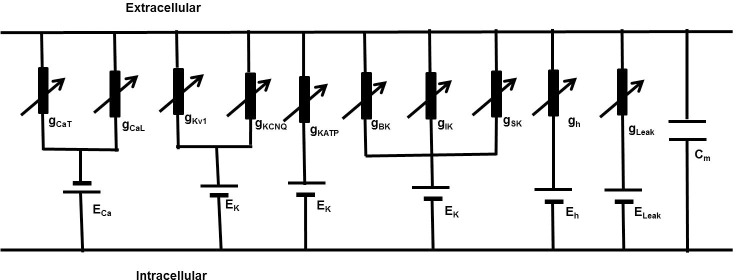
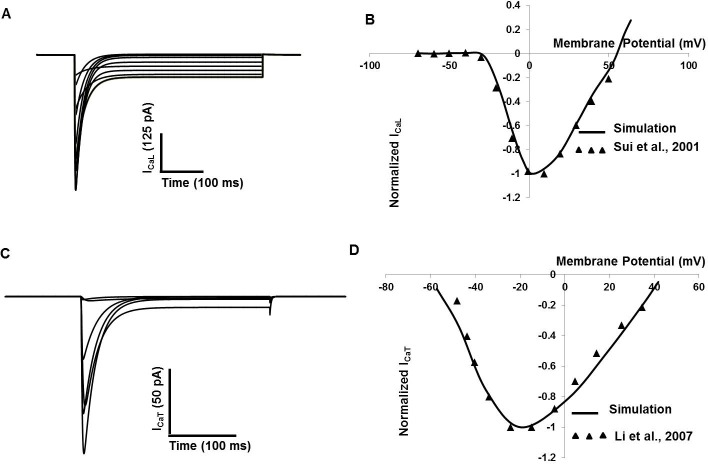
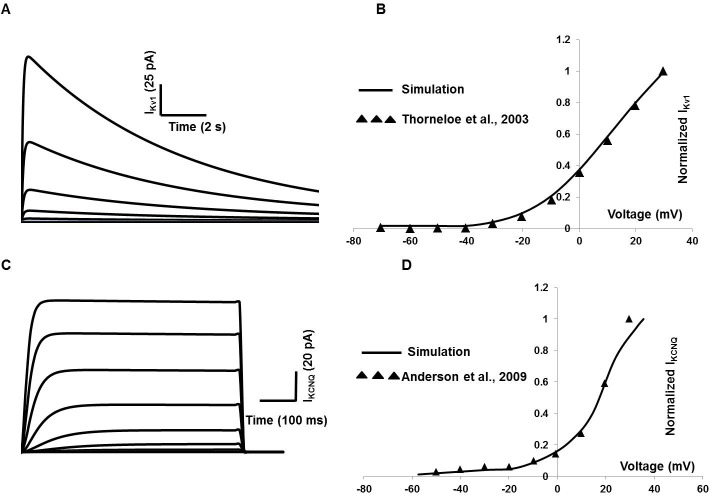
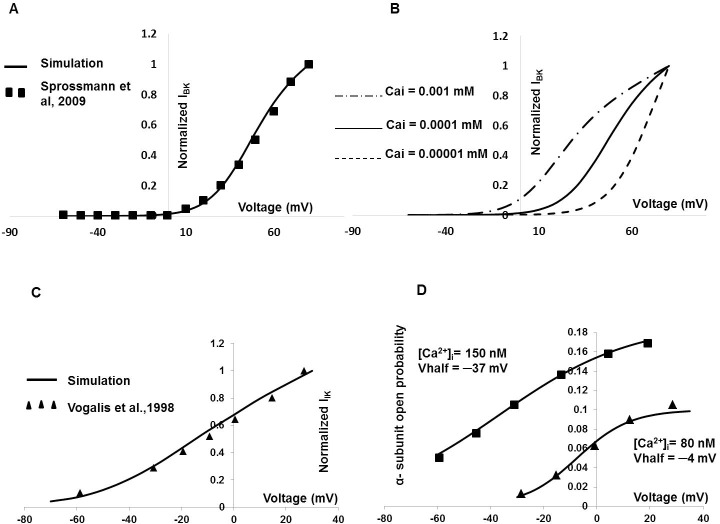
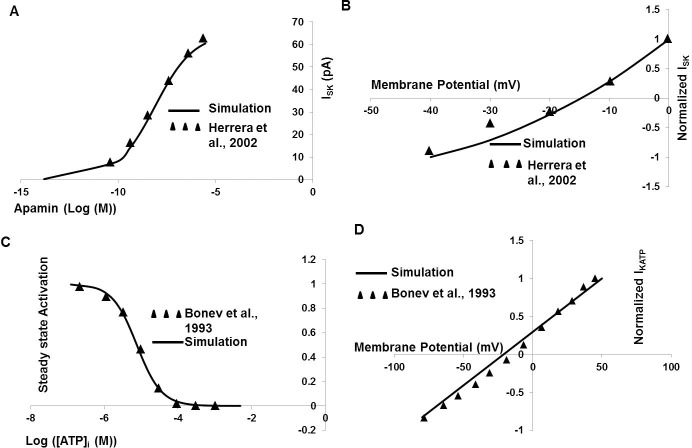
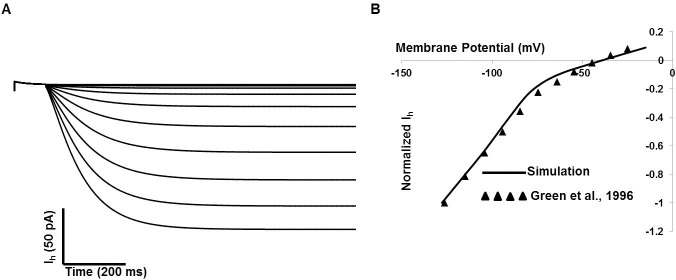
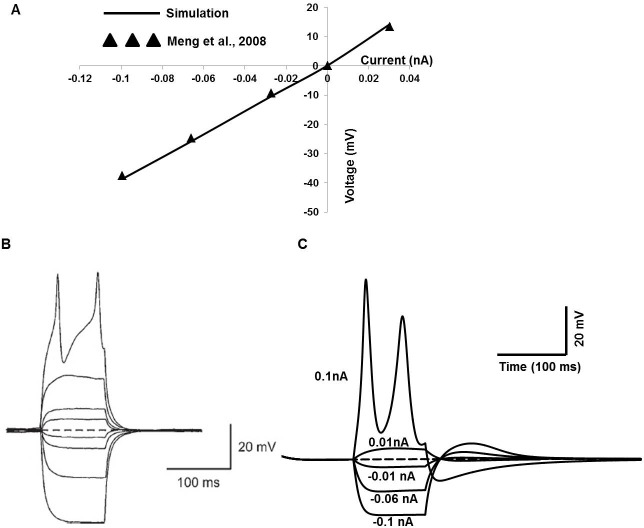
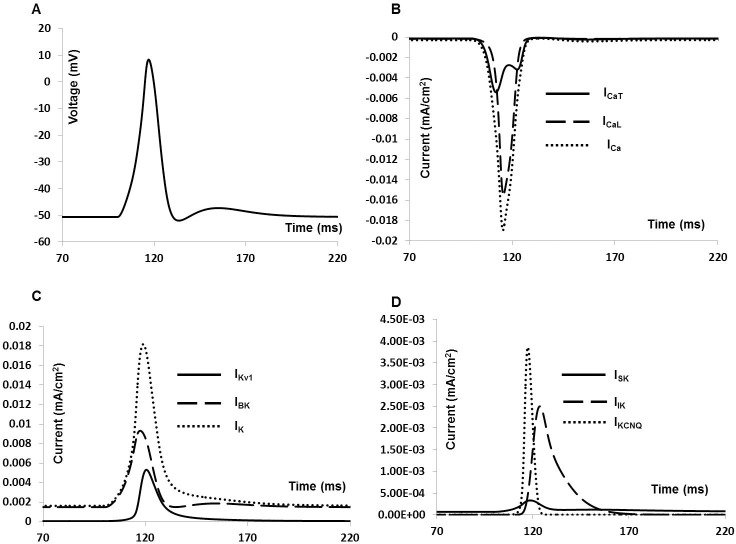
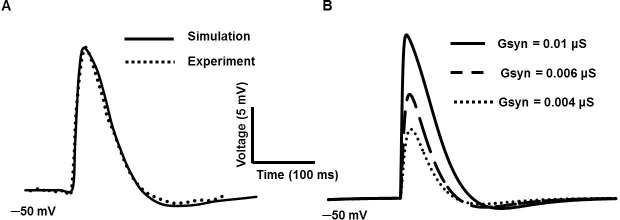
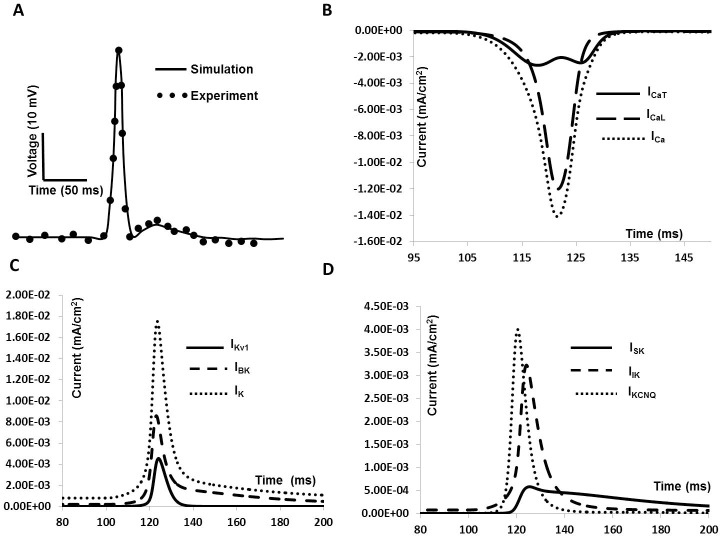
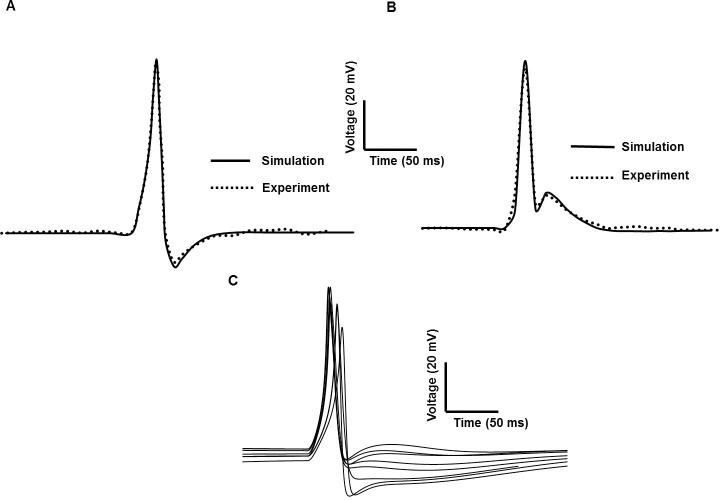
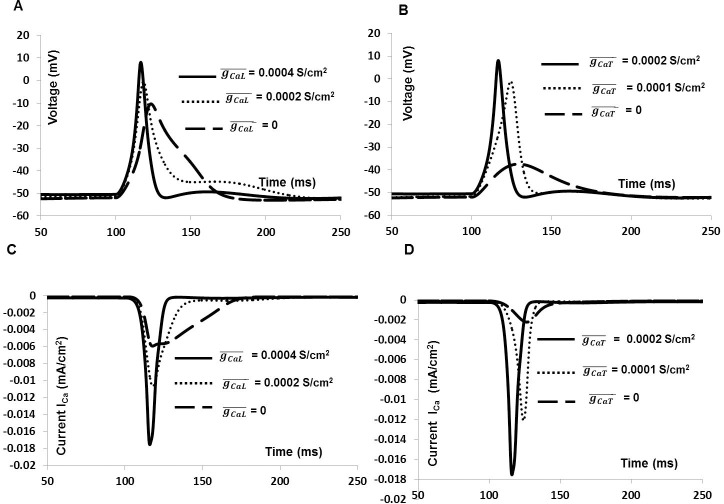
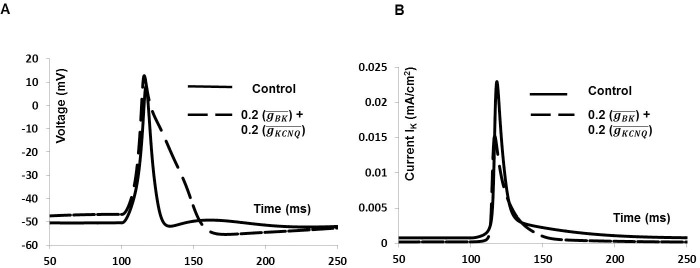
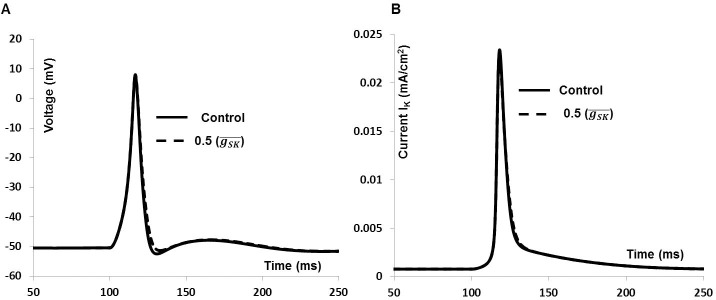
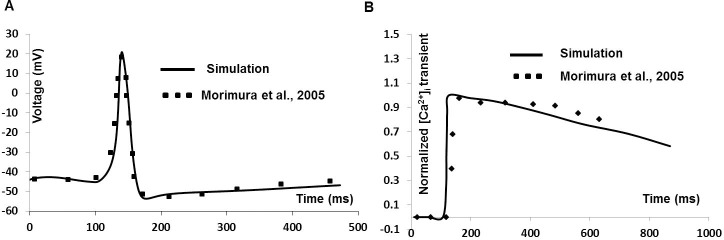
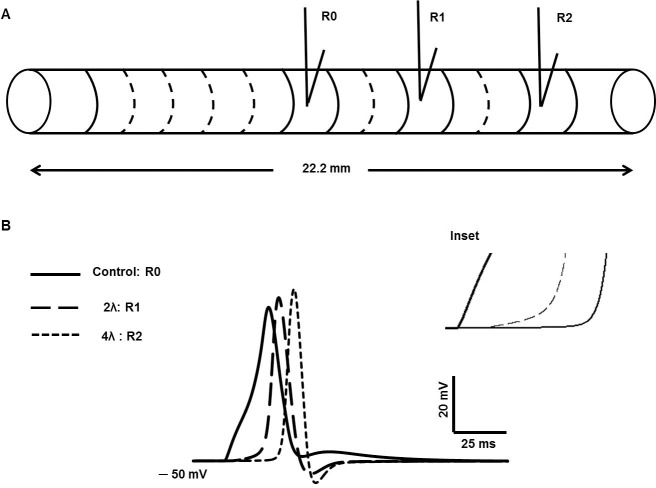
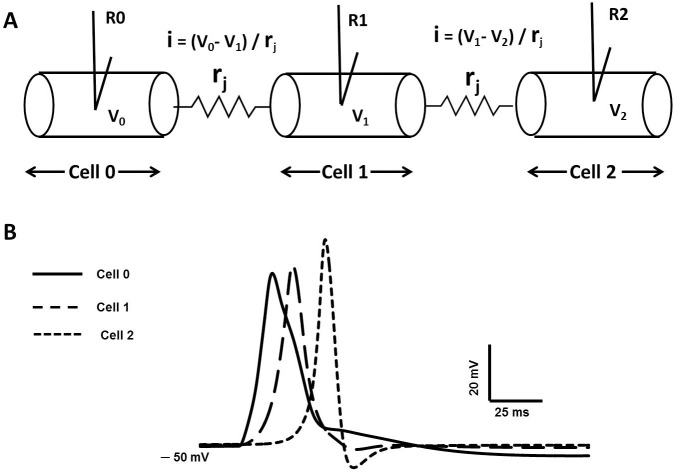
Urinary incontinence is associated with enhanced spontaneous phasic contractions of the detrusor smooth muscle (DSM). Although a complete understanding of the etiology of these spontaneous contractions is not yet established, it is suggested that the spontaneously evoked action potentials (sAPs) in DSM cells initiate and modulate the contractions. In order to further our understanding of the ionic mechanisms underlying sAP generation, we present here a biophysically detailed computational model of a single DSM cell. First, we constructed mathematical models for nine ion channels found in DSM cells based on published experimental data: two voltage gated Ca2+ ion channels, an hyperpolarization-activated ion channel, two voltage-gated K+ ion channels, three Ca2+-activated K+ ion channels and a non-specific background leak ion channel. The ion channels' kinetics were characterized in terms of maximal conductances and differential equations based on voltage or calcium-dependent activation and inactivation. All ion channel models were validated by comparing the simulated currents and current-voltage relations with those reported in experimental work. Incorporating these channels, our DSM model is capable of reproducing experimentally recorded spike-type sAPs of varying configurations, ranging from sAPs displaying after-hyperpolarizations to sAPs displaying after-depolarizations. The contributions of the principal ion channels to spike generation and configuration were also investigated as a means of mimicking the effects of selected pharmacological agents on DSM cell excitability. Additionally, the features of propagation of an AP along a length of electrically continuous smooth muscle tissue were investigated. To date, a biophysically detailed computational model does not exist for DSM cells. Our model, constrained heavily by physiological data, provides a powerful tool to investigate the ionic mechanisms underlying the genesis of DSM electrical activity, which can further shed light on certain aspects of urinary bladder function and dysfunction.
Conflict of interest statement
The authors have declared that no competing interests exist.
Figures
Similar articles
-
Ionic basis for the regulation of spontaneous excitation in detrusor smooth muscle cells of the guinea-pig urinary bladder.Br J Pharmacol. 2003 Sep;140(1):159-69. doi: 10.1038/sj.bjp.0705320. Epub 2003 Aug 11. Br J Pharmacol. 2003. PMID: 12967945 Free PMC article.
-
KV2.1 and electrically silent KV channel subunits control excitability and contractility of guinea pig detrusor smooth muscle.Am J Physiol Cell Physiol. 2012 Jan 15;302(2):C360-72. doi: 10.1152/ajpcell.00303.2010. Epub 2011 Oct 12. Am J Physiol Cell Physiol. 2012. PMID: 21998137 Free PMC article.
-
Large-conductance voltage- and Ca2+-activated K+ channel regulation by protein kinase C in guinea pig urinary bladder smooth muscle.Am J Physiol Cell Physiol. 2014 Mar 1;306(5):C460-70. doi: 10.1152/ajpcell.00325.2013. Epub 2013 Dec 18. Am J Physiol Cell Physiol. 2014. PMID: 24352333 Free PMC article.
-
Role of potassium ion channels in detrusor smooth muscle function and dysfunction.Nat Rev Urol. 2011 Dec 13;9(1):30-40. doi: 10.1038/nrurol.2011.194. Nat Rev Urol. 2011. PMID: 22158596 Free PMC article. Review.
-
Urinary bladder smooth muscle ion channels: expression, function, and regulation in health and disease.Am J Physiol Renal Physiol. 2020 Aug 1;319(2):F257-F283. doi: 10.1152/ajprenal.00048.2020. Epub 2020 Jul 6. Am J Physiol Renal Physiol. 2020. PMID: 32628539 Free PMC article. Review.
Cited by
-
Electrophysiology of Syncytial Smooth Muscle.J Exp Neurosci. 2019 Jan 17;13:1179069518821917. doi: 10.1177/1179069518821917. eCollection 2019. J Exp Neurosci. 2019. PMID: 30733629 Free PMC article. Review.
-
Spontaneous synaptic drive in detrusor smooth muscle: computational investigation and implications for urinary bladder function.J Comput Neurosci. 2019 Dec;47(2-3):167-189. doi: 10.1007/s10827-019-00731-7. Epub 2019 Nov 12. J Comput Neurosci. 2019. PMID: 31712945
-
In Silico Electrophysiological Investigation of Transient Receptor Potential Melastatin-4 Ion Channel Biophysics to Study Detrusor Overactivity.Int J Mol Sci. 2024 Jun 22;25(13):6875. doi: 10.3390/ijms25136875. Int J Mol Sci. 2024. PMID: 38999984 Free PMC article.
-
Effect of Variations in Gap Junctional Coupling on the Frequency of Oscillatory Action Potentials in a Smooth Muscle Syncytium.Front Physiol. 2021 Oct 1;12:655225. doi: 10.3389/fphys.2021.655225. eCollection 2021. Front Physiol. 2021. PMID: 34658901 Free PMC article.
-
A complete biomechanical model of Hydra contractile behaviors, from neural drive to muscle to movement.Proc Natl Acad Sci U S A. 2023 Mar 14;120(11):e2210439120. doi: 10.1073/pnas.2210439120. Epub 2023 Mar 10. Proc Natl Acad Sci U S A. 2023. PMID: 36897982 Free PMC article.
References
-
- Abrams P, Cardozo L, Fall M, Griffiths D, Rosier P, Ulmsten U, et al. The standardisation of terminology of lower urinary tract function: report from the Standardisation Sub-committee of the International Continence Society. American journal of obstetrics and gynecology. 2002. July 31;187(1):116–26. - PubMed
-
- Abrams P. Describing bladder storage function: overactive bladder syndrome and detrusor overactivity. Urology. 2003. November 24;62(5):28–37. - PubMed
-
- Fry CH, Sui GP, Severs NJ, Wu C. Spontaneous activity and electrical coupling in human detrusor smooth muscle: implications for detrusor overactivity?. Urology. 2004. March 31;63(3):3–10. - PubMed
Publication types
MeSH terms
Substances
LinkOut - more resources
Full Text Sources
Other Literature Sources
Molecular Biology Databases
Miscellaneous
