. 2018 Nov;14(8):2644-2655.
doi: 10.1016/j.nano.2018.07.009. Epub 2018 Jul 24.

In vivo biodistribution and toxicology studies of cadmium-free indium-based quantum dot nanoparticles in a rat model

Affiliations

In vivo biodistribution and toxicology studies of cadmium-free indium-based quantum dot nanoparticles in a rat model

Elnaz Yaghini et al. Nanomedicine. 2018 Nov.

Abstract

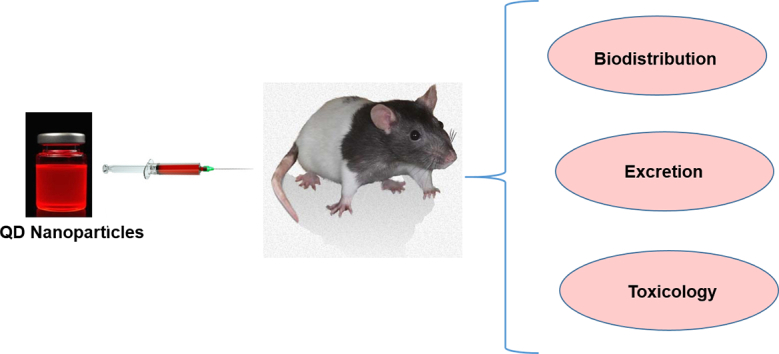
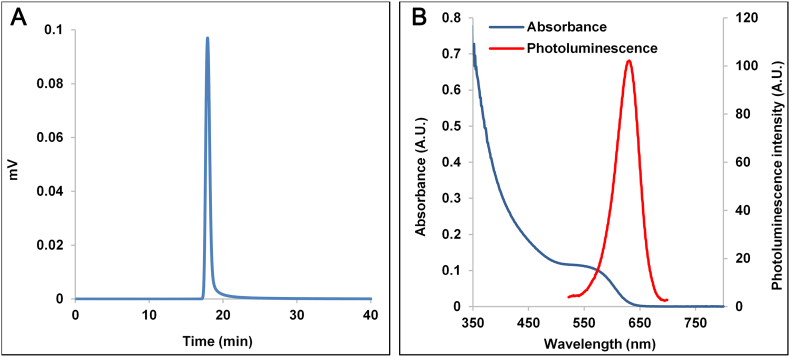
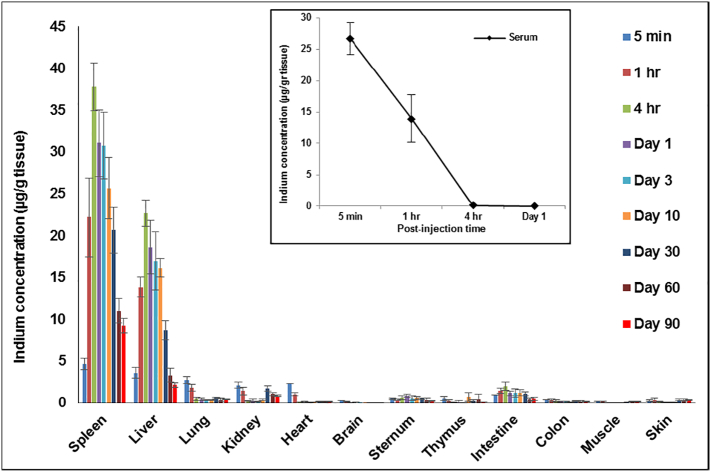
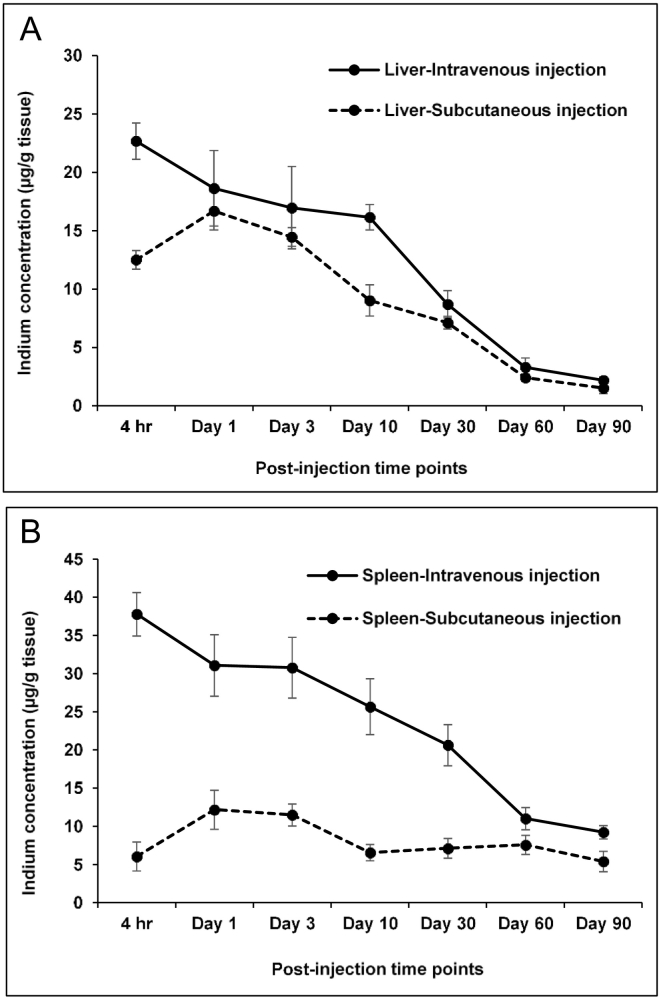
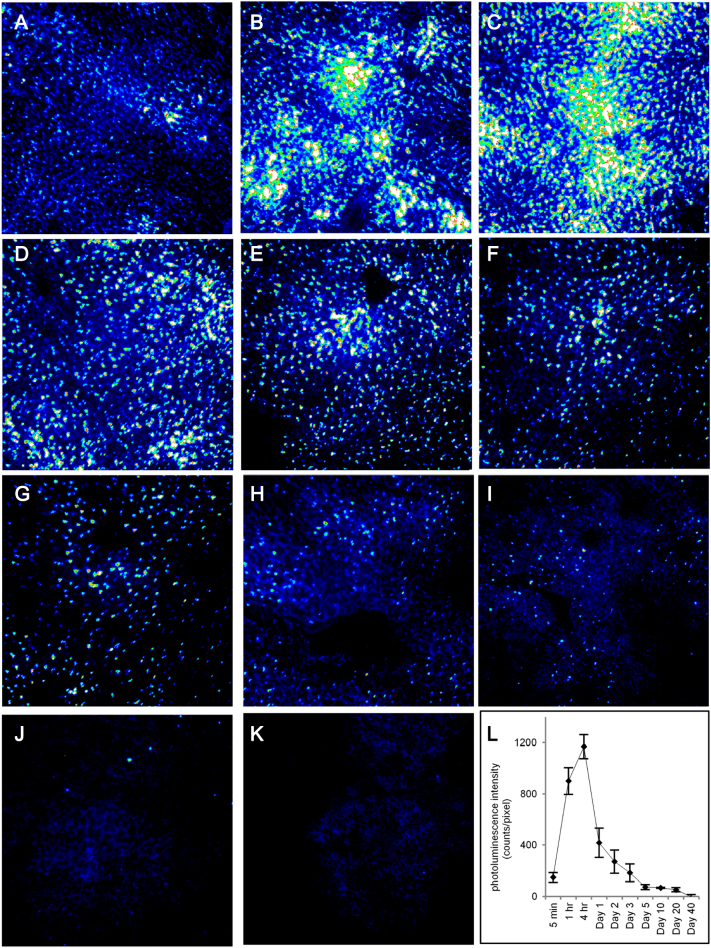
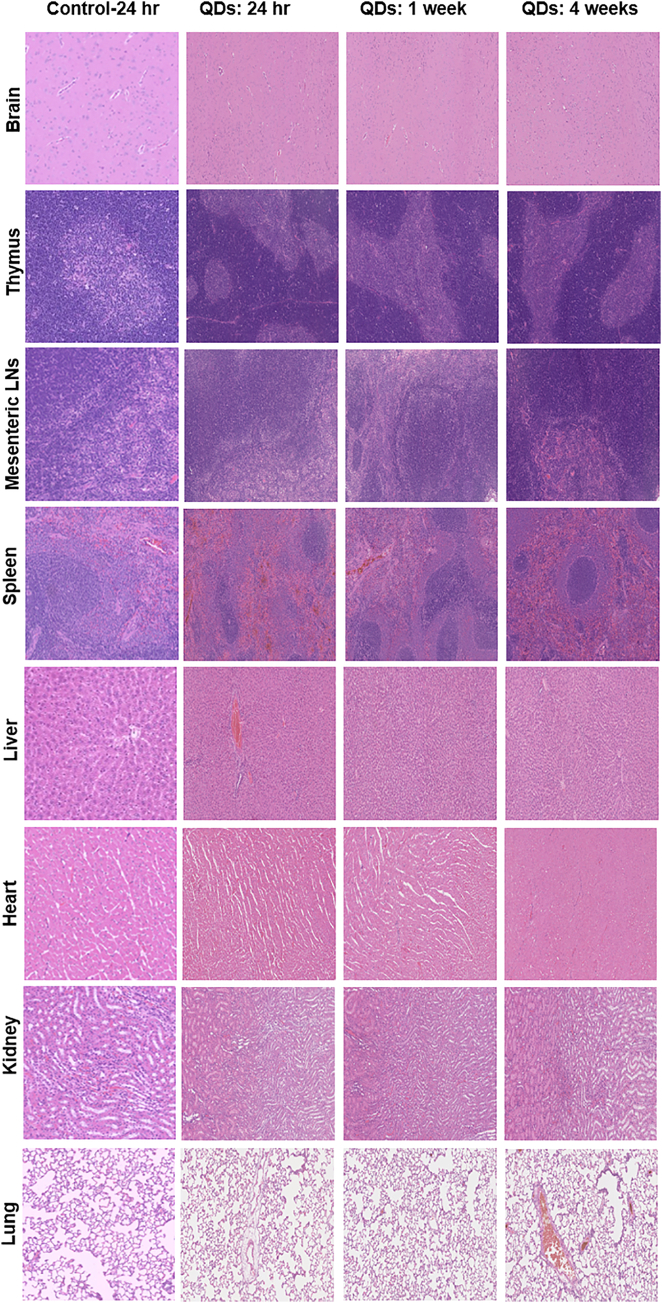
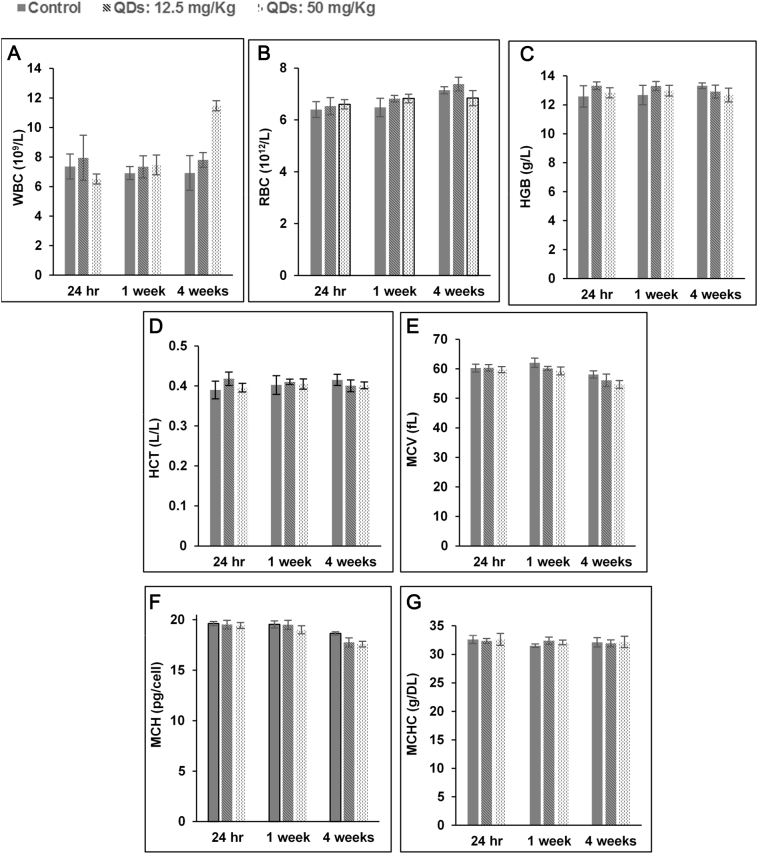
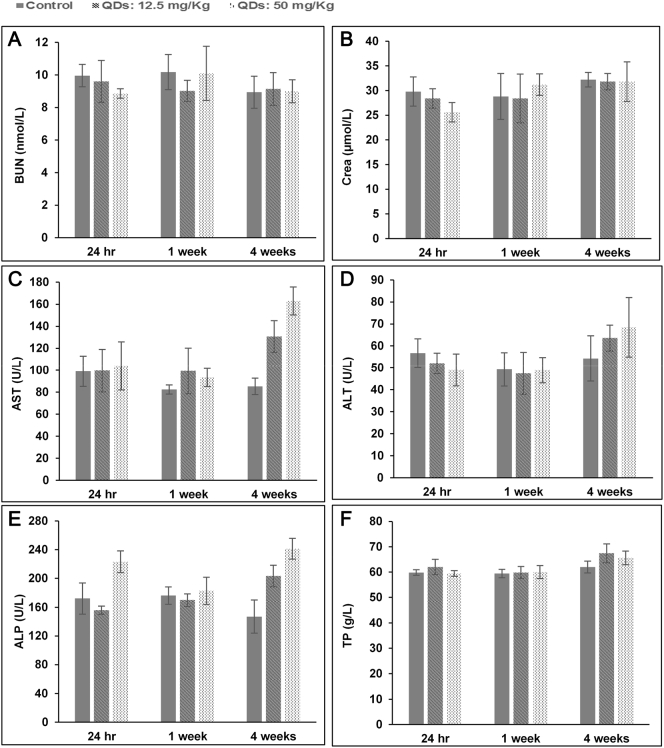
Quantum dot (QD) nanoparticles are highly promising contrast agents and probes for biomedical applications owing to their excellent photophysical properties. However, toxicity concerns about commonly used cadmium-based QDs hinder their translation to clinical applications. In this study we describe the in vivo biodistribution and toxicology of indium-based water soluble QDs in rats following intravenous administration. The biodistribution measured at up to 90 days showed that QDs mainly accumulated in the liver and spleen, with similar elimination kinetics to subcutaneous administration. Evidence for QD degradation in the liver was found by comparing photoluminescence measurements versus elemental analysis. No organ damage or histopathological lesions were observed for the QDs treated rats after 24 h, 1 and 4 weeks following intravenous administration at 12.5 mg/kg or 50 mg/kg. Analysis of serum biochemistry and complete blood counts found no toxicity. This work supports the strong potential of indium-based QDs for translation into the clinic.

Keywords: Biodistribution; Cadmium-free quantum dots; Nanoparticles; Toxicology.


Figures

Unlabelled Image
Graphical abstract
Figure 1
Figure 1
(A) Size exclusion chromatography profiles of bio CFQD® nanoparticles. (B) Absorbance and fluorescence spectra of bio CFQD® nanoparticles in aqueous solution.
Figure 2
Figure 2
In vivo biodistribution analysis over a period of 90 days in Lister Hooded rats following administration of bio CFQD® nanoparticles. The indium concentration in the organs was determined at different time points after intravenous injection of bio CFQD® nanoparticles (12.5 mg/kg) using ICP-MS (n = 5). The inset shows the decay in circulating serum levels in the same animals.
Figure 3
Figure 3
In vivo biodistribution analysis of indium levels over a period of 90 days in Lister Hooded rats following intravenous (12.5 mg/kg) and subcutaneous (7.5 mg/kg) injection of bio CFQD® nanoparticles in (A) liver tissues and (B) spleen tissues. The indium concentration in the organs was determined at different post-injection time points using ICP-MS. The data for subcutaneous injection are replotted from our previous study.
Figure 4
Figure 4
Tissue cryosection fluorescence microscopy showing distribution of photoluminescence from bio CFQD® nanoparticles in the rat liver. Blue corresponds to lower intensity and white to highest, and the same intensity scale was used throughout for direct comparison. QDs were injected at 12.5 mg/kg intravenously and images were obtained at various time intervals post-injection. (A) 5 min; (B) 1 h; (C) 4 h; (D) 24 h; (E) 48 h; (F) 72 h; (G) 5 days; (H) 10 days: (I) 20 days: (J) 40 days: (K) control - without QDs injection. (L) Time-course of integrated mean photoluminescence intensity of bio CFQD® nanoparticles in the cryosections of rat liver using fluorescence microscopy with control baseline level subtracted.
Figure 5
Figure 5
Representative organic histology, the H&E stained images of major organs including brain, thymus, mesenteric lymph nodes, spleen, liver heart, kidney and lung collected from the control untreated rats and QD injected rats following intravenous injection at concentration of 50 mg/kg at 24 h, 1 week, and 4 weeks post-injection.
Figure 6
Figure 6
Hematology results of the bio CFQD® nanoparticles injected intravenously into the rats (n = 5). The results show mean and standard deviation of white blood cells (WBC), red blood cells (RBC), hemoglobin (HGB), hematocrit (HCT), mean corpuscular volume (MCV), mean corpuscular hemoglobin (MCH), mean corpuscular hemoglobin concentration (MCHC).
Figure 7
Figure 7
Blood biochemical results of the nanoparticles following intravenous into rats (n = 5). The results show mean and standard deviation of (A) blood urea nitrogen (BUN), (B) creatinine (Crea), (C) aspartate transaminase (AST), (D) alanine transaminase (ALT), (E) alkaline phosphatase (ALP), (F) total protein.

References

    1. Resch-Genger U., Grabolle M., Cavaliere-Jaricot S., Nitschke R., Nann T. Quantum dots versus organic dyes as fluorescent labels. Nat Methods. 2008;5:763–775. - PubMed
    1. Rosenthal S.J., Chang J.C., Kovtun O., McBride J.R., Tomlinson I.D. Biocompatible quantum dots for biological applications. Chem Biol. 2011;18:10–24. - PMC - PubMed
    1. Yaghini E., Seifalian A.M., MacRobert A.J. Quantum dots and their potential biomedical applications in photosensitization for photodynamic therapy. Nanomedicine. 2009;4:353–363. - PubMed
    1. Chen N., He Y., Su Y., Li X., Huang Q., Wang H. The cytotoxicity of cadmium-based quantum dots. Biomaterials. 2012;33:1238–1244. - PubMed
    1. Li J., Chang Z., Chen X., Gu Z., Zhao F., Chai Z. Toxicity of inorganic nanomaterials in biomedical imaging. Biotechnol Adv. 2014;32:727–743. - PubMed

Publication types

LinkOut - more resources