. 2018 Sep;59(9):1561-1574.
doi: 10.1194/jlr.M080465. Epub 2018 Jul 26.

Lipid imaging for visualizing cilastatin amelioration of cisplatin-induced nephrotoxicity

Affiliations

Lipid imaging for visualizing cilastatin amelioration of cisplatin-induced nephrotoxicity

Estefanía Moreno-Gordaliza et al. J Lipid Res. 2018 Sep.

Abstract

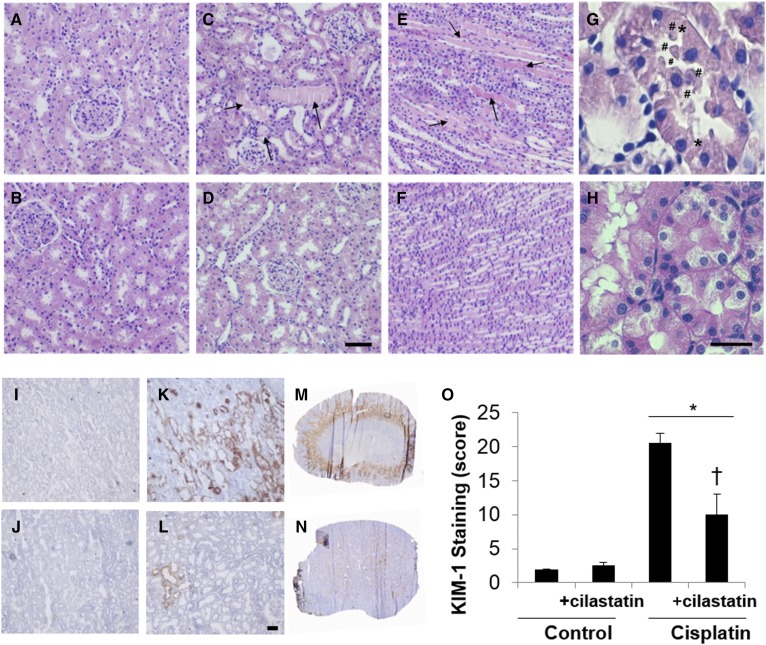
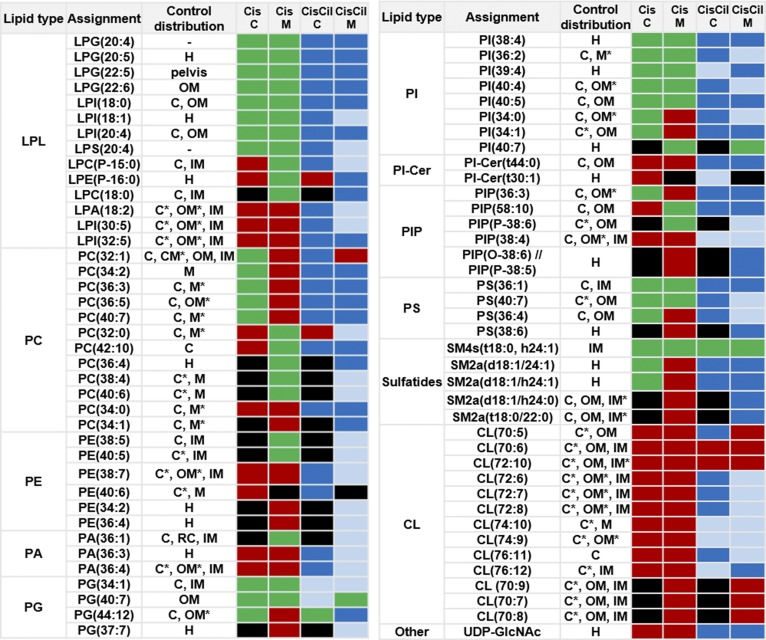
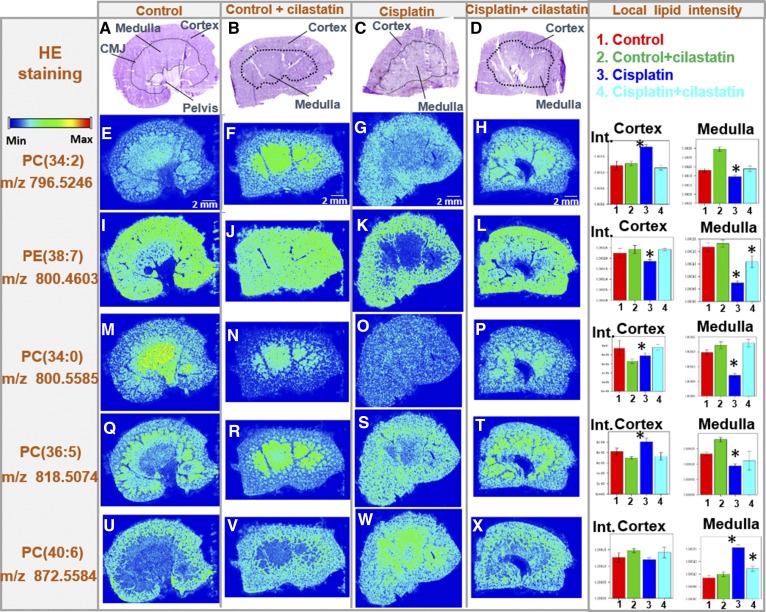
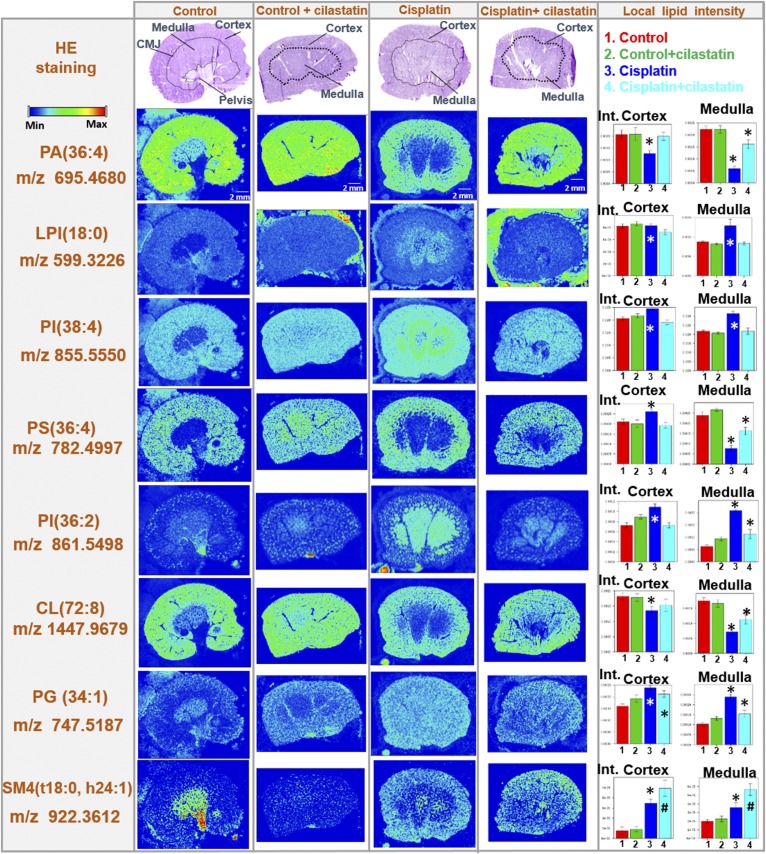
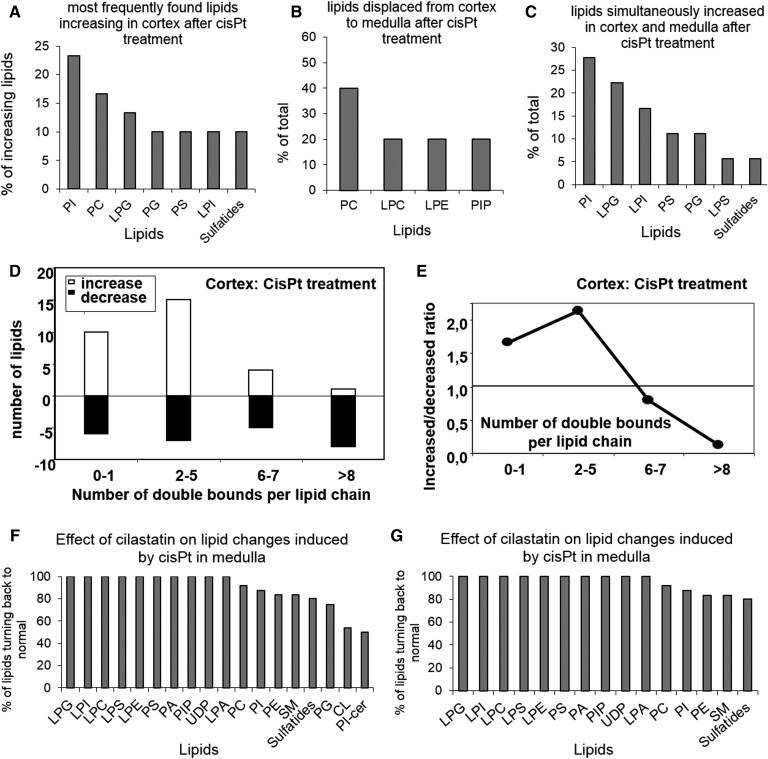
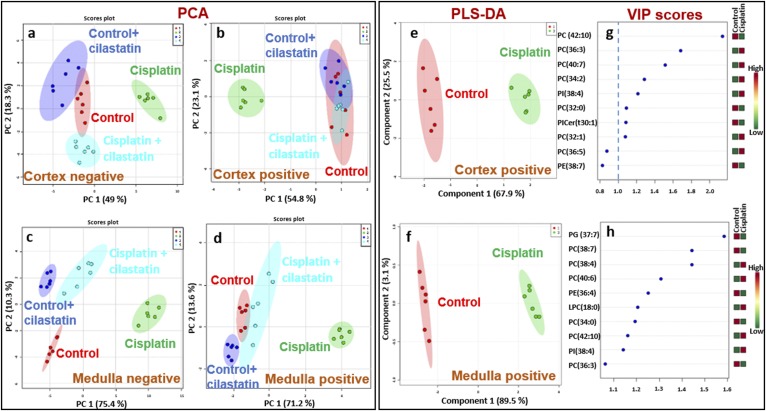
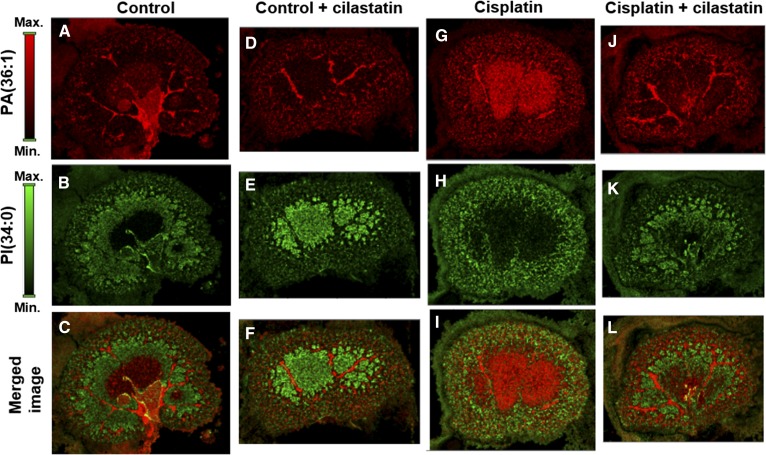
Nephrotoxicity is a major limitation to cisplatin antitumor therapies. Cilastatin, an inhibitor of renal dehydropeptidase-I, was recently proposed as a promising nephroprotector against cisplatin toxicity, preventing apoptotic cell death. In this work, cilastatin nephroprotection was further investigated in a rat model, with a focus on its effect on 76 renal lipids altered by cisplatin, including 13 new cisplatin-altered mitochondrial cardiolipin species. Lipid imaging was performed with MALDI mass spectrometry imaging (MALDI-MSI) in kidney sections from treated rats. Cilastatin was proved to significantly diminish the lipid distribution alterations caused by cisplatin, lipid levels being almost completely recovered to those of control samples. The extent of recovery of cisplatin-altered lipids by cilastatin turned out to be relevant for discriminating direct or secondary lipid alterations driven by cisplatin. Lipid peroxidation induced by cisplatin was also shown to be reduced when cilastatin was administered. Importantly, significant groups separation was achieved during multivariate analysis of cortex and outer-medullary lipids, indicating that damaged kidney can be discerned from the nephroprotected and healthy groups and classified according to lipid distribution. Therefore, we propose MALDI-MSI as a powerful potential tool offering multimolecule detection possibilities to visualize and evaluate nephrotoxicity and nephroprotection based on lipid analysis.

Keywords: cancer; kidney; mass spectrometry; molecular imaging; nephroprotection; renal disease.


Conflict of interest statement

A.L. and A.T. are coinventors of patents describing cilastatin as a nephroprotector against toxic injuries that are assigned to Fundación para la Investigación Biomédica Hospital Gregorio Marañón and licensed to Spherium Biomed S.L.

Figures

Fig. 1.
Fig. 1.
Cilastatin prevents cisplatin-induced morphological lesions and reduces the expression of the early renal damage marker KIM-1. The 20× microscope images for HE-stained kidney sections for control (cortex) (A), control+cilastatin (cortex) (B), cisplatin (cortex, C; and medulla, E), cisplatin + cilastatin (cortex, D; and medulla, F). The 60× magnified images are displayed in for cortex areas in cisplatin (G) and cisplatin+cilastatin (H). Cisplatin-induced signs of damage are depicted as follows: hyaline casts are indicated with arrows; # denotes cell debris detachment; and * represents loss of intercellular junctions. D, H: Scale bars represent 100 (D) or 25 (H) µm. Microscopy images for immunostained kidney sections for KIM-1 detection visualized at 20× are compared for control (I), control + cilastatin (J), cisplatin (K), and cilastatin + cisplatin (L). Whole kidney images for cisplatin-treated (M) and cilastatin + cisplatin-treated (N) rats. L: Scale bar represents 50 µm size. O: Quantitative results for KIM-1 staining are expressed as mean ± SEM; n = 4 animals per group. * P < 0.05 versus control and control+cilastatin groups; P < 0.02 versus cisplatin group.
Fig. 2.
Fig. 2.
Protective effect of cilastatin against cisplatin-induced alterations on cortical and medullary renal lipids. MALDI-MSI relative quantification results are shown for 77 species (76 lipids), according to their lipid class, for control rat kidney versus cisplatin (Cis) or cisplatin+ cilastatin (CisCil)-treated kidney in cortex (C) and medulla (M). The effect of cisplatin and cilastatin with respect to control lipid levels (with FDR < 0.05) is presented with the following color code: red, decrease versus control; green, increase versus control; black, no change versus control; blue, total recovery versus control levels; light blue, partial recovery versus control levels. Control kidneys lipid location is presented with the following abbreviations: C, cortex; CM, corticomedullary junction; H, homogeneous distribution; IM, inner medulla; M, medulla (including OM and IM); OM, outer medulla; RC, renal column. * denotes kidney region with the highest lipid intensity, when present in several regions.
Fig. 3.
Fig. 3.
Cilastatin protects against cisplatin-induced lipid alterations: structural lipids (PC and PE) found in positive ion mode. HE-stained kidney sections images are displayed (A–D for control, control+cilastatin, cisplatin, and cisplatin+cilastatin, respectively) along with the delimited cortex, medulla, and corticomedullary junction (CMJ) regions. Their respective MALDI-MSI images in positive-ion mode for selected lipid distributions have been included below each HE image: PC(34:2) (E–H), PE(38:7) (I–L), PC(34:0) (M–P), PC(36:5) (Q–T), and PC(40:6) (U–X). Color-scale bar is shown for lipid images. Right: Bar charts for the local lipid intensities observed for the four groups in either kidney cortex or medulla are displayed next to the lipid distribution images for each of the lipid species selected. Control (1), control+cilastatin (2), cisplatin (3), and cisplatin+cilastatin (4) groups are represented in red, green, blue, and cyan, respectively. * FDR < 0.05 versus all other groups; # FDR < 0.05 versus control group.
Fig. 4.
Fig. 4.
Cilastatin protects against cisplatin-induced lipid alterations: lipids detected in negative ion mode. HE-stained kidney sections images are displayed (A–D for control, control+cilastatin, cisplatin, and cisplatin+cilastatin, respectively) along with the delimited cortex, medulla, and corticomedullary junction (CMJ) regions. Their respective MALDI-MSI images in negative-ion mode for selected lipid distributions have been included below each HE image: PA(36:4), LPI(18:0), PI(38:4), PS(36:4), PI(36:2), CL(72:8), PG(34:1), and SM4(t18:0, h24:1). Color-scale bar is shown for lipid images. Right: Bar charts for the local lipid intensities observed for the four groups in either kidney cortex or medulla are displayed next to the lipid distribution images for each of the lipid species selected. Control (1), control+cilastatin (2), cisplatin (3), and cisplatin+cilastatin (4) groups are represented in red, green, blue, and cyan, respectively. * FDR < 0.05 versus all other groups; # FDR < 0.05 versus control group.
Fig. 5.
Fig. 5.
Effect of cisplatin on renal lipids distribution, according to lipid class and number of acyl-chain double bonds, and the protective effect of cilastatin. Percentage of renal species according to lipid class showing an increase in cortex (A), a displacement from cortex to medulla (B), and a simultaneous increase in cortex and medulla (C) after cisplatin (cisPt) treatment. D: Percentage of lipids increasing (open bars) and decreasing (filled bars) in renal cortex after cisplatin treatment according to the amount of double bounds in the acyl chains. E: Ratio of increased versus decreased lipids in cortex after cisplatin treatment, according to the amount of double bounds in the acyl chains. The restoring effect of cilastatin against cisplatin-induced changes according to lipid class is displayed in F and G for cortex and medulla, respectively.
Fig. 6.
Fig. 6.
Multivariate analysis shows that protected kidney (treated with both cilastatin and cisplatin) shares lipid features with control samples, separating from the cisplatin-treated group. PCA 2D score plots are shown for negative-ion mode lipids in cortex (A) and outer medulla (C) and positive-ion mode lipids in cortex (B) and outer medulla (D) for ROIs of the four groups of samples: control (red), control+cilastatin (green), cisplatin (green), and cisplatin+cilastatin (cyan). The 95% confidence areas are displayed for each group. PLS-DA 2D score plots are also shown for control (red) versus cisplatin (green) groups for cortex (E) and medulla (F) lipids detected in positive mode, along with the main lipid features ranked by VIP scores (G and H, respectively). A 1.0 cut-off for VIP scores is depicted in G and H.
Fig. 7.
Fig. 7.
Combined lipid species MALDI imaging for the assessment of renal damage and nephroprotection. MALDI-MSI images in negative-ion mode are presented for PA(36:1) at m/z 701.5145 (A, D, G, and J) and PI(34:0) at m/z 837.5529 (B, E, H, and K) and the merged image for both lipids (C, F, I, and L) for control, control+cilastatin, cisplatin, and cisplatin+cilastatin kidney slices, respectively. Color-scale bars are shown for both lipids.

References

    1. Pabla N., and Dong Z.. 2008. Cisplatin nephrotoxicity: mechanisms and renoprotective strategies. Kidney Int. 73: 994–1007. - PubMed
    1. Kelland L. 2007. The resurgence of platinum-based cancer chemotherapy. Nat. Rev. Cancer. 7: 573–584. - PubMed
    1. Karasawa T., and Steyger P. S.. 2015. An integrated view of cisplatin-induced nephrotoxicity and ototoxicity. Toxicol. Lett. 237: 219–227. - PMC - PubMed
    1. Marullo R., Werner E., Degtyareva N., Moore B., Altavilla G., Ramalingam S. S., and Doetsch P. W.. 2013. Cisplatin induces a mitochondrial-ROS response that contributes to cytotoxicity depending on mitochondrial redox status and bioenergetic functions. PLoS One. 8: e81162. - PMC - PubMed
    1. Messori L., and Merlino A.. 2016. Cisplatin binding to proteins: a structural perspective. Coord. Chem. Rev. 315: 67–89.

Publication types

LinkOut - more resources