

Mitochondrial inner membrane permeabilisation enables mtDNA release during apoptosis
- PMID: 30049712
- PMCID: PMC6120664
- DOI: 10.15252/embj.201899238
Mitochondrial inner membrane permeabilisation enables mtDNA release during apoptosis
Abstract
During apoptosis, pro-apoptotic BAX and BAK are activated, causing mitochondrial outer membrane permeabilisation (MOMP), caspase activation and cell death. However, even in the absence of caspase activity, cells usually die following MOMP Such caspase-independent cell death is accompanied by inflammation that requires mitochondrial DNA (mtDNA) activation of cGAS-STING signalling. Because the mitochondrial inner membrane is thought to remain intact during apoptosis, we sought to address how matrix mtDNA could activate the cytosolic cGAS-STING signalling pathway. Using super-resolution imaging, we show that mtDNA is efficiently released from mitochondria following MOMP In a temporal manner, we find that following MOMP, BAX/BAK-mediated mitochondrial outer membrane pores gradually widen. This allows extrusion of the mitochondrial inner membrane into the cytosol whereupon it permeablises allowing mtDNA release. Our data demonstrate that mitochondrial inner membrane permeabilisation (MIMP) can occur during cell death following BAX/BAK-dependent MOMP Importantly, by enabling the cytosolic release of mtDNA, inner membrane permeabilisation underpins the immunogenic effects of caspase-independent cell death.
Keywords: BAX/BAK; apoptosis; cGAS‐STING; mitochondria; mtDNA.
© 2018 The Authors. Published under the terms of the CC BY 4.0 license.
Figures
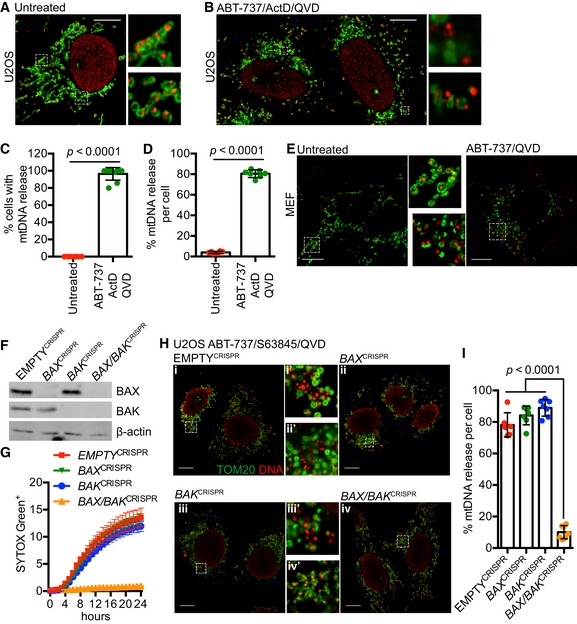
Fixed super‐resolution Airyscan images of U2OS cells immunostained with anti‐TOM20 (green) and anti‐DNA (red) antibodies. Scale bar = 10 μm. Representative images from three independent experiments.
Airyscan images of U2OS cells treated with 10 μM ABT‐737, 1 μM ActD and 20 μM qVD‐OPh for 3 h, immunostained with anti‐TOM20 and anti‐DNA antibodies. Scale bar = 10 μm. Representative images from three independent experiments.
Quantification of cells exhibiting > 10% mtDNA release following treatment with 10 μM ABT‐737, 1 μM ActD and 20 μM qVD‐OPh. Data are expressed as mean ± SD from three independent experiments and analysed by Student's t‐test.
Quantification of the extent of mitochondrial DNA (mtDNA) nucleoid release per cell following treatment with 10 μM ABT‐737, 1 μM ActD and 20 μM qVD‐OPh. Data are expressed as mean ± SD from two independent experiments and analysed by Student's t‐test.
Airyscan images of MEF cells untreated or treated with 10 μM ABT‐737 and 20 μM qVD‐OPh for 3 h, immunostained with anti‐TOM20 and anti‐DNA antibodies. Scale bar = 10 μm. Representative images from three independent experiments.
BAX and BAK expression levels in U2OS cells with CRISPR‐Cas9‐mediated deletion of BAX, BAK or BAX/BAK.
U2OS cells with BAX, BAK or BAX/BAK deletion by CRISPR‐Cas9 treated with 10 μM ABT‐737 and 2 μM S63845 and analysed for cell viability using an IncuCyte live‐cell imager and SYTOX Green exclusion. Data are expressed as mean ± SEM, representative of three independent experiments, and have been normalised to starting confluency.
Airyscan images of U2OS (i) control cells or with CRISPR‐Cas9‐mediated deletion of either (ii) BAX, (iii) BAK or (iv) BAX and BAK treated with 10 μM ABT‐737, 2 μM S63845 and 20 μM qVD‐OPh for 3 h. Scale bar = 10 μm. Representative images from three independent experiments.
Quantification of mtDNA nucleoid release per cell in U2OS EMPTYCRISPR, BAX CRISPR, BAK CRISPR and BAX/BAK CRISPR cells. Data are expressed as mean ± SD from three independent experiments and analysed using Student's t‐test.
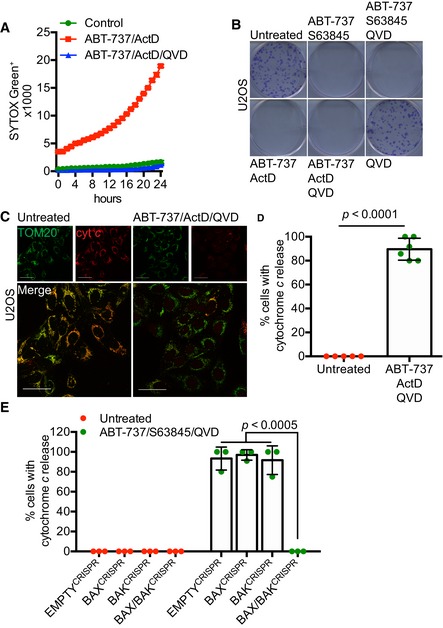
U2OS cells treated with 10 μM ABT‐737 and 1 μM ActD ± 20 μM qVD‐OPh. Cell viability was analysed using an IncuCyte live‐cell imager and SYTOX Green exclusion. Data are expressed as mean ± SEM, representative of three independent experiments.
Clonogenic survival assay of U2OS cells treated with 10 μM ABT‐737 and 2 μM S63845 ± 20 μM qVD‐OPh or 10 μM ABT‐737 and 1 μM ActD ± 20 μM qVD‐OPh. Representative images from three independent experiments.
Airyscan images of U2OS cells treated with 10 μM ABT‐737, 1 μM ActD and 20 μM qVD‐OPh for 3 h, immunostained with anti‐TOM20 (green) and anti‐cytochrome c (red). Scale bar = 10 μm. Representative images from three independent experiments.
Quantification of cytochrome c release from mitochondria. Data are expressed as mean ± SD from three independent experiments and analysed using Student's t‐test.
Quantification of cytochrome c release from BAX‐, BAK‐, and BAX/BAK‐deleted cells. Data are expressed as mean ± SD from three independent experiments and analysed using Student's t‐test.
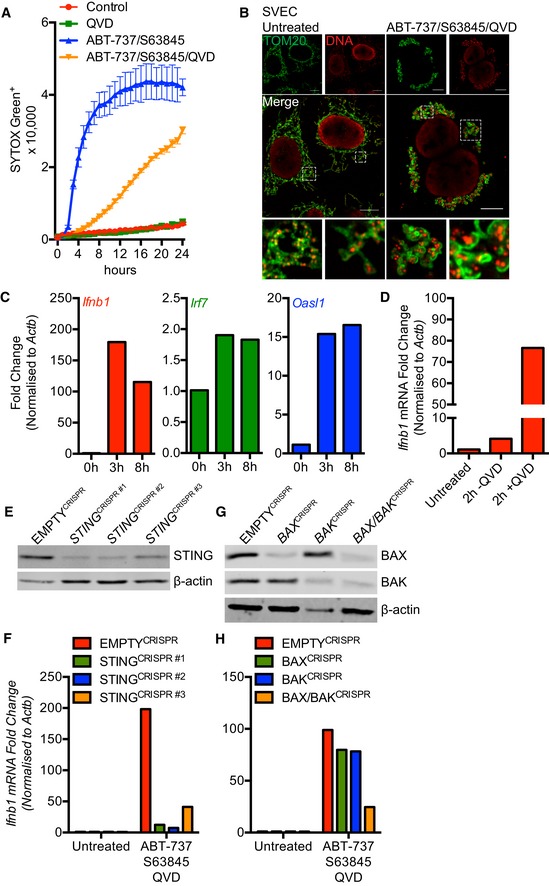
SVEC cells treated with 10 μM ABT‐737 and 10 μM S63845 ± 20 μM qVD‐OPh. Cell viability was analysed using an IncuCyte live‐cell imager and SYTOX Green exclusion. Data are expressed as mean ± SEM, representative of two independent experiments.
Airyscan images of SVEC cells treated with 10 μM ABT‐737, 10 μM S63845 and 20 μM qVD‐OPh for 3 h, immunostained with anti‐TOM20 and anti‐DNA antibodies. Scale bar = 10 μm. Representative images from three independent experiments.
Ifnb1, Irf7 and Oasl1 mRNA expression in SVEC cells treated with 10 μM ABT‐737, 10 μM S63845 and 20 μM qVD‐OPh for 3 h. Data are representative of three independent experiments.
Ifnb1 mRNA expression in SVEC cells treated with 10 μM ABT‐737, 10 μM S63845 ± 20 μM qVD‐OPh for 2 h. Data are representative of two independent experiments.
STING expression in CRISPR‐Cas9‐mediated STING‐deleted SVEC cells using three independent sgRNA sequences.
Ifnb1 mRNA expression in STING CRISPR‐Cas9‐deleted SVEC cells treated with 10 μM ABT‐737, 10 μM S63845 and 20 μM qVD‐OPh for 3 h. Data are representative of two independent experiments.
BAX and BAK expression in SVEC cells harbouring CRISPR‐Cas9‐mediated deletion of BAX, BAK or BAX/BAK.
Ifnb1 mRNA expression in BAX, BAK or BAX/BAK CRISPR‐Cas9‐deleted SVEC cells treated with 10 μM ABT‐737, 10 μM S63845 and 20 μM qVD‐OPh for 3 h. Data are representative of two independent experiments.
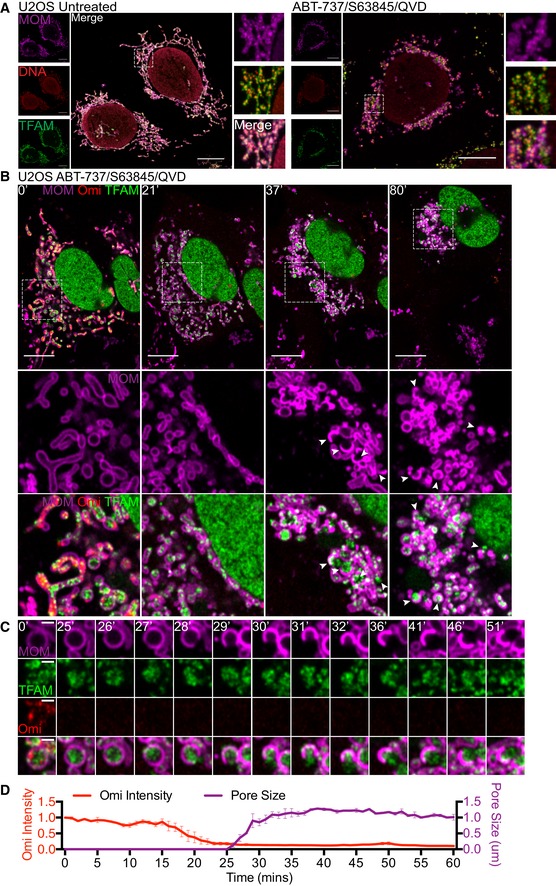
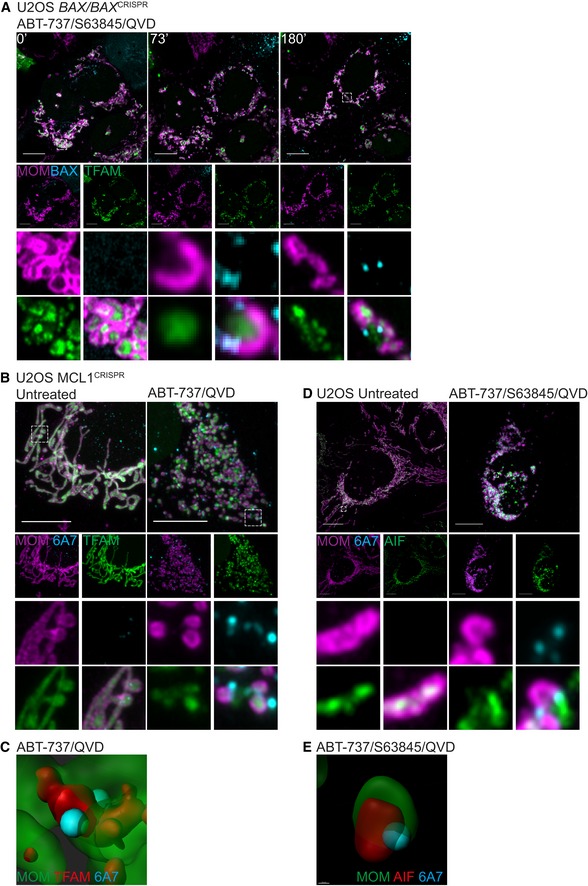
Airyscan images of U2OS cells stably expressing JF646‐MOM (magenta) treated with 10 μM ABT‐737, 2 μM S63845 and 20 μM qVD‐OPh for 3 h, immunostained with anti‐DNA and anti‐TFAM antibodies. Scale bar = 10 μm. Representative images from two independent experiments.
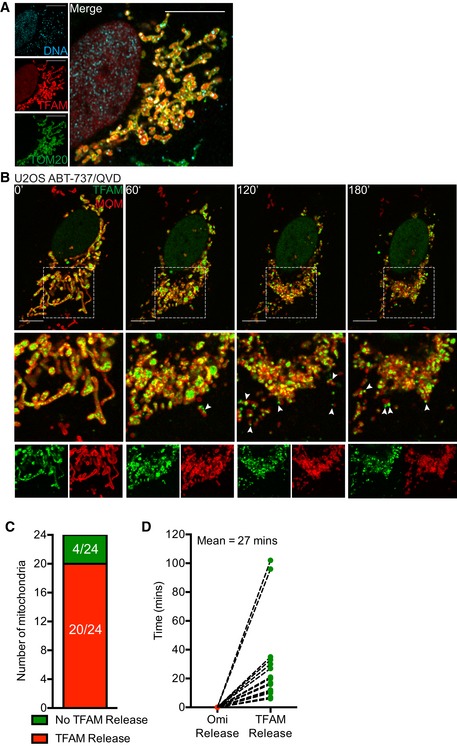
Live‐cell Airyscan imaging of U2OS cells stably expressing JF646‐MOM (magenta) and Omi‐mCherry (red) and transiently expressing TFAM‐mClover (green). Cells were treated with 10 μM ABT‐737, 10 μM S63845 and 20 μM qVD‐OPh at t = 0. Arrows denote mitochondria which show TFAM release. Scale bar = 10 μm. See Video EV4. Numbers indicate time in minutes.
Zoom of a single mitochondrion from Fig 3B and Video EV4. Scale bar = 1 μm. Numbers indicate time in minutes.
Loss of Omi intensity as assessed by standard deviation of the Omi signal across the cell and pore size plotted against time. Data are from three mitochondria (pore size) or three cells (Omi release) from two independent experiments and are expressed as mean ± SEM.
Airyscan image of U2OS cells transfected with TFAM‐mScarlet and immunostained with anti‐TOM20 and anti‐DNA antibodies. Scale bar = 10 μm. Representative images from two independent experiments.
Live‐cell Airyscan imaging of U2OS cells stably expressing JF646‐MOM and transiently expressing TFAM‐mClover. Cells were treated with 10 μM ABT‐737 and 20 μM qVD‐OPh at t = 0. Scale bar = 10 μm. See [Link], [Link]. Numbers indicate time in minutes. Arrowheads indicate instances of released TFAM.
Quantification of mitochondria which do or do not release TFAM as assessed by eye from live‐cell Airyscan imaging, including Fig 3B and Video EV4. Data are from four cells across two independent experiments.
Time of Omi release and TFAM released were assessed by eye from live‐cell Airyscan imaging, including Fig 3B and Video EV4. Data are from four cells across two independent experiments.
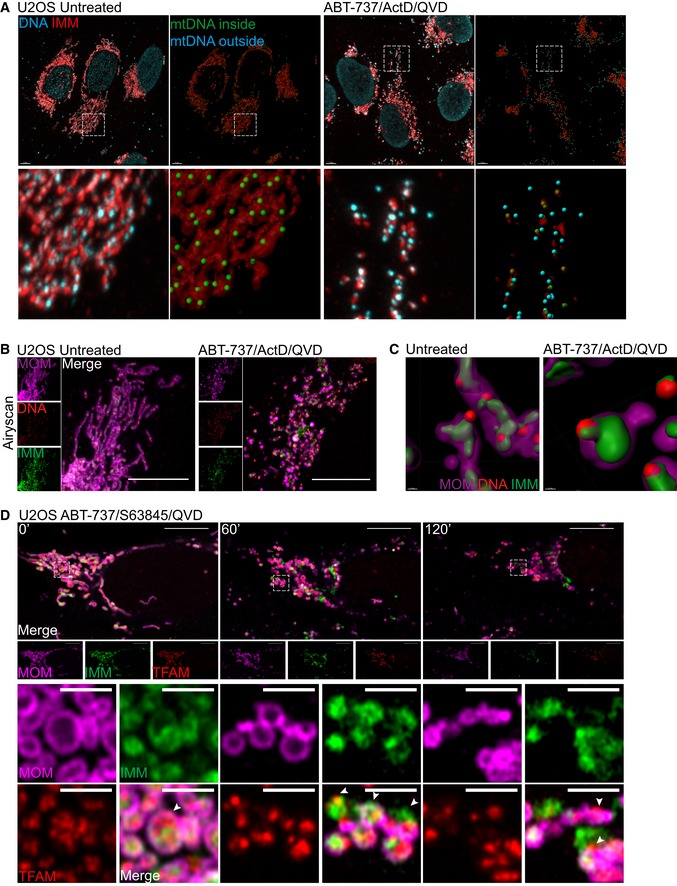
Maximum intensity projection of Airyscan z‐stack data of U2OS cells treated with 10 μM ABT‐737, 1 μM ActD and 20 μM qVD‐OPh for 3 h. Cells were immunostained with anti‐AIF (IMM) and anti‐DNA antibodies. Z‐stack data were 3D‐rendered in Imaris and mtDNA nucleoid inside and outside the AIF signal were visualised. Scale bar = 5 μm. See [Link], [Link]. Representative images from three independent experiments.
Airyscan images of U2OS cells stably expressing JF646‐MOM (magenta) treated with 10 μM ABT‐737, 1 μM ActD and 20 μM qVD‐OPh for 3 h and immunostained with anti‐DNA (red) and anti‐AIF (IMM, green) antibodies. Scale bar = 10 μm. Representative images from three independent experiments.
Imaris 3D‐renderings of MOM (magenta), AIF (green) and DNA (red) from U2OS cells treated as in (B).
U2OS cells stably expressing JF646‐MOM (magenta) and transiently expressing TFAM‐mScarlet (red) and AIF (1‐90)‐mClover (green) live‐cell imaged by Airyscan. Cells were treated with 10 μM ABT‐737, 2 μM S63845 and 20 μM qVD‐OPh at t = 0. Scale bar = 10 and 2 μm for zooms. See Video EV7. Representative images from two independent experiments. Numbers indicate time in minutes. Arrowheads indicate instances of released TFAM.
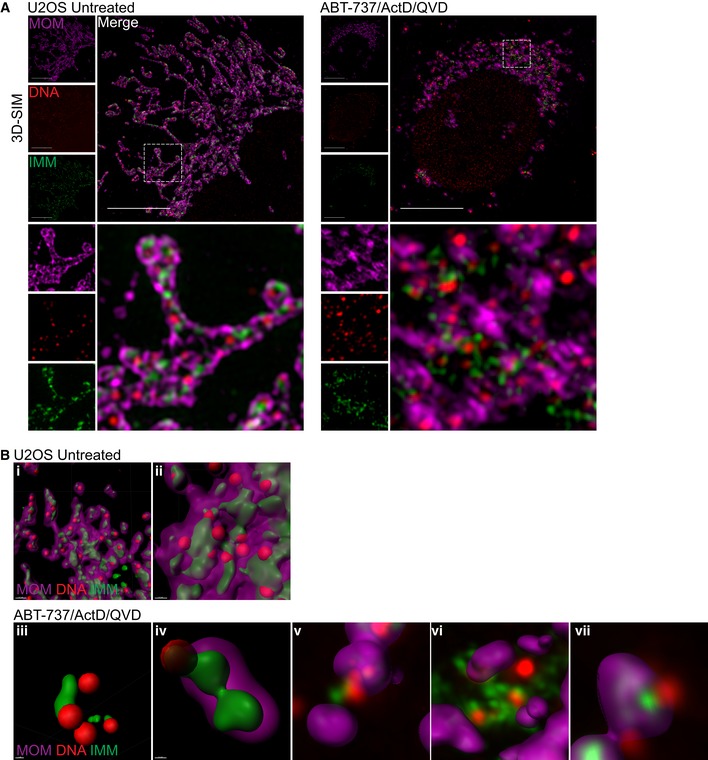
3D‐SIM images of U2OS cells treated with 10 μM ABT‐737, 1 μM ActD, and 20 μM qVD‐OPh for 3 h. Prior to treatment cells were labelled with JF646 (to label SNAP‐MOM) and post‐fixation were immunostained for IMM (AIF) and DNA. Scale bar = 10 μm. Representative images from three independent experiments.
Further examples of untreated (i–ii) and treated (iii–iv) U2OS cells 3D‐rendered for MOM (magenta), AIF (IMM, green), and DNA (red). (v–vii) show only the MOM 3D‐rendered with AIF and DNA in captured form.
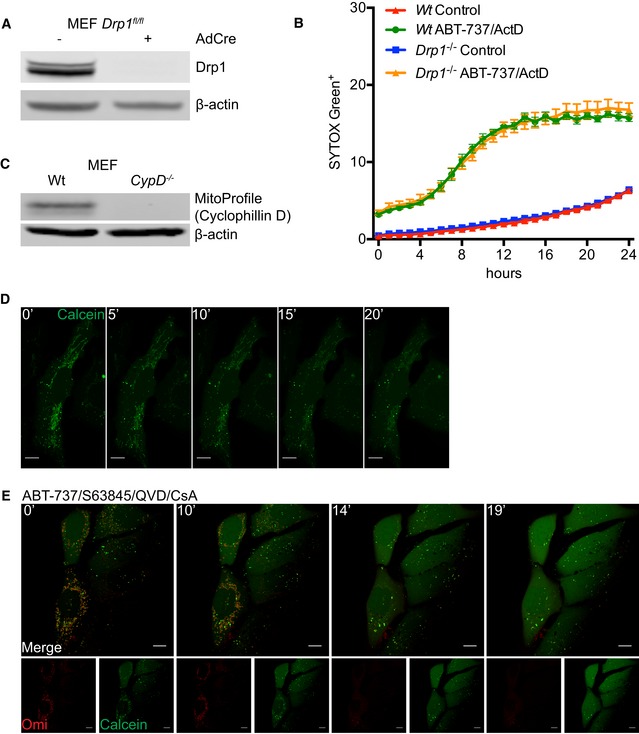
Expression of Drp1 protein in Wt and Drp1‐deleted MEFs.
IncuCyte live‐imaging of SYTOX Green exclusion in Wt and Drp1‐deleted cells treated with 10 μM ABT‐737 and 1 μM ActD to assess cell viability. Data are expressed as mean ± SEM, representative of two independent experiments and have been normalised to starting confluency.
Expression of CypD protein in Wt and CypD‐deleted MEFs.
U2OS cells loaded with calcein‐AM and CoCl2 and imaged every 30 s for 20 min to show absence of photobleaching. Scale bar = 10 μm. Numbers indicate time in minutes.
Images from time‐lapse live‐cell imaging of U2OS cells loaded with calcein‐AM and CoCl2 and treated with 10 μM ABT‐737, 2 μM S63845 and 20 μM qVD‐OPh in the presence of 25 μM CsA at t = 0. Scale bar = 10 μm. See Video EV9. Representative images from two independent experiments. Numbers indicate time in minutes.
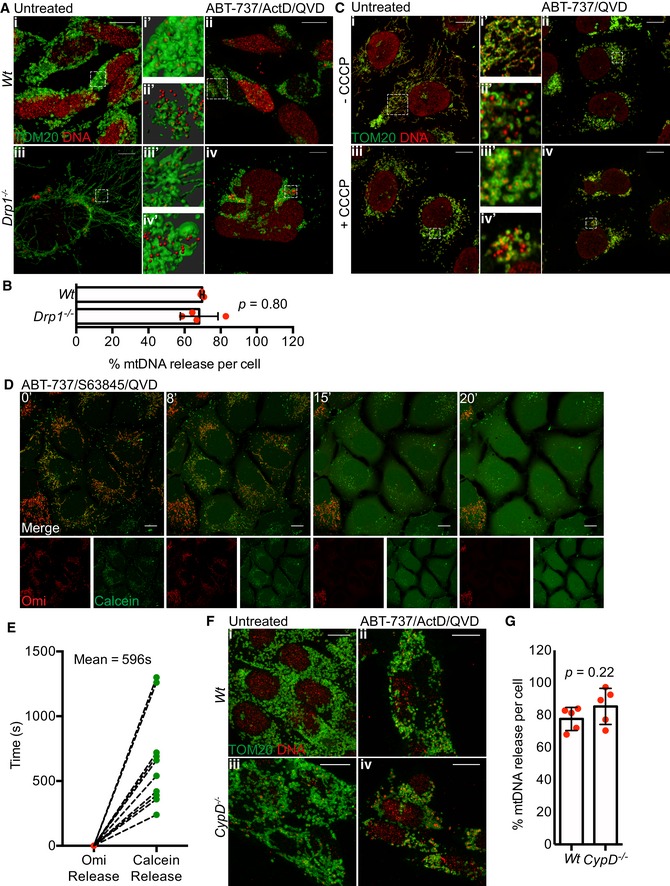
Maximum intensity projection of z‐stack Airyscan images of Drp1fl/fl MEFs with induced Drp1 deletion by AdCre lentiviral particles. Cells were treated with 10 μM ABT‐737, 1 μM ActD and 20 μM qVD‐OPh for 3 h and immunostained with anti‐TOM20 (MOM) and anti‐DNA antibodies. Zooms show Imaris 3D reconstructions of surface (MOM, TOM20) and spots (DNA) to show the extent of mtDNA release. Scale bar = 10 μm. Representative images from two independent experiments.
Quantification of mtDNA release per cell in Wt or Drp1‐deleted cells. Data are from two independent experiments and are expressed as mean ± SD. Data were analysed by Student's t‐test.
U2OS MCL1CRISPR cells were pre‐treated with 10 μM CCCP and 20 μM qVD‐OPh for 30 min to induce mitochondrial fragmentation after which treatment was changed to 10 μM ABT‐737 and 20 μM qVD‐OPh. After 3 h, cells were fixed and immunostained with anti‐TOM20 and anti‐DNA antibodies. Zooms show highlighted areas. Scale bar = 10 μm. Representative images from three independent experiments.
Images from time‐lapse live‐cell imaging of U2OS cells loaded with calcein‐AM and CoCl2 and treated with 10 μM ABT‐737/S63845/qVD‐OPh at t = 0. Scale bar = 10 μm. See Video EV8. Representative images from three independent experiments. Numbers indicate time in minutes.
Quantification of calcein release from mitochondria relative to Omi release. Data are from three independent experiments.
Maximum intensity projections of z‐stack Airyscan images of Wt and CypD −/− MEFs. Cells were treated with 10 μM ABT‐737, 1 μM ActD and 20 μM qVD‐OPh for 3 h and immunostained for TOM20 (MOM) and DNA. Scale bar = 10 μm. Representative images from two independent experiments.
Quantification of mtDNA release per cell in Wt or CypD‐deleted cells. Data are from two independent experiments and are expressed as mean ± SD. Data were analysed by Student's t‐test.
Live‐cell Airyscan images of U2OS BAX/BAK CRISPR‐Cas9‐deleted cells stably expressing JF646‐MOM (magenta) and mCherry‐BAX (cyan) and transiently expressing TFAM‐mClover (green). Cells were treated with 10 μM ABT‐737, 2 μM S63845 and 20 μM qVD‐OPh at t = 0. Scale bar = 10 μm. See Video EV10. Numbers indicate time in minutes.
Airyscan images of U2OS MCL1CRISPR cells stably expressing JF646‐MOM (magenta) and transiently expressing TFAM‐mClover (green), treated with 10 μM ABT‐737 and 20 μM qVD‐OPh for 3 h, immunostained with anti‐active BAX (6A7, cyan). Images are maximum intensity projections of z‐stack data. Scale bar = 10 μm. Representative images from three independent experiments.
Imaris 3D‐rendering of U2OS cells as in (B) showing MOM (green), TFAM (red) and active BAX (cyan).
U2OS cells stably expressing JF646‐MOM (magenta) treated with 10 μM ABT‐737, 2 μM S63845 and 20 μM qVD‐OPh for 3 h. Cells were immunostained with antibodies for active BAX (6A7, cyan) and AIF (IMM, green). Images are maximum intensity projections of z‐stack data. Scale bar = 10 μm. Representative images from three independent experiments.
Imaris 3D‐rendering of U2OS cells as in (D) showing MOM (green), AIF (red) and active BAX (cyan).
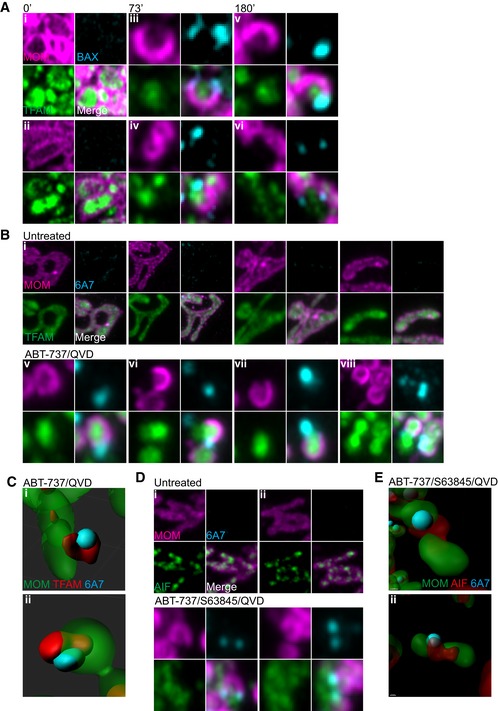
Further examples of stills from live‐cell imaging of U2OS BAX/BAK CRISPR cells expressing JF646‐MOM (magenta) with BAX foci (cyan) and TFAM extrusion (green) from Fig 6A and Video EV10. Cells were treated with 10 μM ABT‐737, 2 μM S63845 and 20 μM qVD‐OPh at t = 0. Numbers indicate time in minutes.
Further examples of TFAM extrusion through BAX pores from Fig 6B of U2OS cells stably expressing JF646‐MOM (magenta), transiently expressing TFAM‐mClover (green) and immunostained for active BAX (6A7, cyan). Cells were treated with 10 μM ABT‐737 and 20 μM qVD‐OPh for 3 h.
Further examples of Imaris 3D‐renderings from Fig 6B of U2OS cells stably expressing JF646‐MOM (green), transiently expressing TFAM‐mClover (red) and immunostained for active BAX (6A7, cyan). Cells were treated with 10 μM ABT‐737 and 20 μM qVD‐OPh for 3 h.
Further examples of IMM extrusion through BAX pores from Fig 6D of U2OS cells stably expressing JF646‐MOM (magenta) and immunostained for AIF (IMM, green) and active BAX (6A7, cyan). Cells were treated with 10 μM ABT‐737, 2 μM S63845 and 20 μM qVD‐OPh for 3 h.
Further examples of Imaris 3D‐renderings from Fig 6D of U2OS cells stably expressing JF646‐MOM (green) and immunostained for AIF (IMM, red) and active BAX (6A7, cyan). Cells were treated with 10 μM ABT‐737, 2 μM S63845 and 20 μM qVD‐OPh for 3 h.
Comment in
-
MIM through MOM: the awakening of Bax and Bak pores.EMBO J. 2018 Sep 3;37(17):e100340. doi: 10.15252/embj.2018100340. Epub 2018 Aug 22. EMBO J. 2018. PMID: 30135068 Free PMC article.
References
-
- Baines CP, Kaiser RA, Purcell NH, Blair NS, Osinska H, Hambleton MA, Brunskill EW, Sayen MR, Gottlieb RA, Dorn GW, Robbins J, Molkentin JD (2005) Loss of cyclophilin D reveals a critical role for mitochondrial permeability transition in cell death. Nature 434: 658–662 - PubMed
-
- Bonora M, Morganti C, Morciano G, Giorgi C, Wieckowski MR, Pinton P (2016) Comprehensive analysis of mitochondrial permeability transition pore activity in living cells using fluorescence‐imaging‐based techniques. Nat Protoc 11: 1067–1080 - PubMed
Publication types
MeSH terms
Substances
Grants and funding
- BB/K008374/1/BB_/Biotechnology and Biological Sciences Research Council/United Kingdom
- 22903/CRUK_/Cancer Research UK/United Kingdom
- 23983/CRUK_/Cancer Research UK/United Kingdom
- 15816/CRUK_/Cancer Research UK/United Kingdom
- 20145/CRUK_/Cancer Research UK/United Kingdom
- BB/K017314/1/BB_/Biotechnology and Biological Sciences Research Council/United Kingdom
- MR/K01563X/1/MRC_/Medical Research Council/United Kingdom
- C40872/A20145/CRUK_/Cancer Research UK/United Kingdom
- R01 GM123266/GM/NIGMS NIH HHS/United States
- MR/L016354/1/MRC_/Medical Research Council/United Kingdom
LinkOut - more resources
Full Text Sources
Other Literature Sources
Research Materials
