. 2018 Sep 14;293(37):14520-14533.
doi: 10.1074/jbc.RA118.004345. Epub 2018 Jul 26.

The actin filament bundling protein α-actinin-4 actually suppresses actin stress fibers by permitting actin turnover

Affiliations

The actin filament bundling protein α-actinin-4 actually suppresses actin stress fibers by permitting actin turnover

James Peter Kemp Jr et al. J Biol Chem. .

Abstract

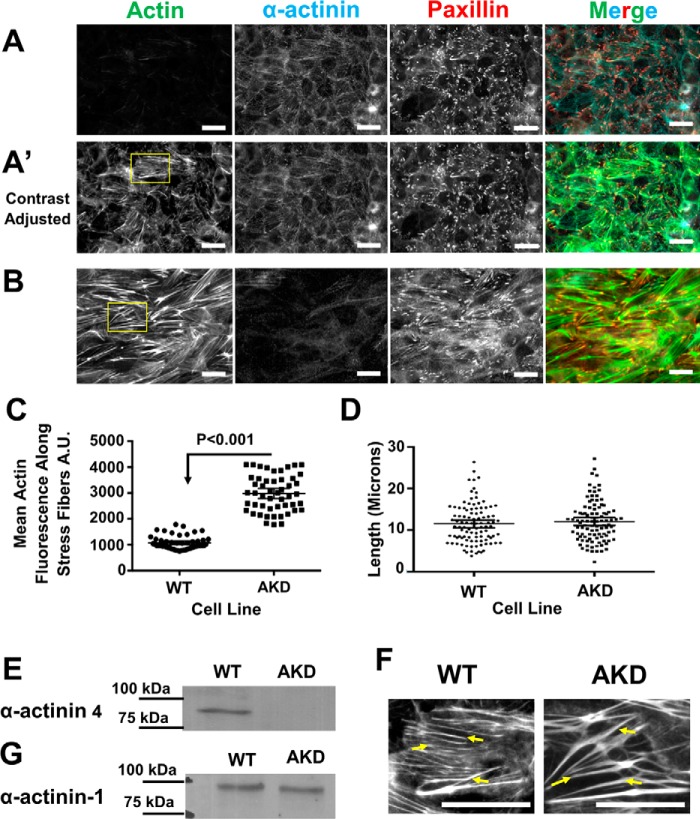
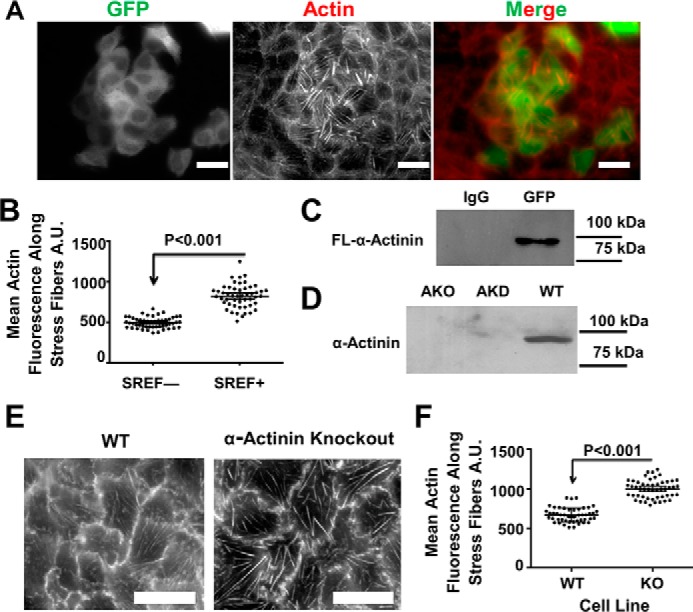
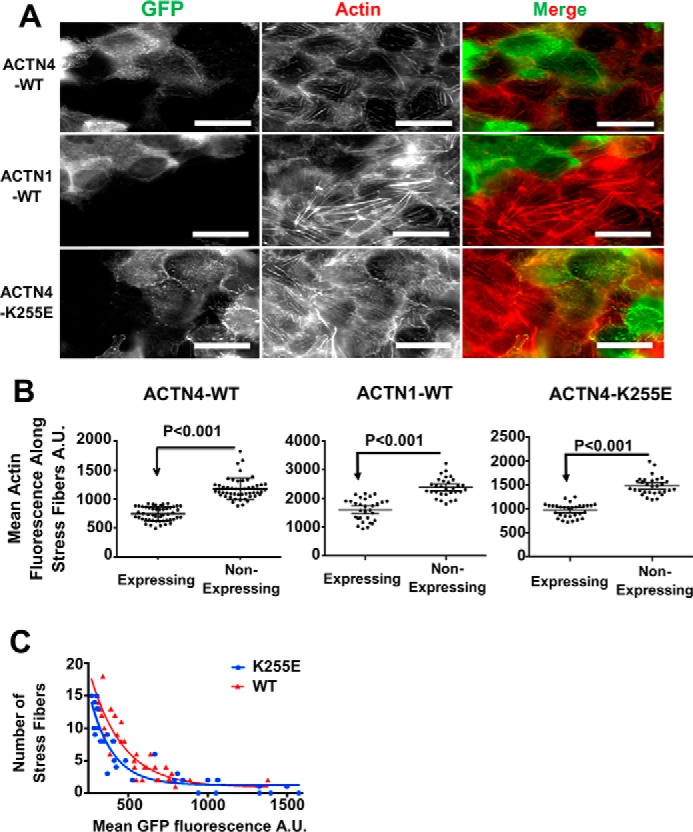
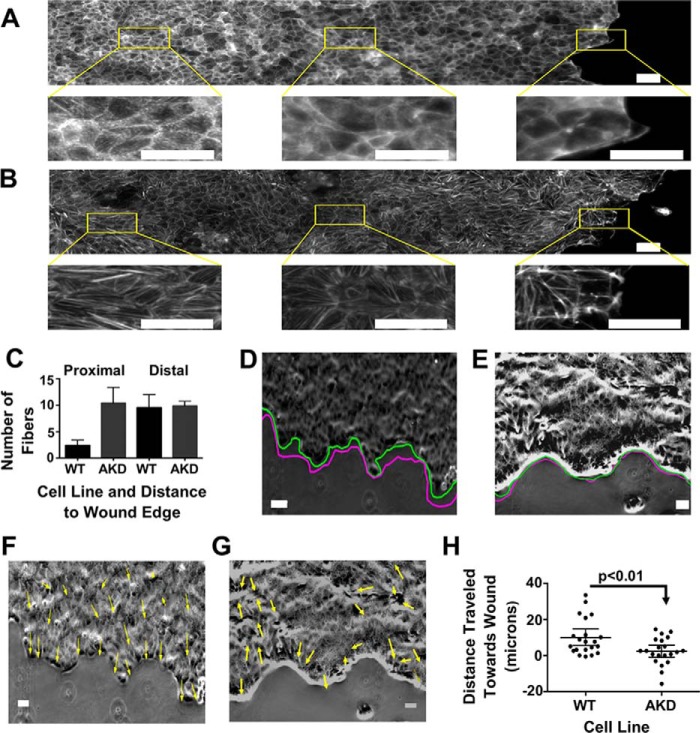
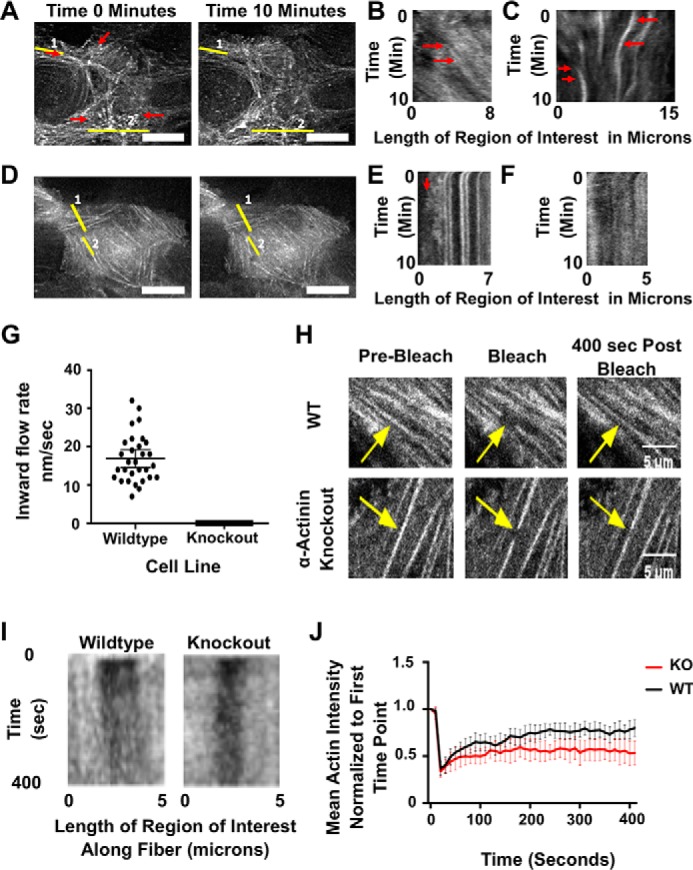
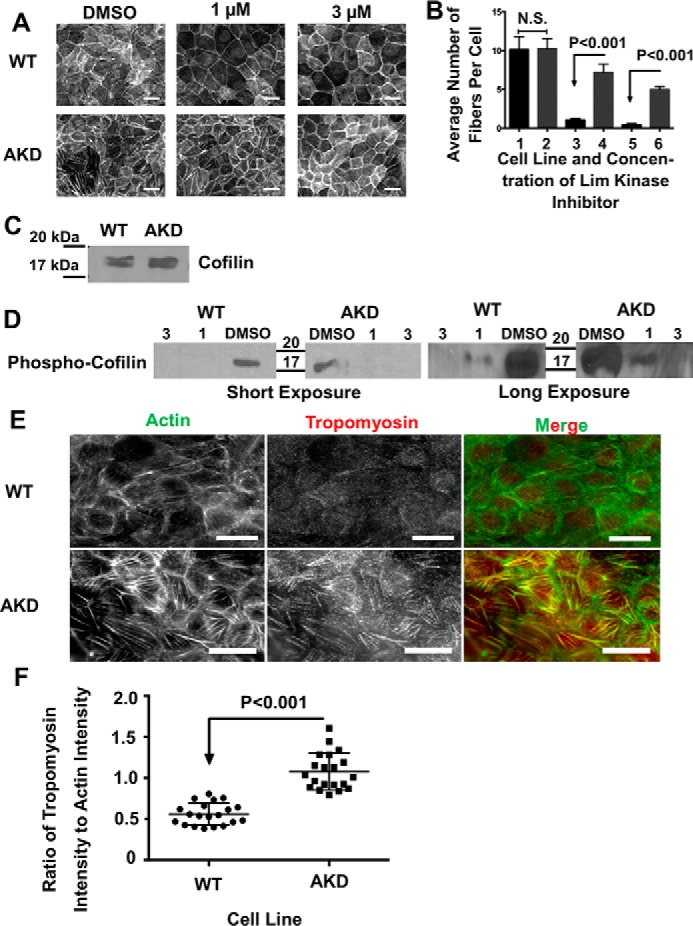
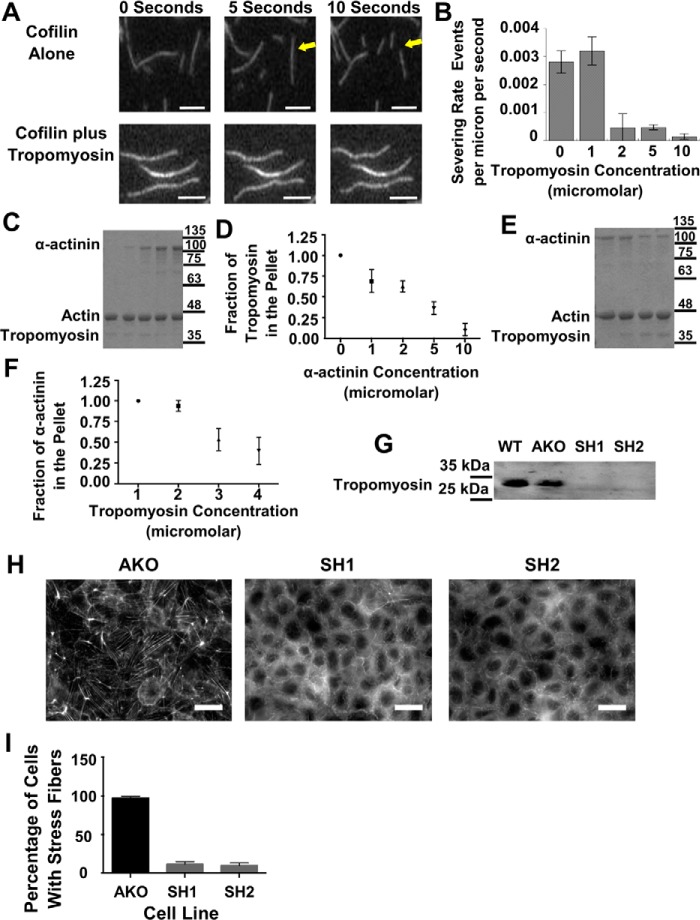
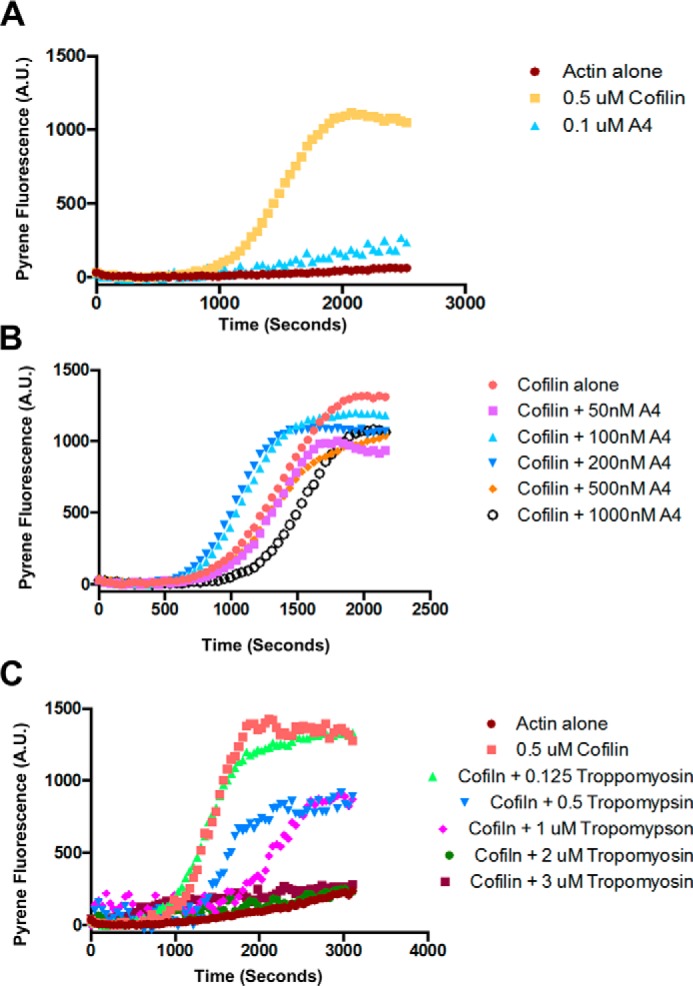
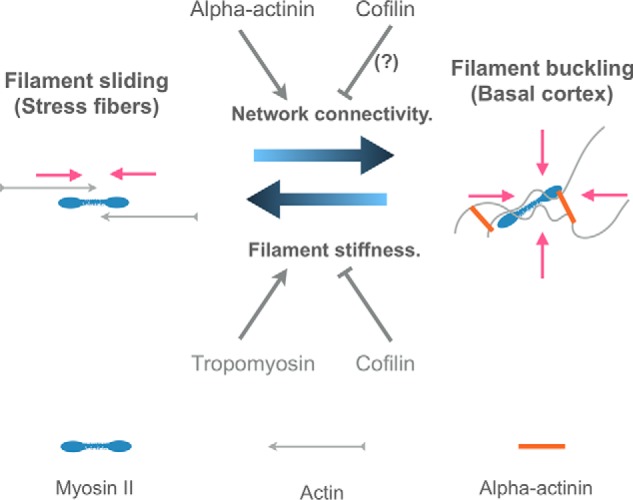
Cells organize actin filaments into contractile bundles known as stress fibers that resist mechanical stress, increase cell adhesion, remodel the extracellular matrix, and maintain tissue integrity. α-actinin is an actin filament bundling protein that is thought to be essential for stress fiber formation and stability. However, previous studies have also suggested that α-actinin might disrupt fibers, making the true function of this biomolecule unclear. Here we use fluorescence imaging to show that kidney epithelial cells depleted of α-actinin-4 via shRNA or CRISPR/Cas9, or expressing a disruptive mutant make more massive stress fibers that are less dynamic than those in WT cells, leading to defects in cell motility and wound healing. The increase in stress fiber mass and stability can be explained, in part, by increased loading of the filament component tropomyosin onto stress fibers in the absence of α-actinin, as monitored via immunofluorescence. We show using imaging and cosedimentation that α-actinin and tropomyosin compete for binding to F-actin and that tropomyosin shields actin filaments from cofilin-mediated disassembly in vitro and in cells. Perturbing tropomyosin in cells lacking α-actinin-4 results in a complete loss of stress fibers. Our results with α-actinin-4 on stress fiber organization are the opposite of what might have been predicted from previous in vitro biochemistry and further highlight how the complex interactions of multiple proteins competing for filament binding lead to unexpected functions for actin-binding proteins in cells.

Keywords: actin; cofilin; contractility; epithelial cell; focal adhesions; kidney; migration; motility; paxillin; stress fibers; tropomyosin; α-actinin.


Conflict of interest statement

The authors declare that they have no conflicts of interest with the contents of this article

Figures

Figure 1.
Figure 1.
α-Actinin-4 depletion in MDCK cells leads to an increase in stress fiber mass. A, basal surface of WT MDCK cells stained for α-actinin-4, paxillin, and actin showing stress fibers. Micrographs have been adjusted the same as in B for comparison. A′, micrographs are same as above, but the contrast was adjusted to better show the stress fibers. Scale bars are 20 μm. B, basal surface of α-actinin-4–depleted cells stained for α-actinin-4, paxillin, and actin. C, graph of the mean average intensity ±95% confidence interval of actin along filaments. The mean intensity is significantly greater in α-actinin-4–depleted cells. D, graph of the mean fiber length ±95% confidence interval in WT and AKD cells. The mean length is not significantly different in depleted cells. E, Western blotting, with molecular mass markers, of WT and α-actinin-4–depleted cell lines demonstrating α-actinin-4 is depleted. F, region of interest from A′ and B showing examples of actin stress fibers that were counted in WT cells and actinin–depleted cells. Stress fibers are marked with arrows. Scale bars are 20 μm. G, Western blotting, with molecular mass markers, of WT and α-actinin-4–depleted cell lines demonstrating α-actinin-1 is unchanged in actinin-4–depleted cells.
Figure 2.
Figure 2.
Disrupting α-actinin function via a dominant-negative or knockout approach also increases stress fiber mass. A, basal surface of MDCK cells overexpressing an actinin mutant lacking the actin-binding domain with a GFP tag and stained with phalloidin showing stress fibers. Scale bars are 20 μm. B, graph of the mean average intensity ± 95% confidence interval of actin along stress fibers. A.U., arbitrary units. C, Western blotting probing endogenous actinin from an immunoprecipitation of GFP from the overexpressing cells in A. D, Western blotting of WT, actinin knockdown, and knockout cell lines demonstrating that the knockout cell line lacks actinin-4 expression. E, micrographs of WT and knockout cell lines stained with phalloidin showing the stress fibers. F, graph of the mean average intensity ±95% confidence interval of actin along stress fibers from WT and KO cell lines. The mean intensity is significantly greater in the knockout cell line just as the knockdowns from Fig. 1.
Figure 3.
Figure 3.
α-Actinin-4 knockout is rescued by either expression of α-actinin-4–GFP or α-actinin-1–GFP. The numbers of stress fibers in rescue cells are negatively correlated to the amount of expression and the affinity of actinin for actin. A, micrographs α-actinin-4 knockout cells rescued with either actinin-4, actinin-1, or mutant K255E–actinin-4 tagged with GFP and stained for actin. A.U., arbitrary units. Scale bars are 20 μm. B, graphs showing the mean fluorescent intensity of actin along stress fibers as a function of different α-actinin's expression in the knockout cell line ±95% confidence interval. C, graph showing the number of stress fibers as a function of the mean GFP fluorescence in that cell in WT and K255E rescued cells.
Figure 4.
Figure 4.
Stress fibers in α-actinin-4–depleted cells are more stable than their WT counterparts, and depleted cells show less directed movement into the wound. A, stitched micrograph of a WT wounded monolayer stained with phalloidin. Regions of interest show actin fibers proximal and distal to the wound edge. Scale bars are 20 μm. B, stitched micrograph of an α-actinin-4–depleted wounded monolayer stained with phalloidin. Regions of interest show actin fibers proximal and distal to the wound edge. Scale bars are 20 μm. C, graph of the mean number of filaments per cell, ±95% confidence interval, proximal and distal to the wound edge in WT and depleted monolayers. D, representative image at the beginning of the wound healing experiment of WT cells with the green line outlining the wound edge at time 0 and the magenta line outlining the wound edge at the end of the experiment. Scale bar is 50 μm. E, representative image at the beginning of wound healing experiment of α-actinin–depleted cells with the green line outlining the wound edge at time 0 and the magenta line outlining the wound edge at the end of the experiment. Scale bar is 50 μm. F, image from D with arrows marking the direction of movement of cells during the experiment. Scale bar is 50 μm. G, image from E with arrows marking the direction of movement of cells during the experiment. Scale bar is 50 μm. H, plot of the distances traveled by cells from wound healing experiments. Positive is toward the wound and negative is away from the wound edge.
Figure 5.
Figure 5.
α-Actinin-4 is necessary for actin flow in nonmotile MDCK cells. A, micrographs from start and end of video of GFP-actin in a WT cell. Scale bar is 10 μm. Red arrows show direction of actin flow. B, kymograph from area of interest 1 from A, which is a line along a stress fiber. Notice the flow of actin through the stress fiber toward the center of the cell, which is marked with a red arrow. C, kymograph from area of interest 2 from A, which cuts across stress fibers. This kymograph shows the convergence of the actin into the middle over time as marked out with the red arrows. D, micrographs from start and end of video of GFP-actin in an α-actinin knockout cell. Scale bar is 10 μm. E, kymograph of area of interest 1 from D. Notice there is no flow of actin inward and only protrusive activity at the edge of the cell as pointed out with a red arrow. F, kymograph of area of interest 2 along a stress fiber showing no flow along the fiber. G, graph showing inward flow rates of actin from 30 cells. Error bars are 95% confidence interval. H, micrographs of GFP-actin in WT and α-actinin knockout cells in a FRAP experiment. Arrows point to area of photobleach along stress fibers in each cell. Time points are pre-bleach, immediately post-bleach, and 400 s post-bleach. Scale bar is 50 μm. I, kymographs of stress fibers from H with bleach site in the middle along the x axis and time along the y axis. J, graph of the mean actin intensity at the photobleach site from nine different stress fibers in individual cells normalized to the intensity to the bleach area at the first time point.
Figure 6.
Figure 6.
Stress fibers in α-actinin–depleted cells are less susceptible to cofilin-mediated disassembly and contain more tropomyosin. A, micrographs of the basal surface of WT and AKD cells treated with DMSO and 1 or 3 μm Lim kinase inhibitor. Scale bars are 20 μm. B, graph of the average number of filaments per cell, ±95% confidence interval, in WT and AKD cells as a function of the amount of Lim kinase inhibitor. Bar 1 is WT control cells; bar 2 is AKD control-treated cells; bar 3 is WT cells treated with 1 μm inhibitor; bar 4 is AKD cells treated with 1 μm inhibitor; bar 5 is WT cells treated with 3 μm inhibitor; and bar 6 is AKD cells treated with 3 μm inhibitor. C, developed Western blotting probing cofilin levels in WT and AKD cells demonstrating no significant change in protein levels. D, developed Western blots of cells treated with DMSO or Lim kinase inhibitor and probed for phospho-cofilin. Both a short and long exposure are given. and 20 μg of protein was added to each lane. E, micrographs of WT or actinin–depleted cells stained for actin and tropomyosin. Scale bars are 20 μm. F, graph of the ratio of tropomyosin to actin along stress fibers in WT and depleted cells. The mean ratio was significantly greater in the depleted cells.
Figure 7.
Figure 7.
Tropomyosin provides stability to actin fibers both in vitro and in vivo, and α-actinin competes for access to actin filaments in vitro. A, consecutive micrographs from an in vitro severing assay of actin filaments either in the presence or absence of tropomyosin. The arrows point to a filament that severs in the presence of cofilin. Scale bars are 5 μm. B, graph of the severing rate of actin filaments via cofilin as a function of tropomyosin concentration. C, Coomassie Blue-stained gel of the pellets from spin-down assays where tropomyosin concentration was maintained and α-actinin concentration was increased from left to right. D, graph of the amount of tropomyosin in the pellet as a function of actinin concentration from repeated experiments. E, Coomassie Blue-stained gel of the pellets from spin-down assays where actinin concentration was maintained and tropomyosin concentration was increased from left to right. F, graph of the amount of actinin in the pellet as a function of tropomyosin concentration from repeated experiments. G, Western blotting probing tropomyosin in WT, actinin knockout, and actinin knockout transfected with tropomyosin ShRNA1 or ShRNA2. H, micrographs of actinin knockout cell line or actinin knockout transfected with SH1 or SH2 and stained for actin. I, graph quantifying the percentage of cells with stress fibers as a function of transfection with SH1 or SH2.
Figure 8.
Figure 8.
α-Actinin enhances cofilin-mediated severing at low concentrations and blocks or has no effect at higher concentrations. However, tropomyosin blocks cofilin-mediated severing of filaments in vitro. A, graph of a pyrene assay demonstrating how cofilin enhances actin polymerization, and α-actinin has no effect. B, graph of a pyrene assay demonstrating that low concentrations of α-actinin enhance cofilin-mediated severing and high concentrations either have no effect or inhibit cofilin severing. C, graph of a pyrene assay demonstrating that tropomyosin inhibits cofilin-mediated severing of actin filaments in a concentration-dependent manner.
Figure 9.
Figure 9.
Model depicting one way in which α-actinin-4 might suppress stress fiber formation. In the presence of α-actinin, a highly interconnected network of disordered actin filaments forms at the basal surface of cells that undergoes biaxial contraction through filament buckling. In the absence of α-actinin, network connectivity is lost, favoring stress fiber formation. Loss of α-actinin also allows tropomyosin to bind to F-actin, which stiffens the filaments to further inhibit buckling and favor stress fibers. Pink arrows show the directions of contractile forces. See under “Discussion” for further details.

References

    1. Burridge K., and Guilluy C. (2016) Focal adhesions, stress fibers and mechanical tension. Exp. Cell Res. 343, 14–20 10.1016/j.yexcr.2015.10.029 - DOI - PMC - PubMed
    1. Pellegrin S., and Mellor H. (2007) Actin stress fibres. J. Cell Sci. 120, 3491–3499 10.1242/jcs.018473 - DOI - PubMed
    1. Isenberg G., Rathke P. C., Hülsmann N., Franke W. W., and Wohlfarth-Bottermann K. E. (1976) Cytoplasmic actomyosin fibrils in tissue culture cells: direct proof of contractility by visualization of ATP-induced contraction in fibrils isolated by laser micro-beam dissection. Cell Tissue Res. 166, 427–443 - PubMed
    1. Katoh K., Kano Y., Masuda M., Onishi H., and Fujiwara K. (1998) Isolation and contraction of the stress fiber. Mol. Biol. Cell 9, 1919–1938 10.1091/mbc.9.7.1919 - DOI - PMC - PubMed
    1. Kreis T. E., and Birchmeier W. (1980) Stress fiber sarcomeres of fibroblasts are contractile. Cell 22, 555–561 10.1016/0092-8674(80)90365-7 - DOI - PubMed

Publication types

LinkOut - more resources