. 2018 Jul 26;8(1):11258.
doi: 10.1038/s41598-018-29295-9.

Structural brain imaging in Alzheimer's disease and mild cognitive impairment: biomarker analysis and shared morphometry database

Affiliations

Structural brain imaging in Alzheimer's disease and mild cognitive impairment: biomarker analysis and shared morphometry database

Christian Ledig et al. Sci Rep. .

Abstract

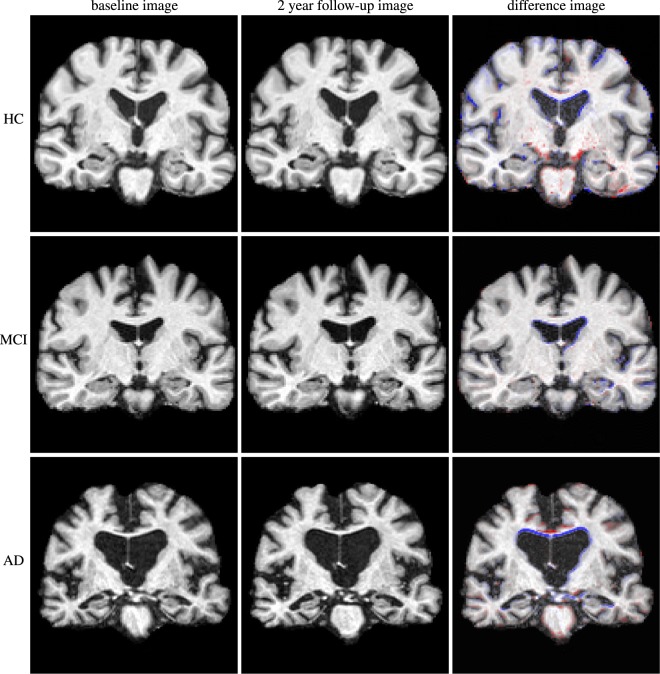
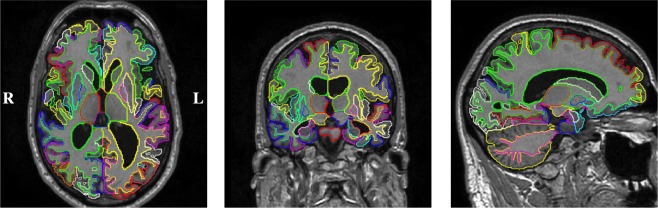
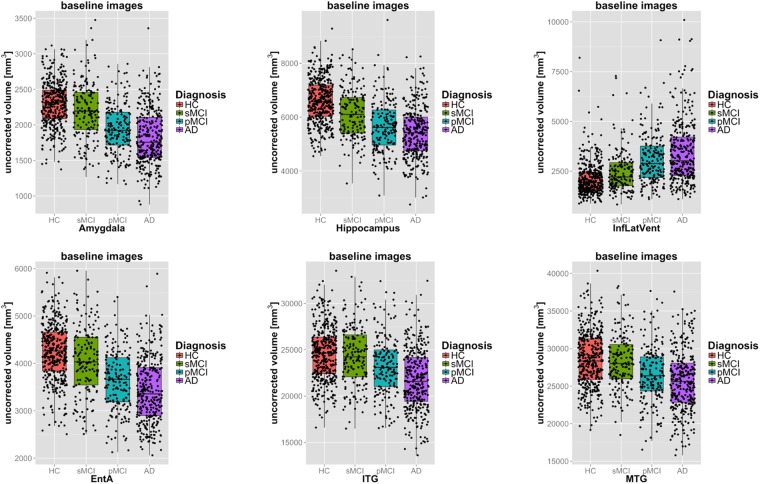
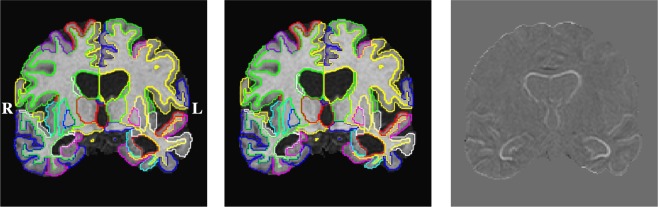
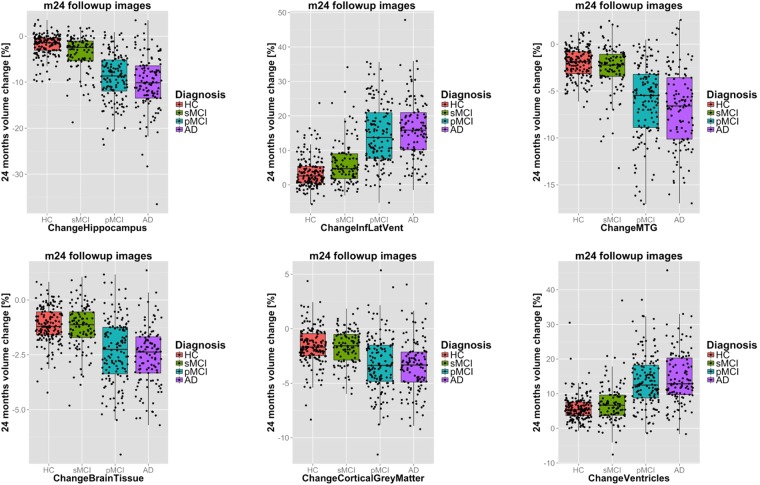
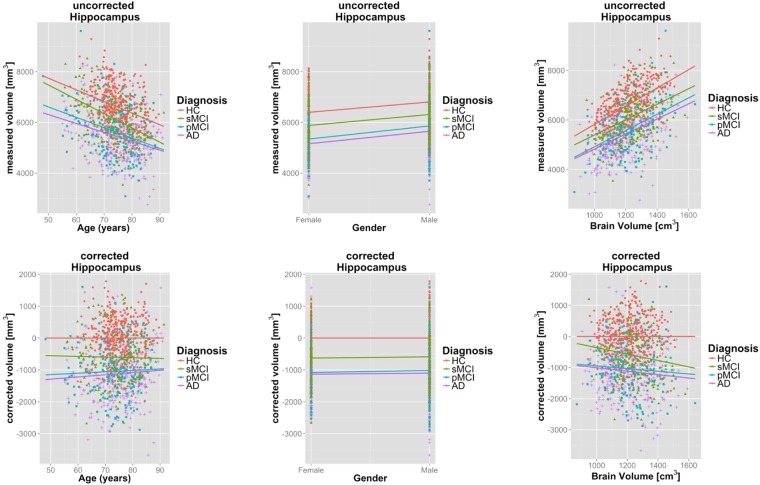
Magnetic resonance (MR) imaging is a powerful technique for non-invasive in-vivo imaging of the human brain. We employed a recently validated method for robust cross-sectional and longitudinal segmentation of MR brain images from the Alzheimer's Disease Neuroimaging Initiative (ADNI) cohort. Specifically, we segmented 5074 MR brain images into 138 anatomical regions and extracted time-point specific structural volumes and volume change during follow-up intervals of 12 or 24 months. We assessed the extracted biomarkers by determining their power to predict diagnostic classification and by comparing atrophy rates to published meta-studies. The approach enables comprehensive analysis of structural changes within the whole brain. The discriminative power of individual biomarkers (volumes/atrophy rates) is on par with results published by other groups. We publish all quality-checked brain masks, structural segmentations, and extracted biomarkers along with this article. We further share the methodology for brain extraction (pincram) and segmentation (MALPEM, MALPEM4D) as open source projects with the community. The identified biomarkers hold great potential for deeper analysis, and the validated methodology can readily be applied to other imaging cohorts.


Conflict of interest statement

C.L., A.S. and R.G. conducted this research while being employees of Imperial College London, U.K. (C.L., A.S., R.G.) and IXICO plc, U.K. (C.L., R.G.). D.R. is a co-founder and scientific advisor of IXICO plc, U.K., a provider of medical image analysis services. C.L. is currently employed by Imagen Technologies, Inc., N.Y., U.S.A. This does not alter thes’ adherence to Scientific Reports policies on sharing data and materials.

Figures

Figure 1
Figure 1
Three examples of MR images (brain-extracted) of subjects from the ADNI1 cohort in coronal section. Top row: a healthy control subject (male, 84.8 years at baseline); middle row: MCI subject (female, 71.8 year at baseline) who converted to AD after three years; bottom row: an AD patient (male, 77.5 years at baseline). Left: baseline; middle: 2-year follow-up; right: baseline with overlaid difference image of rigidly aligned images (blue: volume loss/atrophy, red: positive volume change). The differences are visually subtle, but the increased atrophy in the medial temporal lobe and the enlarged ventricles are apparent in the difference image.
Figure 2
Figure 2
Example cross-sectional segmentation results of a patient diagnosed with AD (ADNI_018_S_0286, male, 66 years of age) in axial (left), coronal (middle) and sagittal (right) view-plane.
Figure 3
Figure 3
Boxplots of structural volumes at baseline for six selected structures before correcting for nuisance factors for distinct disease groups. Structures were selected based on their performance in classifying the investigated disease groups (c.f. Table 1).
Figure 4
Figure 4
Example longitudinal segmentation results of baseline (left) and month 24 (middle) follow-up images of a patient diagnosed AD (ADNI_018_S_0286) in coronal section. Substantial hippocampal atrophy (measured: −7.81%) and ventricular enlargement (16.5%) are apparent in the difference image after affine registration (right).
Figure 5
Figure 5
Boxplots of volume changes for selected brain structures (top) and surrogate structures (bottom) from baseline to month 24 follow-up image for different clinical groups. Features selected based on their performance in classifying the investigated disease groups (c.f. Tables 3 and 4).
Figure 6
Figure 6
Top: Dependence of hippocampal volume on age (left), gender (middle) and brain volume (right). Bottom: Corresponding s corrected for nuisance factors age, gender and brain size. Overlaid regression lines for distinct disease groups with corresponding regression lines.

References

    1. Scheltens P, Fox NC, Barkhof F, De Carli C. Structural magnetic resonance imaging in the practical assessment of dementia: beyond exclusion. The Lancet Neurology. 2002;1:13–21. doi: 10.1016/S1474-4422(02)00002-9. - DOI - PubMed
    1. Fennema-Notestine C, et al. Structural MRI biomarkers for preclinical and mild Alzheimer’s disease. Human Brain Mapping. 2009;30:3238–3253. doi: 10.1002/hbm.20744. - DOI - PMC - PubMed
    1. Frisoni GB, Fox NC, Jack CR, Scheltens P, Thompson PM. The clinical use of structural MRI in Alzheimer disease. Nature Reviews Neurology. 2010;6:67–77. doi: 10.1038/nrneurol.2009.215. - DOI - PMC - PubMed
    1. Klöppel S, et al. Diagnostic neuroimaging across diseases. NeuroImage. 2012;61:457–463. doi: 10.1016/j.neuroimage.2011.11.002. - DOI - PMC - PubMed
    1. Klöppel S, et al. Accuracy of dementia diagnosis–a direct comparison between radiologists and a computerized method. Brain. 2008;131:2969–2974. doi: 10.1093/brain/awn239. - DOI - PMC - PubMed

Publication types