. 2018 Jul 26;9(1):2937.
doi: 10.1038/s41467-018-05347-6.

Sensitive and powerful single-cell RNA sequencing using mcSCRB-seq

Affiliations

Sensitive and powerful single-cell RNA sequencing using mcSCRB-seq

Johannes W Bagnoli et al. Nat Commun. .

Abstract

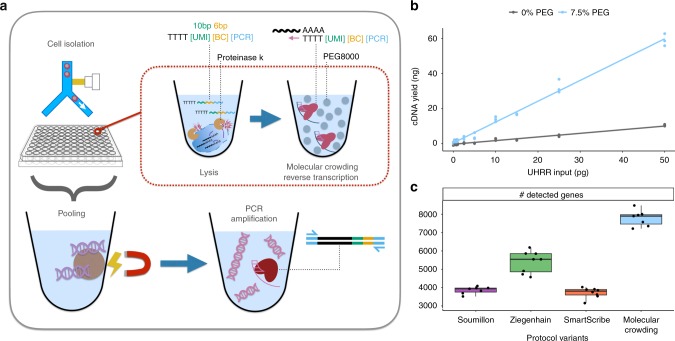
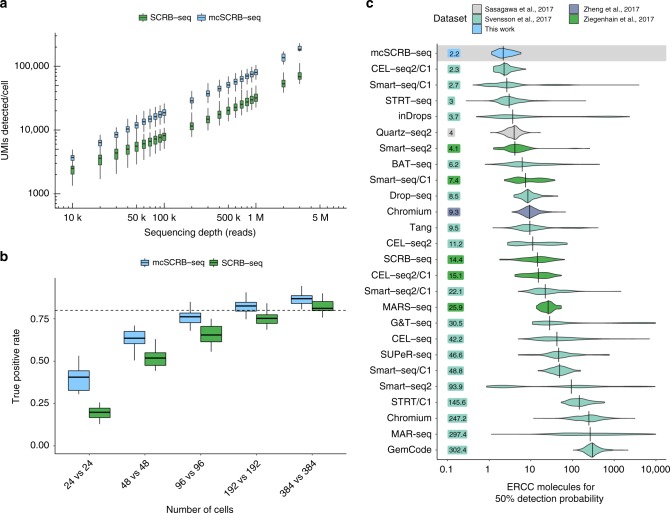
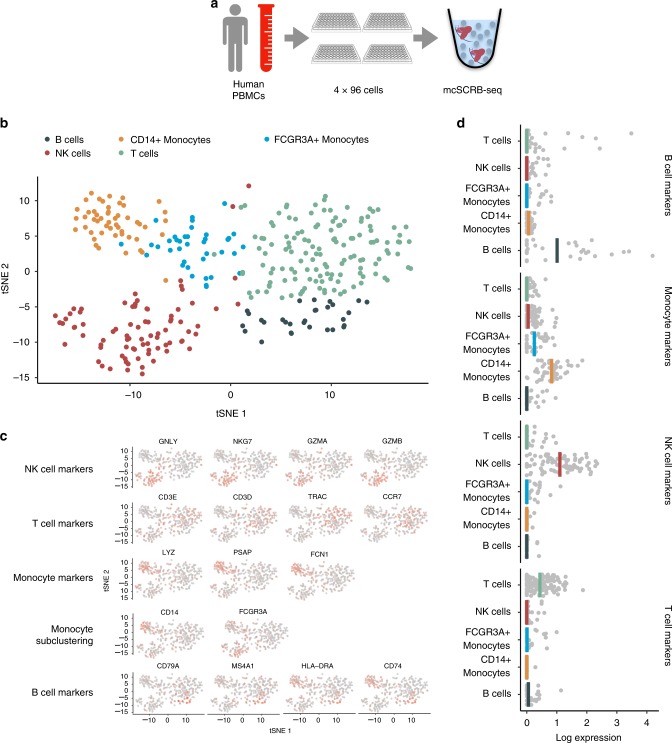
Single-cell RNA sequencing (scRNA-seq) has emerged as a central genome-wide method to characterize cellular identities and processes. Consequently, improving its sensitivity, flexibility, and cost-efficiency can advance many research questions. Among the flexible plate-based methods, single-cell RNA barcoding and sequencing (SCRB-seq) is highly sensitive and efficient. Here, we systematically evaluate experimental conditions of this protocol and find that adding polyethylene glycol considerably increases sensitivity by enhancing cDNA synthesis. Furthermore, using Terra polymerase increases efficiency due to a more even cDNA amplification that requires less sequencing of libraries. We combined these and other improvements to develop a scRNA-seq library protocol we call molecular crowding SCRB-seq (mcSCRB-seq), which we show to be one of the most sensitive, efficient, and flexible scRNA-seq methods to date.


Conflict of interest statement

The authors declare no competing interests.

Figures

Fig. 1
Fig. 1
mcSCRB-seq workflow and the effect of molecular crowding. a Overview of the mcSCRB-seq protocol workflow. Single cells are isolated via FACS in multiwell plates containing lysis buffer, barcoded oligo-dT primers, and Proteinase K. Reverse transcription and template switching are carried out in the presence of 7.5% PEG 8000 to induce molecular crowding conditions. After pooling the barcoded cDNA with magnetic SPRI beads, PCR amplification using Terra polymerase is performed. b cDNA yield dependent on the absence (gray) or presence (blue) of 7.5% PEG 8000 during reverse transcription and template switching. Shown are three independent reactions for each input concentration of total standardized RNA (UHRR) and the resulting linear model fit. c Number of genes detected (>=1 exonic read) per replicate in RNA-seq libraries, generated from 10 pg of UHRR using four protocol variants (see Supplementary Table 1) at a sequencing depth of one million raw reads. Each dot represents a replicate (n = 8) and each box represents the median and first and third quartiles per method with the whiskers indicating the most extreme data point, which is no more than 1.5 times the length of the box away from the box
Fig. 2
Fig. 2
Comparison of mcSCRB-seq to SCRB-seq and other protocols. a Number of UMIs detected in libraries generated from 249 single mESCs using SCRB-seq or mcSCRB-seq when downsampled to different numbers of raw sequence reads. Each box represents the median and first and third quartiles per cell, sequencing depth and method. Whiskers indicate the most extreme data point that is no more than 1.5 times the length of the box away from the box. b The true positive rate of mcSCRB-seq and SCRB-seq estimated by power simulations using the powsimR package. The empirical mean–variance distribution of the 10,904 genes that were detected in at least 10 cells in either mcSCRB-seq or SCRB-seq (500,000 reads) was used to simulate read counts when 10% of the genes are differentially expressed. Boxplots represent the median and first and third quartiles of 25 simulations with whiskers indicating the most extreme data point hat is no more than 1.5 times the length of the box away from the box. The dashed line indicates a true positive rate of 0.8. The matching plot for the false discovery rate is shown in Supplementary Fig. 11d. c Sensitivity of mcSCRB-seq and other protocols, calculated as the number of ERCC molecules needed to reach a 50% detection probability as calculated in Svensson et al. Per-cell distributions are shown using violin plots with vertical lines and numbers indicating the median per protocol
Fig. 3
Fig. 3
mcSCRB-seq distinguishes cell types of peripheral blood mononuclear cells. a PBMCs were obtained from a healthy male donor and FACS sorted into four 96-well plates. Using the mcSCRB-seq protocol, sequencing libraries were generated. b tSNE projection of PBMC cells (n = 349) that were grouped into five clusters using the Seurat package. Colors denote cluster identity. c tSNE projection of PBMC cells (n = 349) where each cell is colored according to its expression level of various marker genes for the indicated cell types. Expression levels were log-normalized using the Seurat package. d Marker gene expression from c was summarized as the mean log-normalized expression level per cell. B-cell markers: CD79A, CD74, MS4A1, HLA-DRA; Monocyte markers: LYZ, PSAP, FCN1, CD14, FCGR3A; NK-cell markers: GNLY, NKG7, GZMA, GZMB; T-cell markers: CD3E, CD3D, TRAC, CCR7

References

    1. Shapiro E, Biezuner T, Linnarsson S. Single-cell sequencing-based technologies will revolutionize whole-organism science. Nat. Rev. Genet. 2013;14:618–630. doi: 10.1038/nrg3542. - DOI - PubMed
    1. Tanay A, Regev A. Scaling single-cell genomics from phenomenology to mechanism. Nature. 2017;541:331–338. doi: 10.1038/nature21350. - DOI - PMC - PubMed
    1. Kolodziejczyk AA, Kim JK, Svensson V, Marioni JC, Teichmann SA. The technology and biology of single-cell RNA sequencing. Mol. Cell. 2015;58:610–620. doi: 10.1016/j.molcel.2015.04.005. - DOI - PubMed
    1. Ziegenhain, C., Vieth, B., Parekh, S., Hellmann, I. & Enard, W. Quantitative single-cell transcriptomics. Brief. Funct. Genomics10.1093/bfgp/ely009 (2018). - PMC - PubMed
    1. Svensson V, et al. Power analysis of single-cell RNA-sequencing experiments. Nat. Methods. 2017;14:381–387. doi: 10.1038/nmeth.4220. - DOI - PMC - PubMed

Publication types