. 2018 Jul 12:12:203.
doi: 10.3389/fncel.2018.00203. eCollection 2018.

The Roles of Rods, Cones, and Melanopsin in Photoresponses of M4 Intrinsically Photosensitive Retinal Ganglion Cells (ipRGCs) and Optokinetic Visual Behavior

Affiliations

The Roles of Rods, Cones, and Melanopsin in Photoresponses of M4 Intrinsically Photosensitive Retinal Ganglion Cells (ipRGCs) and Optokinetic Visual Behavior

Melanie M Schroeder et al. Front Cell Neurosci. .

Abstract

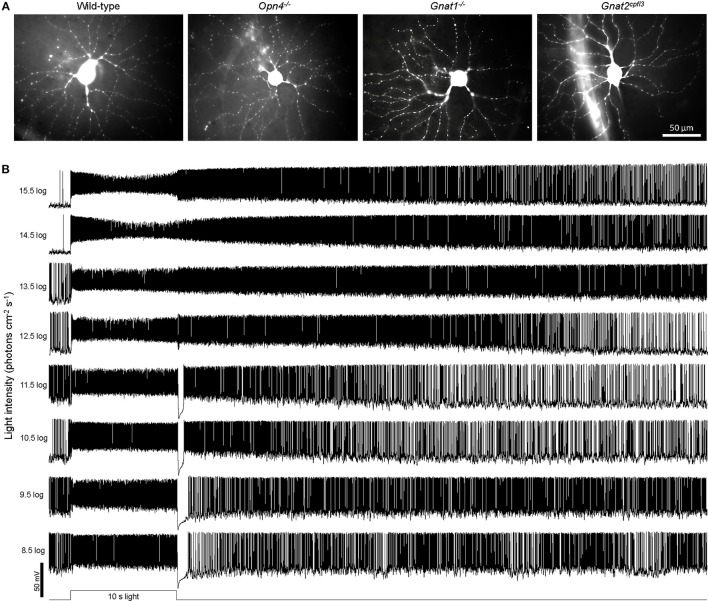
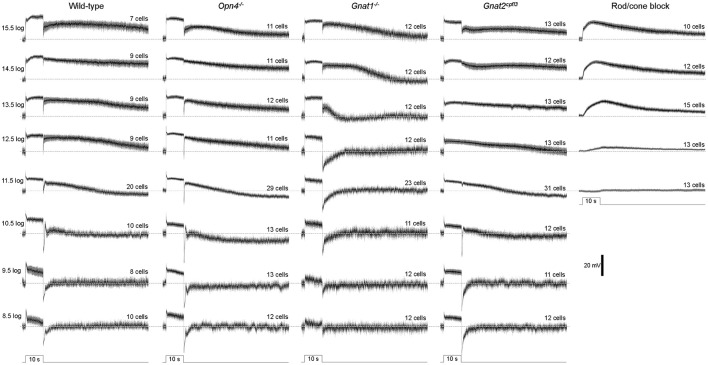
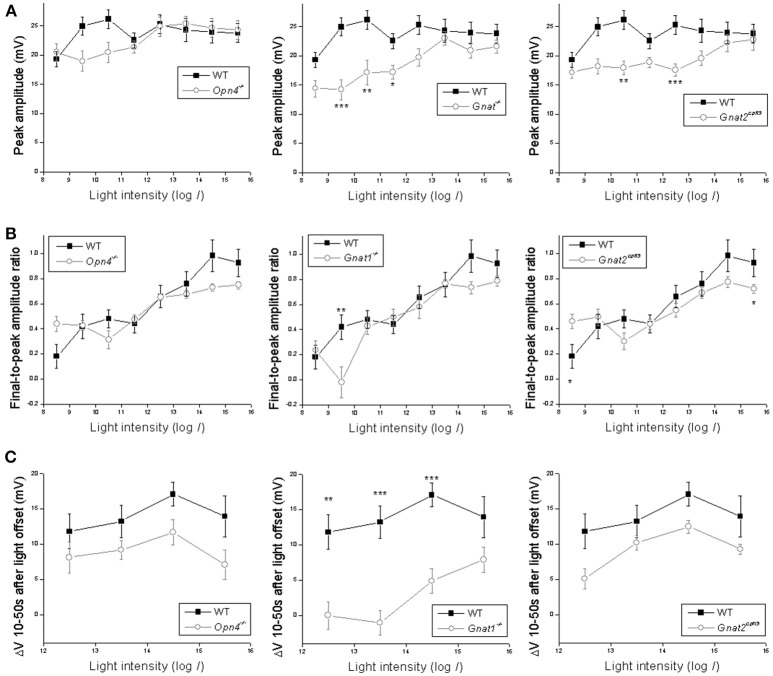
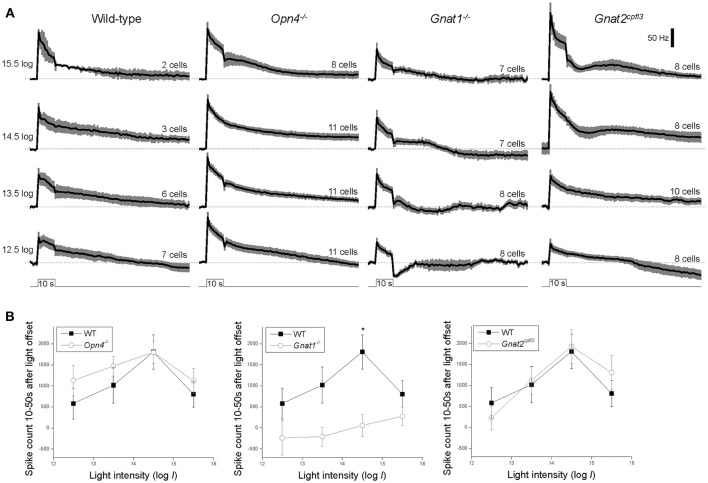
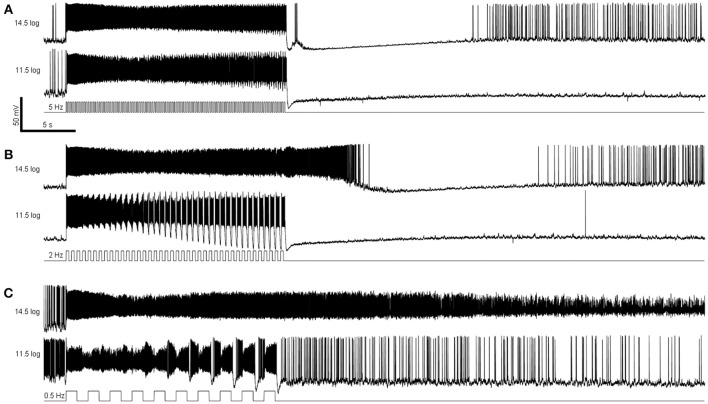
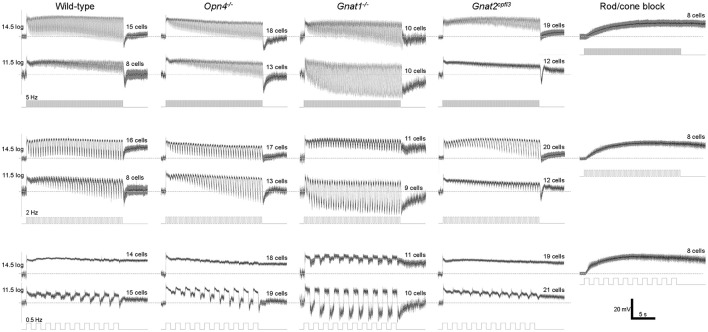
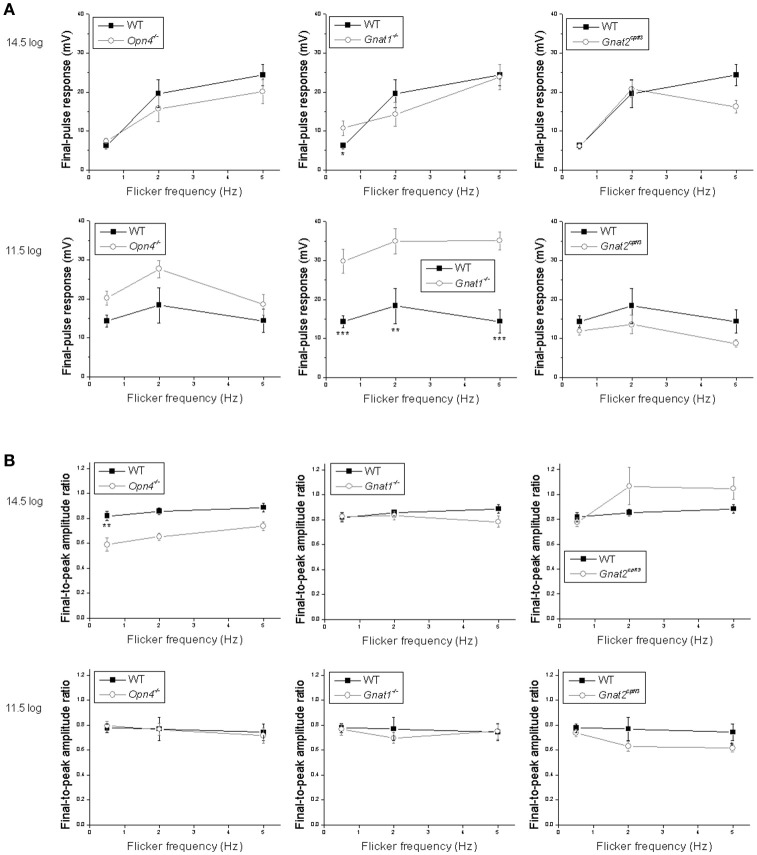
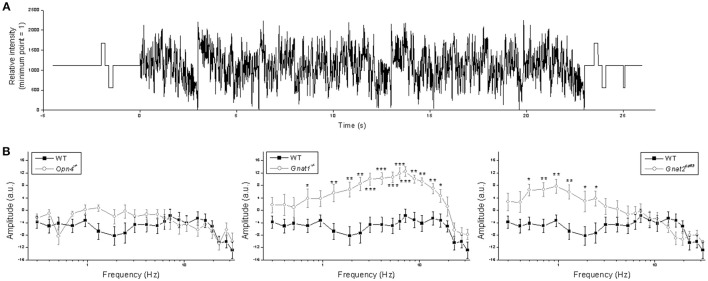
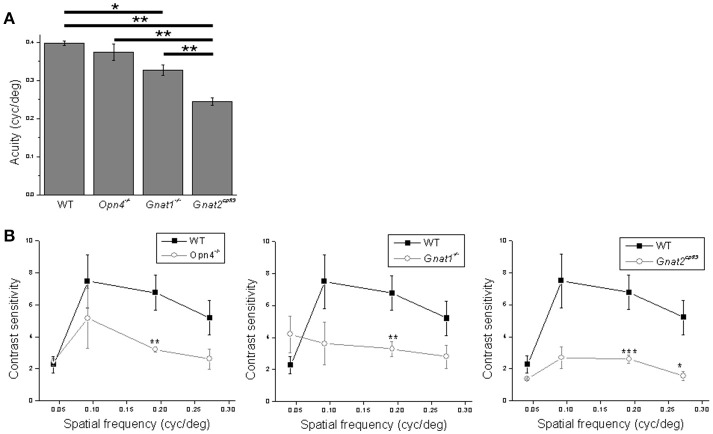
Intrinsically photosensitive retinal ganglion cells (ipRGCs) mediate not only image-forming vision like other ganglion cells, but also non-image-forming physiological responses to light such as pupil constriction and circadian photoentrainment. All ipRGCs respond to light through their endogenous photopigment melanopsin as well as rod/cone-driven synaptic inputs. A major knowledge gap is how melanopsin, rods, and cones differentially drive ipRGC photoresponses and image-forming vision. We whole-cell-recorded from M4-type ipRGCs lacking melanopsin, rod input, or cone input to dissect the roles of each component in ipRGCs' responses to steady and temporally modulated (≥0.3 Hz) lights. We also used a behavioral assay to determine how the elimination of melanopsin, rod, or cone function impacts the optokinetic visual behavior of mice. Results showed that the initial, transient peak in an M4 cell's responses to 10-s light steps arises from rod and cone inputs. Both the sustainability and poststimulus persistence of these light-step responses depend only on rod and/or cone inputs, which is unexpected because these ipRGC photoresponse properties have often been attributed primarily to melanopsin. For temporally varying stimuli, the enhancement of response sustainedness involves melanopsin, whereas stimulus tracking is mediated by rod and cone inputs. Finally, the behavioral assay showed that while all three photoreceptive systems are nearly equally important for contrast sensitivity, only cones and rods contribute to spatial acuity.

Keywords: cone; intrinsically photosensitive retinal ganglion cell (ipRGC); melanopsin; photoreceptor; retina; rod; vision; visual behavior.


Figures

Figure 1
Figure 1
Examples of cellular morphologies and light-step responses. (A) Representative Lucifer Yellow fills of M4 ipRGCs from the four genotypes studied: wild-type, Opn4−/−, Gnat1−/− (which lacks rod photosensitivity), and Gnat2cpfl3 (which lacks cone photosensitivity). (B) Representative light-step responses recorded from a wild-type M4 ipRGC.
Figure 2
Figure 2
Light-step responses averaged from all cells tested. The black traces represent the mean values, and the surrounding gray areas denote S.E.M. The horizontal dashed lines mark the prestimulus baselines. N values are stated above each trace. The cells recorded during rod/cone signaling block included wild-type, Gnat1−/− and Gnat2cpfl3 cells.
Figure 3
Figure 3
Analysis of the light-step responses. Comparisons are made between wild-type cells (black squares) and cells of the other genotypes (open circles) in three aspects of their light-step responses: (A) the peak response amplitude measured near light onset; (B) the ratio of the final response amplitude to the peak response amplitude, as a measure of response sustainedness; and (C) the mean Vm 10–50 s after light offset relative to the baseline, as a measure of the persistence of the light response. N values are identical to those shown in Figure 2. Error bars represent S.E.M. *p < 0.05. **p < 0.01. ***p < 0.001.
Figure 4
Figure 4
Spiking responses to the four highest-intensity light steps. (A) Spike histograms averaged from all cells tested, with 1-s bin width and baseline spiking normalized to 0. The black traces represent the means and the error bars denote S.E.M. N values are indicated above each histogram. (B) The number of light-evoked spikes recorded 10–50 s after stimulus offset, computed by summing the corresponding columns in the baseline-zeroed histograms shown in (A). *p < 0.05.
Figure 5
Figure 5
Examples of flicker responses. (A) Responses to a 5 Hz flicker. (B) Responses to a 2 Hz flicker. (C) Responses to a 0.5 Hz flicker. These responses were recorded from a wild-type M4 ipRGC.
Figure 6
Figure 6
Flicker responses averaged from all cells tested. N values are indicated above each trace. The recordings made during rod/cone signaling block were obtained from wild-type, Gnat1−/− and Gnat2cpfl3 cells.
Figure 7
Figure 7
Analysis of the flicker responses. Comparisons are made between wild-type cells (black squares) and the other genotypes (open circles) in two aspects of their flicker responses: (A) the peak amplitude of the response to the final pulse in the flicker, measured relative to the trough preceding this response; and (B) the ratio of the peak of the final-pulse response to the peak of the first-pulse response, as a measure of the sustainedness of the entire flicker response. N values are identical to those shown in Figure 6. *p < 0.05, **p < 0.01, ***p < 0.001.
Figure 8
Figure 8
Responses to the sum-of-sinusoids stimulus. (A) The sum-of-sinusoids stimulus. (B) Frequency-specific response amplitude comparisons between the wild-type cells (black squares) and the other genotypes (open circles). N values were 15 cells for wild type, 10 cells for Opn4−/−, 9 cells for Gnat1−/−, and 9 cells for Gnat2cpfl3. *p < 0.05, **p < 0.01, ***p < 0.001.
Figure 9
Figure 9
Analysis of the behavioral data. (A) Acuity was assessed using sine wave gratings with 100% contrast. (B) Contrast sensitivity was assessed using sine wave gratings with four different spatial frequencies. In both experiments all mice were male, 4–6 months old, and n = 5 mice per genotype for each testing condition. *p < 0.05, **p < 0.01, ***p < 0.001.

References

    1. Allen A. E., Storchi R., Martial F. P., Petersen R. S., Montemurro M. A., Brown T. M., et al. . (2014). Melanopsin-driven light adaptation in mouse vision. Curr. Biol. 24, 2481–2490. 10.1016/j.cub.2014.09.015 - DOI - PMC - PubMed
    1. Berson D. M. (2003). Strange vision: ganglion cells as circadian photoreceptors. Trends Neurosci. 26, 314–320. 10.1016/S0166-2236(03)00130-9 - DOI - PubMed
    1. Berson D. M. (2008). Retinal ganglion cell types and their central projections. in The Senses: a Comprehensive Reference, Vol. 1, Vision I, eds Masland R. H., Albright T. (San Diego, CA: Academic Press; ), 491–519.
    1. Berson D. M., Castrucci A. M., Provencio I. (2010). Morphology and mosaics of melanopsin-expressing retinal ganglion cell types in mice. J. Comp. Neurol. 518, 2405–2422. 10.1002/cne.22417 - DOI - PMC - PubMed
    1. Berson D. M., Dunn F. A., Takao M. (2002). Phototransduction by retinal ganglion cells that set the circadian clock. Science 295, 1070–1073. 10.1126/science.1067262 - DOI - PubMed

LinkOut - more resources