. 2018 Jul 11:9:849.
doi: 10.3389/fphys.2018.00849. eCollection 2018.

Probenecid Pre-treatment Downregulates the Kidney Cl-/HCO3- Exchanger (Pendrin) and Potentiates Hydrochlorothiazide-Induced Diuresis

Affiliations

Probenecid Pre-treatment Downregulates the Kidney Cl-/HCO3- Exchanger (Pendrin) and Potentiates Hydrochlorothiazide-Induced Diuresis

Sharon Barone et al. Front Physiol. .

Abstract

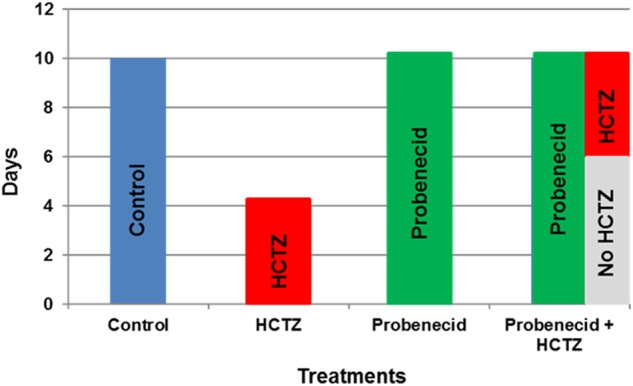
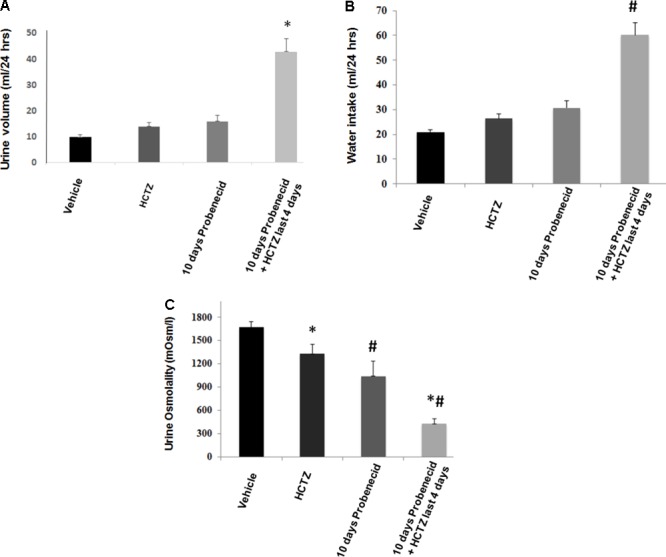
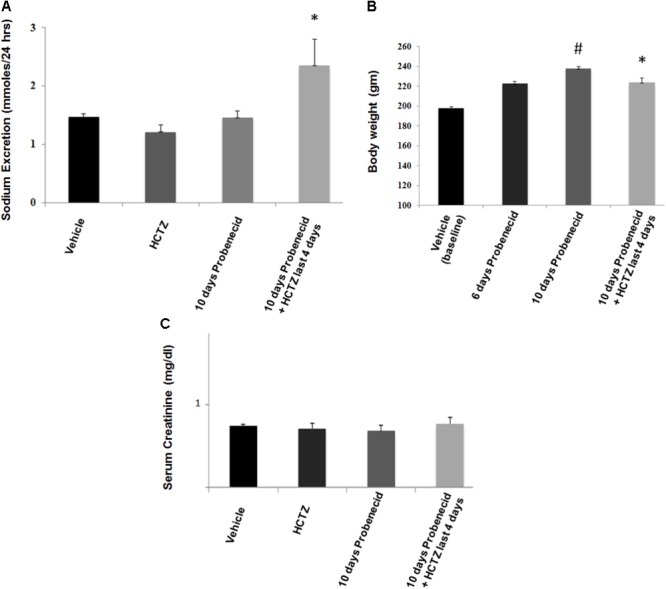
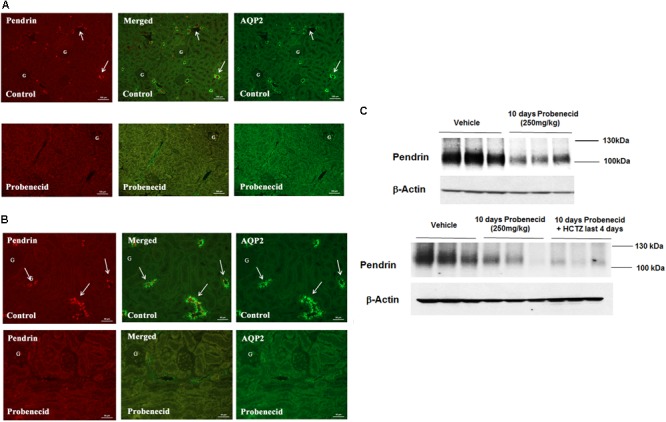
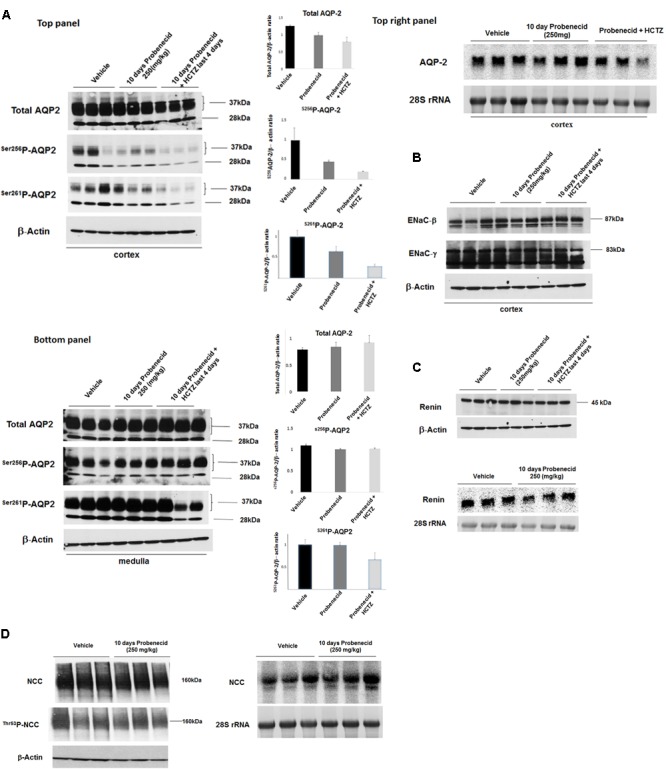
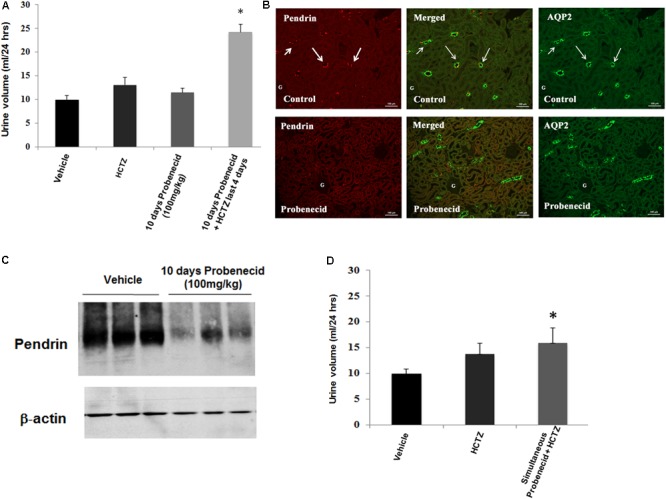
Background: Probenecid is a uricosuric agent that in addition to exerting a positive ionotropic effect in the heart, blocks the ATP transporter Pannexin 1 and inhibits the Cl-/HCO3- exchanger, pendrin. In the kidney, pendrin blunts the loss of salt wasting secondary to the inhibition of the thiazide-sensitive Na+-Cl- co-transporter (NCC/SLC12A3). Hypothesis: Pre-treatment with probenecid down-regulates pendrin; therefore, leaving NCC as the main salt absorbing transporter in the distal nephron, and hence enhances the hydrochlorothiazide (HCTZ)-induced diuresis. Methods: Daily balance studies, blood and urine chemical analysis, immunofluorescence, as well as western and northern blot analyses were utilized to examine the effects of probenecid alone (at 250 mg/kg/day) or in combination with HCTZ (at 40 mg/kg/day) on kidney function and on salt and water transporters in the collecting duct. Results: Male Sprague Dawley rats were subjected to three different protocols: (1) HCTZ for 4 days, (2) probenecid for 10 days, and (3) primed with probenecid for 6 days followed by probenecid and HCTZ for 4 additional days. Treatment protocol 1 (HCTZ for 4 days) only mildly increased the urine volume (U Vol) from a baseline of 9.8-13.4 ml/day. In response to treatment protocol 2 (probenecid for 10 days), U Vol increased to 15.9 ml/24 h. Treatment protocol 3 (probenecid for 6 days followed by probenecid and HCTZ for 4 additional days) increased the U Vol to 42.9 ml/day on day 4 of co-treatment with HCTZ and probenecid (compared to probenecid p = 0.003, n = 5 or HCTZ alone p = 0.001, n = 5). Probenecid treatment at 250 mg/kg/day downregulated the expression of pendrin and led to a decrease in AQP2 expression. Enhanced diuresis by probenecid plus HCTZ was not associated with volume depletion. Conclusion: Probenecid pre-treatment downregulates pendrin and robustly enhances diuresis by HCTZ-mediated NCC inhibition in kidney.

Keywords: Na+-Cl- co-transporter; collecting duct; distal convoluted tubule; pendrin; salt.


Figures

FIGURE 1
FIGURE 1
The experimental protocols examining the effects of probenecid and HCTZ on kidney function. The explanatory time course of probenecid, HCTZ and probenecid plus HCTZ treatment on kidney function in rats.
FIGURE 2
FIGURE 2
Effect of probenecid at 250 mg/kg, with or without HCTZ, on urine volume and water intake. (A) Effect of probenecid and probenecid/HCTZ on urine volume. Rats (5/group) were placed in metabolic cages and after acclimation treated with vehicle (control), HCTZ (4 days), probenecid at 250 mg/kg/24 h (10 days) or probenecid (250 mg/kg/24 h) for 6 days followed by probenecid and HCTZ for 4 additional days. Urine was collected daily and the urine volume was expressed as ml/24 h. (B) Effect of probenecid and probenecid/HCTZ on Water Intake. Measurement of water intake in rats treated with probenecid for 10 days vs. control. For comparison, water intake in rats pre-treated with probenecid and then treated with probenecid and HCTZ is shown. (C) Effect of HCTZ and probenecid on urine osmolality. ∗, # denotes significance between Vehicle vs Probenecid/HCTZ treatment. Urine osmolality measurement in rats treated with HCTZ (40 mg/kg), 10 days of probenecid (250 mg/kg) and a co-treatment with probenecid/HCTZ.
FIGURE 3
FIGURE 3
Effect of probenecid (250 mg/kg/day) with or without HCTZ, on kidney function. (A) Effect of probenecid with or without HCTZ, on salt excretion. Sodium excretion (mmoles/24 h) increased in probenecid primed rats that were treated with probenecid/HCTZ but not in rats treated with HCTZ or probenecid alone. denotes significance vs. all other groups. (B) Body weight measurements in probenecid and Probenecid/HCTZ treated rats. Probenecid-primed animals that were co-treated with probenecid and HCTZ for 4 additional days showed a lower body weight compared to animals that were treated only with probenecid. # denotes significance between Vehicle vs. 10 days Probenecid. (C) Serum creatinine levels in probenecid and probenecid/HCTZ treated animals. Serum creatinine levels (mg/dl) are not significantly different in probenecid (0.68 ± 0.04, n = 5), HCTZ (0.71 ± 0.10) and probenecid/HCTZ-treated groups (0.77 ± 0.05, n = 5) and Vehicle-treated rats (0.74 ± 0.04, n = 5) (p > 0.05 between groups).
FIGURE 4
FIGURE 4
Double immunofluorescence labeling of pendrin and AQP-2 and determination of pendrin abundance in kidneys of animals treated with 250 mg/kg/day of probenecid. (A) Pendrin and AQP-2 double immunofluorescent labeling (low magnification). Top: Control. Images are of AQP2 (right) and pendrin (left), with the merged image in the middle panel. Bottom: Probenecid. Effect of 250 mg/kg/day of Probenecid for 10 days on AQP2 (right) and pendrin (left), with merged image in the middle. (B) Pendrin and AQP-2 double immunofluorescent labeling (high magnification). Top: Control. Depicted are AQP2 (right) and Pendrin (left), with merged image in the middle. Bottom: Probenecid. Effect of 250 mg/kg of probenecid for 10 days on AQP2 (right) and pendrin (left), with merged image in middle. (C) Western blot analysis of pendrin in rats treated with 250 mg/kg probenecid. Top panel: Pendrin abundance in rats treated with 250 mg/kg probenecid. Bottom panel: pendrin abundance in rats treated with probenecid/HCTZ vs. probenecid. The Pendrin abundance, as estimated by scanning densitometry was: Vehicle (0.90 ± 0.06), probenecid (0.46 ± 0.14); n = 3, p = 0.05 and probenecid/HCTZ (0.34 ± 0.05), n = 3; p = 0.0004.
FIGURE 5
FIGURE 5
Expression levels of AQP-2, ENaC subunits and renin in kidneys of experimental groups. (A) AQP2 expression by western and northern hybridization. The expression levels of AQP2 in the cortex and medulla of Vehicle, probenecid, and probenecid/HCTZ treated animals was assessed by western blot analysis. There were no significant differences in Total AQP2, Ser256p-AQP2 or Ser261p-AQP2 levels in the medulla of Vehicle versus probenecid (p = 0.41; p = 0.40; or p = 0.94 respectively) or probenecid/HCTZ (p = 0.12; p = 0.98; or p = 15 respectively) animals when the densitometry values were normalized against β-Actin. There were no significant differences between Total AQP2, Ser256p-AQP2 or Ser261p-AQP2 in the cortices of Vehicle versus probenecid (p = 0.07, p = 0.20, and 0.15; respectively). However, there was a significant difference between the cortices of Vehicle versus probenecid + HCTZ in Total AQP2 (p = 0.0001, n = 3) and Ser261p-AQP2 (p = 0.01, n = 3) (A, left top and bottom panels). Northern blot analyses (B, right top panel) were performed on RNA samples from the cortices of probenecid treated (250 mg/kg) animals. As indicated, mRNA expression levels were not significantly different in vehicle and probenecid treated rats (p = 0.33). (B) ENaC Western blot. The expression levels of ENaC subunits, alpha and gamma, in the cortex were examined using subunit-specific antibodies. As indicated, both subunits showed comparable expression levels in experimental groups. (C) Renin Western and Northern blots. Protein and RNA values were quantified and normalized based on β-Actin or 28S rRNA, respectively. Protein abundance (top panel) and RNA expression (bottom panel) of renin in kidney cortex of Vehicle, probenecid-treated (250 mg/kg/day) and probenecid/HCTZ-treated groups were comparable (p = 0.293, n = 3/group for Western; p = 0.34, n = 3/group for Northern) (C). Student’s unpaired t-test was used for statistical analysis. (D) NCC Western and Northern Blots. The NCC mRNA expression levels (D, right) were comparable in both Vehicle (0.94 ± 0.09, n = 3) and in 250 mg/kg probenecid treatment animals (0.96 ± 0.1, n = 3; p = 0.90). Western blot analysis of total NCC and phosphorylated NCC were comparable in Control and 250 mg/kg/day probenecid treated groups. Left upper panel (NCC): Vehicle (1.02 ± 0.09, n = 3) vs. probenecid (1.02 ± 0.02, n = 3); p = 0.98; and left middle panel (Thr53p-NCC): Vehicle (0.87 ± 0.13, n = 3) vs. probenecid (0.87 ± 0.03, n = 3); p = 0.97.
FIGURE 6
FIGURE 6
Effect of probenecid at 100 mg/kg, with or without HCTZ, on urine volume and pendrin expression. (A) Effect of probenecid pre-treatment on HCTZ-induced diuresis. Data depicts urine output in rats pre-treated with Probenecid at 100 mg/kg for 6 days followed by co-treatment with 100 mg/kg Probenecid and HCTZ for an additional 4 days. When adjusted for body weight, the results, expressed as urine volume/24 h/body weight were as follows: Vehicle (0.05 ± 0.004, n = 12) vs. probencid (100 mg) ± HCTZ (0.11 ± 0.008, n = 7); p = 0.000001. denotes significance between Vehicle vs. Probenecid/HCTZ co-treatment. (B) Double immunofluorescence labeling with pendrin and AQP-2. Top panel: Control. AQP2 (right) and Pendrin (left), with merged image in the middle panel. Bottom: probenecid. Effect of 100 mg/kg of probenecid for 10 days on AQP2 (right) and pendrin (left), with merged images in middle. (C) Western blot analysis of pendrin in probenecid pre-treated rats at 100 mg/kg/day. Western blots indicate significant reduction in the expression of pendrin in rats pre-treated with probenecid at 100 mg/kg/day for 6 days. Vehicle (1.01 ± 0.02, n = 3) vs. 10 days probenecid (100 mg/kg) (0.56 ± 0.11, n = 3; p = 0.02). (D) Effect of simultaneous treatment of probenecid and HCTZ without probenecid priming on urine volume. The magnitude of daily urine volume in simultaneous co-treatment of 100 mg/kg/day of probenecid and HCTZ without probenecid priming was not significantly different when compared to HCTZ-treated animals but was significant vs. vehicle treated rats. When adjusted for body weight, the results, expressed as urine volume/24 h/body weight were as follows: HCTZ (0.06 ± 0.01, n = 5) vs. Simultaneous probenecid + HCTZ (0.07 ± 0.01, n = 4; p = 0.42). denotes significance between Vehicle and Simultaneous treatment of Probenecid/HCTZ. However, there was no significant difference between simultaneous treatment of Probenecid/HCTZ and HCTZ alone.

References

    1. Alshahrani S., Rapoport R. M., Zahedi K., Jiang M., Nieman M., Barone S., et al. (2017). The non-diuretic hypotensive effects of thiazides are enhanced during volume depletion states. PLoS One 12:e0181376. 10.1371/journal.pone.0181376 - DOI - PMC - PubMed
    1. Alshahrani S., Soleimani M. (2017). Ablation of the Cl-/HCO3- exchanger pendrin enhances hydrochlorothiazide-induced diuresis. Kidney Blood Press. Res. 42 444–455. 10.1159/000479296 - DOI - PMC - PubMed
    1. Amlal H., Petrovic S., Xu J., Wang Z., Sun X., Barone S., et al. (2010). Deletion of the anion exchanger Slc26a4 (pendrin) decreases apical Cl-/HCO3- exchanger activity and impairs bicarbonate secretion in kidney collecting duct. Am. J. Physiol. Cell Physiol. 299 C33–C41. 10.1152/ajpcell.00033.2010 - DOI - PMC - PubMed
    1. Bach M. H., Simkin P. A. (2014). Uricosuric drugs: the once and future therapy for hyperuricemia? Curr. Opin. Rheumatol. 26 169–175. 10.1097/BOR.0000000000000035 - DOI - PubMed
    1. Câmpean V., Kricke J., Ellison D., Luft F. C., Bachmann S. (2001). Localization of thiazide sensitive Na+-Cl- cotransport and associated gene products in mouse DCT. Am. J. Physiol. Renal Physiol. 281 F1028–F1035. 10.1152/ajprenal.0148.2001 - DOI - PubMed

LinkOut - more resources