. 2018 Jul 9:9:1560.
doi: 10.3389/fimmu.2018.01560. eCollection 2018.

Immune Cell Profiling During Switching from Natalizumab to Fingolimod Reveals Differential Effects on Systemic Immune-Regulatory Networks and on Trafficking of Non-T Cell Populations into the Cerebrospinal Fluid-Results from the ToFingo Successor Study

Affiliations

Immune Cell Profiling During Switching from Natalizumab to Fingolimod Reveals Differential Effects on Systemic Immune-Regulatory Networks and on Trafficking of Non-T Cell Populations into the Cerebrospinal Fluid-Results from the ToFingo Successor Study

Lisa Lohmann et al. Front Immunol. .

Abstract

Leukocyte sequestration is an established therapeutic concept in multiple sclerosis (MS) as represented by the trafficking drugs natalizumab (NAT) and fingolimod (FTY). However, the precise consequences of targeting immune cell trafficking for immunoregulatory network functions are only incompletely understood. In the present study, we performed an in-depth longitudinal characterization of functional and phenotypic immune signatures in peripheral blood (PB) and cerebrospinal fluid (CSF) of 15 MS patients during switching from long-term NAT to FTY treatment after a defined 8-week washout period within a clinical trial (ToFingo successor study; ClinicalTrials.gov: NCT02325440). Unbiased visualization and analysis of high-dimensional single cell flow-cytometry data revealed that switching resulted in a profound alteration of more than 80% of investigated innate and adaptive immune cell subpopulations in the PB, revealing an unexpectedly broad effect of trafficking drugs on peripheral immune signatures. Longitudinal CSF analysis demonstrated that NAT and FTY both reduced T cell subset counts and proportions in the CSF of MS patients with equal potency; NAT however was superior with regard to sequestering non-T cell populations out of the CSF, including B cells, natural killer cells and inflammatory monocytes, suggesting that disease exacerbation in the context of switching might be driven by non-T cell populations. Finally, correlation of our immunological data with signs of disease exacerbation in this small cohort suggested that both (i) CD49d expression levels under NAT at the time of treatment cessation and (ii) swiftness of FTY-mediated effects on immune cell subsets in the PB together may predict stability during switching later on.

Keywords: cerebrospinal fluid; fingolimod; immunoregulatory network; multiple sclerosis; natalizumab; spanning-tree progression analysis of density-normalized events; viSNE.


Figures
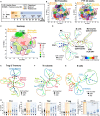
Figure 1
Figure 1
Overview of comprehensive changes of immune cell subset compositions and differential effects on pro- and anti-inflammatory T cells (A) Study setup; data (n = 15) were assessed at baseline under long-term natalizumab (NAT) treatment (orange), after 8 weeks of washout without treatment (WO; light orange), and at time points 4 weeks (FTY4; blue), 16 weeks (FTY16; blue), and 24 weeks (FTY24; blue) after onset of fingolimod treatment indicated by arrows. Healthy donors (HD; gray) and treatment-naive relapsing–remitting multiple sclerosis (RRMS) patients (RRMS; black) represent control groups. (B) Visualization of 10-color flow-cytometry data via viSNE application; merged data of study participants at indicated time points in single cell dot plots (NAT n = 13; FTY24 n = 13). Affiliations of populations are indicated by color-coding circles and labeling; n.d., not defined population. (C) Heatmap illustrates twofold change of reduced (green) and increased (red) percental differences of populations comparing baseline (NAT) to study endpoint (FTY24). (D) Spanning-tree progression analysis of density-normalized events (SPADE) diagram compares long-term NAT with FTY24 and nodes represent groups of cell types in which the color of the node is scaled to the ratio of change in cell frequency; close proximity of the nodes display phenotypical similarity. (E–G) SPADE analysis (n = 13) compares long-term NAT-treated patients to study endpoint (FTY24) and nodes represent ratio of the change of cell frequency of (E) regulatory T-cells, CD4 subpopulations, (F) T-helper subsets, and (G) of B cell subsets. (H) Relative proportions (in %) of flow cytometry data of T-helper subpopulations for indicated time points. (I) Change in absolute cell counts after treatment switch by comparison of FTY4 to the WO time point (in % total). Values represent mean ± SD. Statistical significance was evaluated by linear mixed model; Friedman test (one-way ANOVA). *P ≤ 0.05; **P ≤ 0.01; ***P ≤ 0.001; ****P ≤ 0.0001.
Figure 2
Figure 2
Natalizumab (NAT) inhibits non-T cell invasion into the cerebrospinal fluid (CSF) more efficiently than fingolimod (FTY). Assessment of flow cytometry data attained from fresh CSF and corresponding peripheral blood (PB) samples, at baseline under long-term NAT treatment (NAT; n = 12) and 24 weeks after onset of FTY treatment (FTY24; n = 9). (A) Non-linear neighbor embedding by viSNE application; heatmap represents twofold change increase (red) or decrease (green) of populations comparing baseline (NAT; n = 9) to study endpoint (FTY24; n = 9) of study participants. Affiliations of populations are indicated by color-coding circles and labeling; n.d., not-defined population. (B) Spanning-tree progression analysis of density-normalized events diagram compares CSF samples of long-term NAT with FTY24 and nodes represent groups of cell types in which the color of the node is scaled to the ratio of change in cell frequency; close proximity of the nodes display phenotypical similarity. (C–G) Relative proportions (in %) and total counts (per milliliters) of (C) CD4 and CD8 T cells, (D) B cells, (E) natural killer cells, (F) CD14+CD16 and CD14+CD16+ monocytes, and (G) CD16+/CD16 ratio were assessed in CSF (closed dots) and PB (open dots) comparing FTY (blue) to NAT (orange) treatment; control group naive multiple sclerosis patients (relapsing–remitting multiple sclerosis; black). Values represent mean ± SD. Statistical significance was evaluated by linear mixed model. *P ≤ 0.05; **P ≤ 0.01; ****P ≤ 0.0001.
Figure 3
Figure 3
Preferential enrichment of terminally differentiated and functionally highly competent effector T cell subsets under fingolimod (FTY) treatment. All data (n = 15) were assessed at baseline under long-term natalizumab treatment (NAT), after 8 weeks of washout without treatment (WO) and at time points 4 weeks (FTY4), 16 weeks (FTY16), and 24 weeks (FTY24) after onset of FTY treatment. Healthy donors (HD) and treatment-naive relapsing–remitting multiple sclerosis (RRMS) patients (RRMS) represent control groups. Scatter plots illustrate relative frequency changes (%) of (A) activation marker CD69+ CD4 and CD69+ CD8 T cells. (B) Change in absolute cell counts after treatment switch by comparison of FTY4 to the WO time point (in % total) of CD69+ CD4 and CD69+ CD8 counts to total CD4 and CD8 counts. (C) Relative proportions (in %) of flow cytometry data of functionality markers CX3CR1+ CD4 memory (CD4m) and CX3CR1+ CD8 memory (CD8m), TEMRA CD8 and CD57+ CD8 T cells comparing FTY to NAT treatment at indicated time points. Absolute change after treatment switch comparing CX3CR1+ CD4m and CX3CR1+ CD8m total counts to total CD4 and CD8 memory counts, as well as TEMRA+ CD8 and CD57+ CD8 to absolute counts of CD8 at time points WO to FTY4 (in % total). (D,E) Transmigration assay was used to assess migratory capacity in percent, through human brain microvascular endothelial cell monolayer for 6 h in an in vitro model determined for (C) T cells and B cells, (D) CD4 and CD8 T cells comparing FTY and NAT treated patients to HD and RRMS controls. Values represent mean ± SD. Statistical significance was evaluated by linear mixed model, Kruskal–Wallis test, and Wilcoxon matched-pairs signed rank test. *P ≤ 0.05; **P ≤ 0.01; ***P ≤ 0.001; ****P ≤ 0.0001.
Figure 4
Figure 4
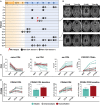
Patients with a stable disease course exhibit significantly reduced CD49d expression levels under long-term natalizumab (NAT) treatment. (A) MR imaging was performed at baseline under long-term NAT treatment (NAT), after 8 weeks of washout without treatment (WO) and at weeks 4, 8, 12, 20, and 24 after onset of fingolimod (FTY) treatment. Numbers of new gadolinium-enhancing (Gd+)-lesion/-s (black pentagon), T2w-lesion/-s (gray square), and clinical multiple sclerosis relapses (red flash) are presented per patient and time point. (B) Examples of the MRI sequences FLAIR and T1-weighted after intravenous gadolinium-DTPA injection (T1w + Gd) of patients no. 6, 11, and 13 who were defined as “exacerbated” are displayed (R = right; L = left). To assess correlation of peripheral immune signatures with clinical response, the study cohort was divided into subgroups: stable (blue; n = 6), intermediate (gray; n = 5), and exacerbated (red; n = 4 time point NAT and FTY4; n = 3 time point FTY24) estimated by clinical criteria. (C) Comparison of population frequency (%) between baseline long-term NAT treatment (NAT), at time points 4 weeks (FTY4) and 24 weeks (FTY24) after onset of FTY treatment, in CD4 T cell subsets, and CX3CR1+ CD4 memory (CD4m) T cells are shown. (D) MFI of CD49d expression on CD4 and CD8 T cells at indicated time points illustrated in scatter plots and direct comparison of CD49d CD4 and CD8 between stable and exacerbated patients at baseline shown in bar graphs. Values represent mean ± SD. Statistical significance was evaluated by Wilcoxon matched-pairs signed rank test. *P ≤ 0.05; **P ≤ 0.01.

References

    1. Steinman L. Weighing in on autoimmune disease: ‘Hub-and-spoke’ T cell traffic in autoimmunity. Nat Med (2013) 19:139–41.10.1038/nm.3088 - DOI - PubMed
    1. Lécuyer M-A, Kebir H, Prat A. Glial influences on BBB functions and molecular players in immune cell trafficking. Biochim Biophys Acta (2016) 1862:472–82.10.1016/j.bbadis.2015.10.004 - DOI - PubMed
    1. Lopes Pinheiro MA, Kooij G, Mizee MR, Kamermans A, Enzmann G, Lyck R, et al. Immune cell trafficking across the barriers of the central nervous system in multiple sclerosis and stroke. Biochim Biophys Acta (2016) 1862:461–71.10.1016/j.bbadis.2015.10.018 - DOI - PubMed
    1. Schneider-Hohendorf T, Rossaint J, Mohan H, Böning D, Breuer J, Kuhlmann T, et al. VLA-4 blockade promotes differential routes into human CNS involving PSGL-1 rolling of T cells and MCAM-adhesion of TH17 cells. J Exp Med (2014) 211:1833–46.10.1084/jem.20140540 - DOI - PMC - PubMed
    1. Koudriavtseva T, Sbardella E, Trento E, Bordignon V, D’Agosto G, Cordiali-Fei P. Long-term follow-up of peripheral lymphocyte subsets in a cohort of multiple sclerosis patients treated with natalizumab. Clin Exp Immunol (2014) 176:320–6.10.1111/cei.12261 - DOI - PMC - PubMed

Associated data