. 2018 Oct;17(5):e12820.
doi: 10.1111/acel.12820. Epub 2018 Jul 27.

Increased transport of acetyl-CoA into the endoplasmic reticulum causes a progeria-like phenotype

Affiliations

Increased transport of acetyl-CoA into the endoplasmic reticulum causes a progeria-like phenotype

Yajing Peng et al. Aging Cell. 2018 Oct.

Abstract

The membrane transporter AT-1/SLC33A1 translocates cytosolic acetyl-CoA into the lumen of the endoplasmic reticulum (ER), participating in quality control mechanisms within the secretory pathway. Mutations and duplication events in AT-1/SLC33A1 are highly pleiotropic and have been linked to diseases such as spastic paraplegia, developmental delay, autism spectrum disorder, intellectual disability, propensity to seizures, and dysmorphism. Despite these known associations, the biology of this key transporter is only beginning to be uncovered. Here, we show that systemic overexpression of AT-1 in the mouse leads to a segmental form of progeria with dysmorphism and metabolic alterations. The phenotype includes delayed growth, short lifespan, alopecia, skin lesions, rectal prolapse, osteoporosis, cardiomegaly, muscle atrophy, reduced fertility, and anemia. In terms of homeostasis, the AT-1 overexpressing mouse displays hypocholesterolemia, altered glycemia, and increased indices of systemic inflammation. Mechanistically, the phenotype is caused by a block in Atg9a-Fam134b-LC3β and Atg9a-Sec62-LC3β interactions, and defective reticulophagy, the autophagic recycling of the ER. Inhibition of ATase1/ATase2 acetyltransferase enzymes downstream of AT-1 restores reticulophagy and rescues the phenotype of the animals. These data suggest that inappropriately elevated acetyl-CoA flux into the ER directly induces defects in autophagy and recycling of subcellular structures and that this diversion of acetyl-CoA from cytosol to ER is causal in the progeria phenotype. Collectively, these data establish the cytosol-to-ER flux of acetyl-CoA as a novel event that dictates the pace of aging phenotypes and identify intracellular acetyl-CoA-dependent homeostatic mechanisms linked to metabolism and inflammation.

Keywords: AT-1/SLC33A1; ATase1; ATase2; acetyl-CoA; lysine acetylation; progeria.


Figures

Figure 1
Figure 1
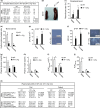
AT‐1 sTg mice are smaller and have a short lifespan. (a) AT‐1 sTg mice were generated with an inducible Tet‐Off expression system under the control of the Rosa26 locus for systemic overexpression. (b) Western blots showing AT‐1 overexpression in different tissues (1, WT; 2, AT‐1 sTg). (c) Representative AT‐1 sTg mouse and WT littermate when 28 and 55 days old. (d) Body weight of male and female WT and AT‐1 sTg mice across their lifespan. (e) Lifespan of AT‐1 sTg mice (maximum lifespan, males = 142 days, females = 147 days, p < 0.0005; median lifespan, males = 96 days, females = 81 days, p < 0.0005). Bars represent mean ± SD. * p < 0.05; ** p < 0.005; # p < 0.0005
Figure 2
Figure 2
AT‐1 sTg mice display progeria‐like features. (a) Examination of WT and AT‐1 sTg mice. Reduced fat accumulation and splenomegaly are evident in both AT‐1 sTg males and females. (b) Total body fat in WT and AT‐1 sTg mice as determined by dual‐energy X‐ray (DEXA) scanning (males, n = 7; females, n = 8). (c) Food intake of WT and AT‐1 sTg mice (males, n = 5; females, n = 5). (d) Skeletal muscle histology. (e) Weight of major organs. Inset shows uterus. (f) Skin alterations and rectal prolapse in AT‐1 sTg mice. (g) H&E staining of a skin section from AT‐1 sTg mice. (h, i) Faxitron X‐ray (femur) (h) and bone mineral density (i) of WT and AT‐1 sTg mice (WT, n = 8; AT‐1 sTg, n = 8). (j) Goldner's trichrome stain of femur sections. (k, l) Echocardiographic assessment of WT and AT‐1 sTg mice (WT, n = 8; AT‐1 sTg, n = 8). Bars represent mean ± SD. * p < 0.05, ** p < 0.005, # p < 0.0005. LVID: d, left ventricular internal diameter end diastole; LVPW: d, left ventricular posterior wall end diastole; LVAW: d, left ventricular anterior wall end diastole
Figure 3
Figure 3
AT‐1 sTg mice display defective hematopoiesis, and reduced levels of circulating glucose, insulin, and cholesterol. (a) Hematologic parameters of WT and AT‐1 sTg mice (males, n = 4; females, n = 6). (b) Representative images of whole spleen from WT and AT‐1 sTg mice. (c, d) Quantitative blood (c) and bone marrow (d) smears in WT and AT‐1 sTg mice (males, n = 4; females, n = 4). (e) Quantitation (left) and representative images (right) of colony‐forming unit‐erythroid (CFU‐E) colonies 2 days after plating splenic cells (1 × 105) from WT (n = 3) and AT‐1 sTg (n = 3) mice in methylcellulose containing Epo, SCF, IL‐3, and IL‐6. (f) Quantitation (left) and representative images (right) of burst‐forming unit‐erythroid (BFU‐E) colonies 5 days after plating splenic cells (1 × 105) from WT (n = 3) and AT‐1 sTg (n = 3) mice in methylcellulose containing Epo, SCF, IL‐3, and IL‐6. (g, h) Fasting levels of glucose (g) and insulin (h) in plasma (males, n = 5; females, n = 5). (i, j) Oral glucose tolerance test (OGTT) in WT and AT‐1 sTg mice (males, n = 5; females, n = 5). AUCglucose (i) and AUCinsulin (j) are shown. (k) Plasma lipid profile in WT and AT‐1 sTg mice (males, n = 5; females, n = 5). Bars represent mean ± SD. * p < 0.05, ** p < 0.005, # p < 0.0005. WBC: white blood cells; RBC: red blood cells; HCT: hematocrit; Hb: hemoglobin. WBC: white blood cells; RBC: red blood cells; HCT: hematocrit; Hb: hemoglobin
Figure 4
Figure 4
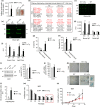
AT‐1 sTg mice display systemic and tissue inflammation. (a) Weight of axillary lymph nodes in WT and AT‐1 sTg mice (n = 6 per group). (b) Plasma inflammatory markers (out of a total of 42 different analytes tested). In red, analytes that were changed in both males and females (males, n = 6; females, n = 6). (c, d) Dot blot of tissue immunoglobulins determined with anti‐mouse IgG. Representative images (c) and quantitation of results (d) are shown. The analysis was carried out in liver (WT, n = 3; AT‐1 sTg, n = 3). (e, f) Western blot showing tissue immunoglobulins determined with anti‐mouse IgG. Representative images (e) and quantitation of results (f) are shown. The analysis was carried out in liver (WT, n = 3; AT‐1 sTg, n = 3). (g, h) Flow cytometry showing B cell (g), and neutrophil (h) population in bone marrow and peripheral blood (WT, n = 3; AT‐1 sTg, n = 3). (i) Western blot showing p16 levels in liver. Representative images (left panel) and quantitation of results (right panel) are shown (WT, n = 7; AT‐1 sTg, n = 7). (j) p21 mRNA quantitation in liver (WT, n = 7; AT‐1 sTg, n = 7). (k, l) SA‐β‐Gal staining in liver and hepatocytes. Representative images (k) and quantitation of results (l) are shown (WT, n = 3; AT‐1 sTg, n = 3). (m, n) Proliferation potential of cultured MEF expressed as proliferation rate at each passage (m; n = 3 different MEF lines/group) and as cell number after plating (n; n = 3 different MEF lines/group). Bars represent mean ± SD. * p < 0.05, ** p < 0.005, # p < 0.0005. EC: extracellular; FA: formic acid‐soluble; Hc: heavy chain; IC: intracellular; Lc: light chain; MB: membrane‐bound
Figure 5
Figure 5
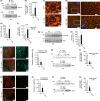
AT‐1 sTg mice display defective reticulophagy and expansion of the ER. (a, b) Western blot showing levels of acetylated‐Atg9a (Atg9a‐Ac) in ER preparations from liver. Representative blots are shown in (a) while quantitation of results is shown in (b) (WT, n = 3; AT‐1 sTg, n = 3). (c) Structure illumination microscopy (SIM) of ER in isolated hepatocytes showing size and morphology of sheet‐like structures. (d, e) SIM showing Fam134b puncta on ER of isolated hepatocytes. Quantitation of results is shown in (e) (WT, n = 8; AT‐1 sTg, n = 7). (f) Fam134b mRNA quantitation in liver (WT, n = 6; AT‐1 sTg, n = 5). (g, h) Western blot showing levels of Fam134b in ER preparations. Representative blots are shown in (g) while quantitation of results is shown in (h) (WT, n = 4; AT‐1 sTg, n = 4). (i, j) SIM showing reduced Fam134b/LC3β co‐localization on ER of isolated hepatocytes from AT‐1 sTg mice. Quantitation of results is shown in (j) (WT, n = 5; AT‐1 sTg, n = 5). (k, l) Western blot showing co‐immunoprecipitation of Atg9a and Fam134b in WT and AT‐1 sTg mice. Representative blots are shown in (k) while quantitation of results is shown in (l) (WT, n = 8; AT‐1 sTg, n = 8). (m, n) SIM showing reduced Sec62/LC3β co‐localization on ER of isolated hepatocytes from AT‐1 sTg mice. Quantitation of results is shown in (n) (WT, n = 5; AT‐1 sTg, n = 5). (o, p) Western blot showing co‐immunoprecipitation of Atg9a and Sec62 in WT and AT‐1 sTg mice. Representative blots are shown in (o) while quantitation of results is shown in (p) (WT, n = 7; AT‐1 sTg, n = 7). Bars represent mean ± SD. * p < 0.05, ** p < 0.005, # p < 0.0005. N: nucleus
Figure 6
Figure 6
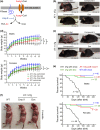
ATase1/ATase2 inhibition rescues the progeria‐like phenotype and lifespan of AT‐1 sTg mice. (a) Schematic view of the ER acetylation machinery with compound 9 acting on the ATases downstream of AT‐1. (b, c) Representative images of AT‐1 sTg mice with and without compound 9 treatment. Dox treatment is shown for comparison. Mice at two different ages are shown. (d) Body weight of male and female AT‐1 sTg mice with and without compound 9 treatment. Dox‐treated AT‐1 sTg mice are shown for comparison (n = 16 for all groups). (e) Lifespan of AT‐1 sTg mice with and without compound 9 treatment. Dox‐treated AT‐1 sTg mice are shown for comparison (p < 0.0005, all vs. AT‐1 sTg with chow). (f) Postmortem examination of WT and AT‐1 sTg mice treated with compound 9. Dox treatment is shown for comparison. Mice were 8 months old when examined. Bars represent mean ± SD. ** p < 0.005; # p < 0.0005
Figure 7
Figure 7
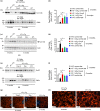
ATase1/ATase2 inhibition restores reticulophagy in AT‐1 sTg mice. (a, b) Western blot showing Atg9a‐Fam134b interaction on the ER membrane of compound 9‐treated AT‐1 sTg mice. Dox‐treated and 3‐month‐old AT‐1 sTg mice are shown for comparison. Representative blots are shown in (a) while quantitation of results is shown in (b) (n = 6 for all groups). (c, d) Western blot showing ER levels of Fam134b in compound 9‐treated AT‐1 sTg mice. Dox‐treated and 3‐month‐old AT‐1 sTg mice are shown for comparison. Representative blots are shown in (c) while quantitation of results is shown in (d) (n = 6 for all groups). (e, f) Western blot showing Atg9a‐Sec62 interaction on the ER membrane of compound 9‐treated AT‐1 sTg mice. Dox‐treated and 3‐month‐old AT‐1 sTg mice are shown for comparison. Representative blots are shown in (e) while quantitation of results is shown in (f) (n = 6 for all groups). (g) Structure illumination microscopy (SIM) of ER in isolated hepatocytes from compound 9‐treated AT‐1 sTg mice. Dox‐treated and 3‐month‐old AT‐1 sTg mice are shown for comparison. (h) High‐magnification images with Imaris‐mediated reconstruction. Bars represent mean ± SD. * p < 0.05, ** p < 0.005, # p < 0.0005. N: nucleus

References

    1. Campisi, J. (2004). Fragile fugue: p53 in aging, cancer and IGF signaling. Nature Medicine, 10(3), 231–232. 10.1038/nm0304-231 - DOI - PubMed
    1. Chiplunkar, S. , Bindu, P. S. , Nagappa, M. , Bineesh, C. , Govindaraj, P. , Gayathri, N. , … Taly, A. B. (2016). Huppke‐Brendel syndrome in a seven months old boy with a novel 2‐bp deletion in SLC33A1. Metabolic Brain Disease, 31(5), 1195–1198. 10.1007/s11011-016-9854-6 - DOI - PubMed
    1. Ding, Y. , Dellisanti, C. D. , Ko, M. H. , Czajkowski, C. , & Puglielli, L. (2014). The endoplasmic reticulum‐based acetyltransferases, ATase1 and ATase2, associate with the oligosaccharyl‐transferase to acetylate correctly folded polypeptides. Journal of Biological Chemistry, 289(46), 32044–32055. 10.1074/jbc.M114.585547 - DOI - PMC - PubMed
    1. Ding, Y. , Ko, M. H. , Pehar, M. , Kotch, F. , Peters, N. R. , Luo, Y. , … Puglielli, L. (2012). Biochemical inhibition of the acetyltansferases ATase1 and ATase2 reduces b‐secretase (BACE1) levels and Ab generation. Journal of Biological Chemistry, 287, 8424–8433. - PMC - PubMed
    1. Duran‐Aniotz, C. , Cornejo, V. H. , & Hetz, C. (2016). Targeting endoplasmic reticulum acetylation to restore proteostasis in Alzheimer's disease. Brain, 139(3), 650–652. 10.1093/brain/awv401 - DOI - PubMed

LinkOut - more resources