

Elite swimmers do not exhibit a body mass index trade-off across a wide range of event distances
- PMID: 30051831
- PMCID: PMC6053931
- DOI: 10.1098/rspb.2018.0684
Elite swimmers do not exhibit a body mass index trade-off across a wide range of event distances
Abstract
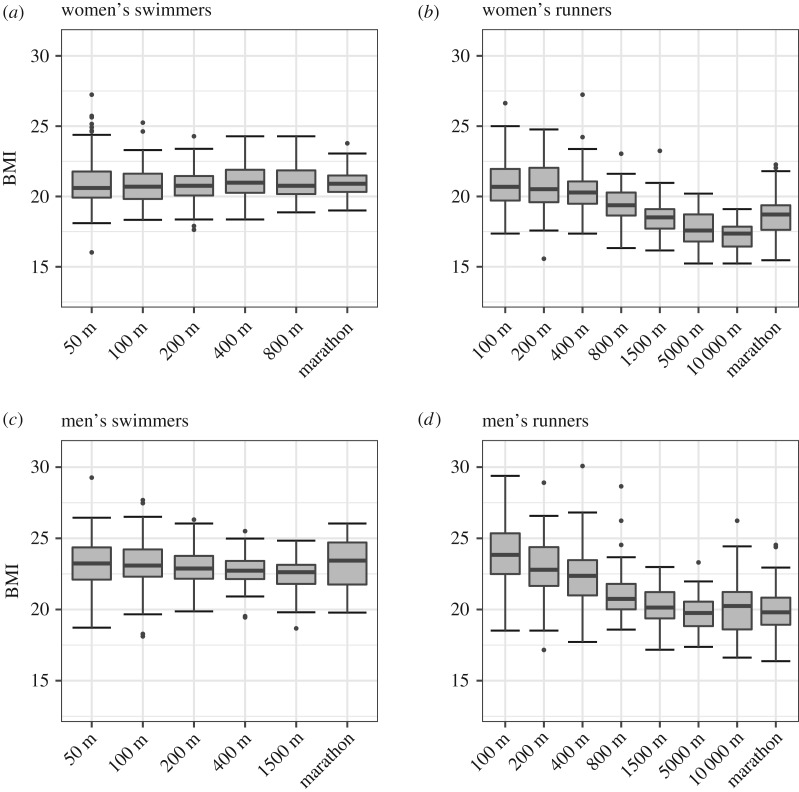
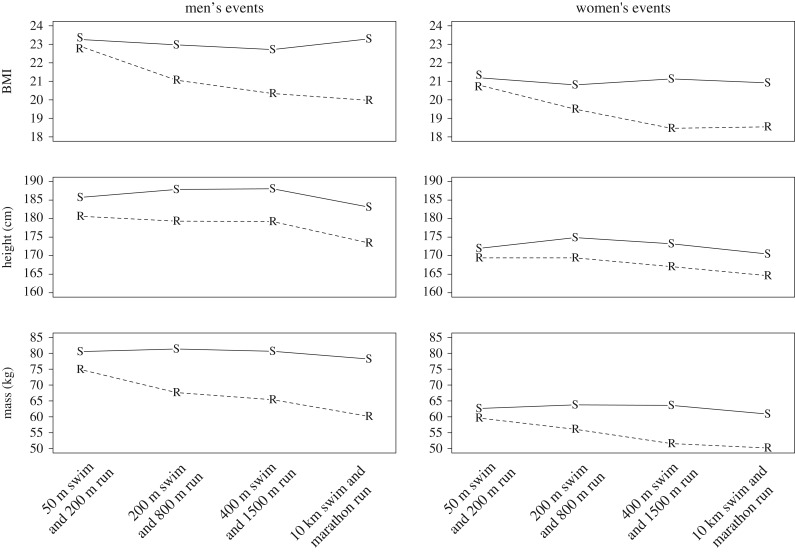
There is a trade-off reflected in the contrasting phenotypes of elite long-distance runners, who are typically leaner, and elite sprinters, who are usually more heavily muscled. It is unclear, however, whether and how swimmers' bodies vary across event distances from the 50 m swim, which is about a 20-30 s event, to the 10 000 m marathon swim, which is about a 2 h event. We examined data from the 2012 Olympics to test whether swimmers' phenotypes differed across event distances. We show that across all swimming event distances, from the 50 m sprint to the 10 000 m marathon, swimmers converge on a single optimal body mass index (BMI) in men's and women's events, in marked contrast with the strong inverse relationship between BMI and event distance found in runners. The absence of a speed-endurance trade-off in the body proportions of swimmers indicates a fundamental difference in design pressures and performance capability in terrestrial versus aquatic environments.
Keywords: evolution; locomotion; running; sports; swimming; trade-off.
© 2018 The Author(s).
Conflict of interest statement
We declare we have no competing interests.
Figures
References
Publication types
MeSH terms
Associated data
LinkOut - more resources
Full Text Sources
Other Literature Sources